Overall, 48% of all registered voters identify as Democrats or lean Democratic compared with 44% who identify as Republican or lean toward the GOP.
While partisan preferences among all voters are narrowly split, there are wide gaps in leanings among demographic groups. There are fundamental differences in how men and women, young and old, whites, blacks and Hispanics describe their partisan leanings. In many cases, persistent differences have grown wider in recent years.
Wide race, gender differences in partisan leaning
 There are wide differences in partisan affiliation between white, black and Hispanic registered voters. Partisan differences between these groups have been relatively stable in recent years, but are wider than they were in 2008 – a relative high point in Democratic affiliation – when white voters were less Republican in their partisan orientation than today.
Overall, 35% of white registered voters identify as independent, while about as many (36%) identify as Republican and fewer (26%) identify as Democratic.
Partisan identification among whites is little changed since 2012. Since 2008, however, the share of white voters who identify as Democrats has declined five points, while the share who identify as independent has increased four points. There has been a slight two-point increase in the share identifying as Republican.
The Republican Party holds a sizable advantage in leaned party affiliation among white voters. This year, 54% of white registered voters identify as Republican or lean toward the GOP, while just 39% affiliate with the Democratic Party or lean Democratic. While that represents only a modest shift since 2012, when Republicans led by a 12-point margin (52%-40%), in 2008 leaned partisan alignment among whites was closely divided (46% Republican, 44% Democratic). The current 15-point GOP edge in leaned partisan affiliation is as wide an advantage for the Republican Party among white voters as Pew Research Center has measured over the past 24 years.
Trends in party affiliation among black voters have been largely stable over recent years. Overall, 87% of black voters identify with the Democratic Party or lean Democratic, compared with just 7% who identify as Republican or lean Republican.
Among Hispanic voters, the Democratic Party holds a 63% to 27% advantage over the GOP in leaned party identification. As with black voters, trends in party affiliation among Hispanic voters have changed little in recent years.
Based on 2016 surveys, 66% of Asian registered voters identify with the Democratic Party or lean Democratic, compared with 27% who identify as Republican or lean Republican. The data for party identification among Asians are based on interviews conducted in English.
 When it comes to gender and partisan preferences, the Republican Party has a significant advantage in leaned party identification among men, an edge that has widened in recent years, while the Democratic Party holds a large advantage among women.
By 51% to 41%, more men identify as Republican or lean toward the GOP than identify as Democrats or lean Democratic. This marks a major change from 2008, when the Democratic Party briefly enjoyed a slight edge in leaned party identification among men (46%-44%). The current 10-point edge held by the Republican Party also is significantly higher than the four-point edge the GOP held in 2012.
More than half of women (54%) identify as Democrats or lean Democratic, compared with 38% who say they are Republican or lean Republican. Democrats have held a consistent advantage among women in leaned party identification in Pew Research Center surveys dating to 1992. The current 16-point edge is as large as it has been over the past several years, but somewhat smaller than the 21-point advantage the Democratic Party held among women in 2008.
Among white men, the Republican Party holds a wide 61% to 32% advantage in leaned party identification. The GOP advantage among white men is larger than it was in both 2008 (51%-39%) and 2012 (56%-36%).
Among white women, about as many registered voters identify as Republican or lean toward the Republican Party (47%) as say they identify as Democrats or lean Democratic (46%). Leaned party identification among white women has fluctuated over the past decade: in 2008, the Democratic Party held a 49% to 42% advantage in leaned party identification; in 2012, the Republican Party held a 48%-44% edge.
Democrats hold wide advantage among college graduates
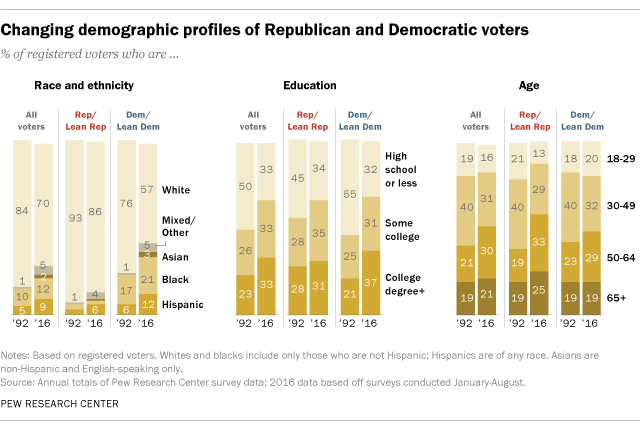
 Trends in partisan identification among those with different levels of education have undergone major changes over the last two decades. Less-educated voters – once a strong Democratic bloc – have moved toward the Republican Party, while college graduates have moved toward the Democratic Party.
In 1992, Democrats held an 18-point advantage in leaned partisan identification among those with no more than a high school degree (55% vs. 37%). This Democratic advantage persisted through the 1990s and early 2000s but has evaporated over the course of the last eight years.
In 2008, the Democratic edge in leaned party affiliation among those with no college experience was 17 points: 53% said they identified as Democrats or leaned Democratic, compared with 36% who identified as Republican or leaned Republican. Today, the picture is dramatically different: 46% now identify as Democrats or lean Democratic, compared with about as many (45%) who identify as Republican or lean Republican.
Patterns in party affiliation are the reverse among college graduates. The Democratic Party currently holds a 53% to 41% advantage in leaned party identification among voters with a college degree or more. In 1992, 49% of college graduates preferred the GOP, while 45% affiliated with the Democratic Party. The Republican Party began to lose ground among college graduates in the second half of George W. Bush’s first term, and by 2008, the Democratic Party held a 10-point edge in leaned party affiliation among college graduates (51% to 41%). The Democratic advantage narrowed by the midterm election year of 2010, but has reemerged over the last six years.
The partisan preferences of voters with some college experience, but no degree, are divided. In 2016, about as many identify as Republican or lean Republican (46%) as identify as Democrats or lean Democratic (45%). In 2008 – the Democratic Party’s recent high-water mark in party affiliation – Democrats had a 10-point advantage in leaned party identification among those with some college experience. That edge was not long-lasting and disappeared by 2010.

The Republican Party’s gains among those with no college experience are particularly pronounced among white voters. Currently, 59% of whites with no college experience identify as Republican or lean Republican, compared with just 33% who identify as Democrats or lean Democratic. This is a dramatic shift from 2007, when the Democratic Party held a slight 46% to 42% edge among non-college whites in partisan affiliation.
By contrast, white voters with at least a college degree are evenly divided in their leaned partisan affiliation (48% Democrat vs. 47% Republican). The balance of leaned party affiliation among white college graduates is about the same as it was in 2008 and 2012, but is less Republican than in 2010. Throughout the 1990s and early 2000s, white college graduates were significantly more likely to lean toward the Republican than Democratic Party.
The GOP holds a 21-point advantage today in partisan affiliation among white voters with some college experience but no degree (57% to 36%). The Republican Party has held an edge in leaned party affiliation among white voters with some college experience over each of the last 24 years. The current GOP advantage among whites with some college experience is comparable to the 19-point edge the party held in 2012 and larger than the five-point edge it held in 2008.
 In 1992, an identical 44% of white men and white women who had not graduated from college identified as Republican or leaned Republican. Today, white men without a college degree (65%) are much more likely than white women without a college degree (51%) to identify as or lean Republican. The current gap between the two groups in Republican affiliation is as wide as it has been in the past quarter-century.
The gap in Republican affiliation among college educated white men and white women, by contrast, is about the same today as it has been over the course of the last 24 years. Overall, 54% of white men with a college degree identify as Republican or lean Republican, compared with 41% of white women with at least a college degree. The current 13-point gap in Republican affiliation between the two groups is the same as it was in 1992.
 The overall Democratic advantage among voters who have graduated from college is driven in large part by the strong Democratic tilt of those with postgraduate experience. Nearly six-in-ten (59%) registered voters with postgraduate experience identify with the Democratic Party or lean Democratic, compared with far fewer (36%) who identify as Republican or lean Republican. The Democratic advantage among those with postgraduate experience began to emerge in George W. Bush’s first term and is currently as wide as it has been in Pew Research Center surveys dating to 1992.
Among those who have received a college degree but do not have any postgraduate experience, the Democratic Party holds a more modest edge: Half identify as Democrats or lean Democratic, while 44% identify as Republican or lean toward the GOP.
Among white voters with postgraduate experience, the Democratic Party has a 54% to 42% advantage in leaned party identification. This is the only educational group among whites where the Democratic Party holds a significant edge over the GOP. Among whites with a college degree but no postgraduate experience, 50% identify with the Republican Party or lean that way, compared with 45% who identify as Democrats or lean Democratic.
Party identification across generations
 Among Millennials, the youngest adult generation (today ages 18-35), 41% identify as independents, compared with 34% who identify as Democrats and just 22% who identify as Republicans. The share of Millennials who identify as independent is up eight points since 2008.
On leaned party affiliation, however, Millennials have a strong Democratic orientation. By 57% to 36% more Millennial voters identify as Democrats or lean Democratic than identify as Republican or lean Republican.
The partisan leanings of Gen Xers and Baby Boomers are more closely divided. Overall, somewhat more Gen Xers identify as Democrats or lean Democratic (48%) than identify as Republicans or lean Republican (42%). Among Baby Boomers, the GOP holds a slight 49% to 45% edge in leaned party affiliation. Gen Xers and Baby Boomers have been relatively split in their partisan leanings for much of the past 24 years, though the Democratic Party briefly held a fairly wide advantage among both groups between 2006 and 2008.
 Among members of the Silent Generation, which includes voters who are today between the ages of 71 and 88, the Republican Party has opened a wide advantage in leaned party affiliation over the past several years. By 53% to 40% more members of the Silent Generation identify as or lean Republican than Democratic. This is the largest advantage for the GOP among Silent Generation voters in Pew Research surveys dating to 1992.
Millennials now match Baby Boomers as the generation that represents the largest number of eligible voters in the country. While Millennials are a large and diverse cohort, there continues to be no sign of differences in partisanship among younger and older member of the generation. Similar shares of Millennials ages 18-25 (58%) and 26-35 (56%) identify as Democrats or lean towards the Democratic Party.
 Among white voters, as many Millennials identify as Republican or lean Republican (47%) as say they identify as Democrats or lean Democratic (47%). Among all older generations, the GOP has a significant advantage in leaned party affiliation among white voters, including a 24-point edge among white voters in the Silent generation.
Among non-white voters, the Democratic Party holds a wide advantage in leaned party affiliation and there is little difference in patterns across generations. Roughly seven-in-ten non-white voters in each generation identify as Democrats or lean Democratic.
Party identification across religious groups
 White evangelical Protestants – long a solidly Republican group – have become even more likely to identify with the Republican Party in recent years. Currently, about three-quarters of white evangelicals (76%) identify with the GOP or lean Republican, compared with just 20% who are Democrats or lean Democratic. The share affiliating with the GOP is up 12 points since 2008, including a five-point uptick since 2012.
The partisan leanings of white mainline Protestants today are similar to those of white voters overall. By 55% to 37%, more affiliate with the GOP than Democratic Party. In 2008 – a recent high-point in Democratic affiliation – white mainline Protestants were divided: As many aligned themselves with the Democratic Party as the Republican Party (45% each). The Republican Party regained a significant advantage in leaned partisan affiliation among mainline Protestants by 2010 and the current 18-point GOP edge is as large as it’s been in the last two decades.
Black Protestants remain solidly Democratic in their partisan orientation and there has been little change in their affiliation over the past few decades. Today, nearly nine-in-ten (88%) identify as Democrats or lean Democratic, while only 6% say they affiliate with the GOP.
 Catholics are split in their partisan preferences: About as many affiliate with the GOP (47%) as the Democratic Party (46%). The Democratic Party has traditionally enjoyed an advantaged in leaned party affiliation among all Catholics, but the GOP has made gains in recent years: 2013 marked the first time in about two decades that Catholics were no more likely to affiliate with the Democratic Party than the Republican Party.
The shift among all Catholics toward the GOP has been driven by white Catholics. Nearly six-in-ten white Catholic registered voters (58%) now identify as Republican or lean Republican, compared with 37% who identify as Democrats or lean Democratic. White Catholics are 17 points more likely to affiliate with the GOP than they were in 2008 and eight points more likely than there were in 2012.
Hispanic Catholics remain overwhelmingly Democratic in their partisan preferences: Nearly seven-in-ten (69%) identify as Democrats or lean toward the Democratic Party. About a quarter (23%) of Hispanic Catholics affiliate with the GOP.
 The share of Mormons identifying as Republican has edged down slightly in the last four years. Currently, about half of Mormons (48%) describe themselves as Republicans, while 35% say they are independents and just 13% identify as Democrats. In 2012, when Mitt Romney was the GOP nominee for President, 61% of Mormons identified as Republicans.
On leaned party affiliation, 69% of Mormons identify as Republican or lean toward the GOP. This also marks a slight decline from 2012 when 78% of Mormons affiliated with or leaned toward the Republican Party.
 Jewish registered voters continue to strongly prefer the Democratic Party over the GOP. Overall, 74% of Jewish voters identify as Democrats or lean toward the Democratic Party, compared with 24% who identify as Republicans or lean toward the Republican Party. The share of Jews who identify as Democrats or lean Democratic has grown slightly over the past few years, though the balance of leaned party affiliation among Jewish voters is about the same as it was in 2008.
Among voters who do not affiliate with a religious group, 45% identify as independent, compared with 39% who identify as Democrats and just 12% who identify as Republican.
 Religiously unaffiliated voters continue to be overwhelmingly Democratic in their orientation. About two-thirds (66%) identify as Democrats or lean Democratic, compared with 25% who identify or lean Republican. In 1994, the Democratic Party held a somewhat smaller 52% to 33% edge among religiously unaffiliated voters.