
Pew Research Center

FOR RELEASE AUGUST 18, 2016

Clinton, Trump Supporters Have Starkly Different Views of a Changing Nation

Voters remain skeptical that either would make a good president

FOR MEDIA OR OTHER INQUIRIES:

Communications Department
202.419.4372
www.pewresearch.org

RECOMMENDED CITATION

Pew Research Center, August 2016, "Clinton, Trump Supporters Have Starkly Different Views of a Changing Nation"

About Pew Research Center

Pew Research Center is a nonpartisan, nonadvocacy fact tank that informs the public about the issues, attitudes and trends shaping the world. It does not take policy positions. The Center conducts public opinion polling, demographic research, computational social science research and other data-driven research. It studies politics and policy; news habits and media; the internet and technology; religion; race and ethnicity; international affairs; social, demographic and economic trends; science; research methodology and data science; and immigration and migration. Pew Research Center is a subsidiary of The Pew Charitable Trusts, its primary funder.

© Pew Research Center 2026

Table of contents

  • About Pew Research Center
  • Clinton, Trump Supporters Have Starkly Different Views of a Changing Nation
  • 1. Voters’ general election preferences
  • 2. Perceptions of the presidential candidates
  • 3. Views of the country and feelings about growing diversity
  • 4. How voters view the country’s problems
  • 5. Issues and the 2016 campaign
  • 6. Views of Barack Obama and the political parties
  • Methodology

Clinton, Trump Supporters Have Starkly Different Views of a Changing Nation

Voters remain skeptical that either would make a good president

Supporters of Hillary Clinton and Donald Trump disagree on a range of policy issues, from terrorism to free trade. Yet they also have more fundamental differences over long-term changes in the country and the next generation’s future prospects.

A new national survey finds that Trump supporters overwhelmingly believe that life in America is worse than it was 50 years ago “for people like them.” Fully 81% of registered voters who support Trump say life has gotten worse, compared with just 11% who say it has gotten better (6% say it is about the same).
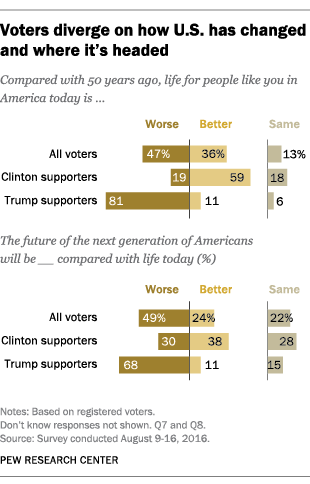
Most Clinton supporters take the opposite view: 59% say life for people like them has gotten better over the past half-century, while 19% think it has gotten worse and 18% see little change.

The candidates’ supporters have contrasting expectations for the nation’s future. Trump backers are broadly pessimistic – 68% say life for the next generation will be worse than today. Clinton supporters have mixed assessments. Nearly four-in-ten (38%) say life will be better, 28% say it will be about the same and just 30% say it will be worse.

The latest national survey by Pew Research Center, conducted August 9-16 among 2,010 adults, including 1,567 registered voters, finds little change overall in voters’ views of how the nation has changed and its future prospects since March, during the presidential primaries. But the divisions evident in that survey are striking in the context of the general election.

The current survey finds that Clinton holds a narrow lead over Trump in a four-way test that includes Libertarian candidate Gary Johnson and Green Party nominee Jill Stein: 41% of registered voters say if the election were held today they would support Clinton or lean toward Clinton, 37% would back Trump, 10% favor Johnson and 4% back Stein.

There continue to be stark differences in candidate support across demographic groups. Women back Clinton over Trump by a wide 49% to 30% margin, while men support Trump by 45% to 33%. And there remain pronounced educational divides: Those with postgraduate degrees back Clinton by about three-to-one (59% vs. 21%); among those with some or no college experience, preferences are divided (41% back Trump, 36% Clinton, 9% Johnson and 5% Stein).

As was the case earlier this year, most voters have doubts that either Clinton or Trump would make a good president. Just 27% of registered voters say that Trump would make a good or great president, while about twice as many (55%) say he would be either poor or terrible (with 43% saying he would make a “terrible” president). Just 15% say Trump would make an “average” president.
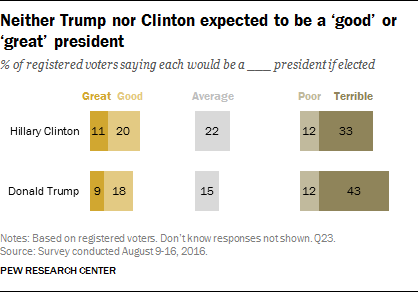
Opinions about how Clinton might do as president are not as negative. Still, only about a third of voters (31%) say she would be a good or great president, while 22% say would be average and 45% think she would be a poor (12%) or terrible (33%) president.

Sizable shares of voters also think there is a distinct possibility that, if elected, either candidate – but especially Trump – would make a serious mistake that would damage the country. More than half of all registered voters (55%) say Trump has a “big chance” of making a major mistake that would hurt the country; 44% of voters say the same about Clinton.
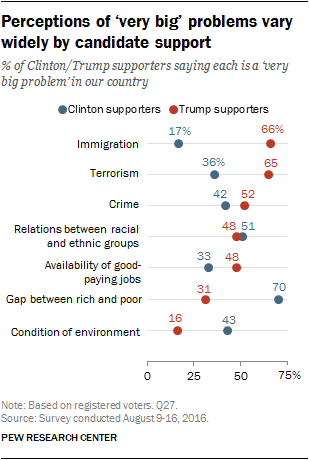
Clinton and Trump supporters are far apart in their perceptions of some of the major problems facing the country. About two-thirds of Trump backers cite immigration (66%) and terrorism (65%) as “very big” problems in the United States. Among Clinton supporters, just 17% say immigration is a very big problem and 36% view terrorism as a major problem.

Trump supporters also are more likely than Clinton supporters to say that crime (52% vs. 42%) and the availability of good-paying jobs (48% vs. 33%) are very big problems.

Among Clinton supporters, 70% say the gap between the rich and poor is a very big problem, by far the highest percentage of seven issues included in the survey. Among Trump supporters, just 31% cite this as a major problem. And Clinton supporters are more than twice as likely as Trump backers to view the condition of the environment as a very big problem for the country (43% vs. 16%).

Where candidates’ supporters stand on key issues

Voters continue to register opposition to the idea of subjecting Muslims living in the United States to additional scrutiny as part of the federal government’s efforts to combat terrorism. Nearly two-thirds of voters (64%) say that Muslims living in the U.S. should not be subject to greater scrutiny solely because of their religion. Just 30% say Muslims in this country should be subject to more scrutiny than members of other religious groups.

Clinton and Trump supporters take opposing views on this issue, but Clinton supporters are more unified. About eight-in-ten registered voters (82%) who support Clinton for president are opposed to subjecting Muslims living in the U.S. to extra scrutiny. A smaller majority of Trump supporters (57%) favor giving Muslims more scrutiny than people in other religious groups, while 37% oppose this policy.

Foreign trade also has been a contentious issue throughout the 2016 campaign. Currently, 45% of voters say free trade agreements have been a good thing for the United States, while about as many (47%) say they have been a bad thing.

Clinton supporters, by a wide margin (59% to 32%), view free trade agreements positively. An even larger majority of Trump supporters (68%) view them negatively. The pattern is similar in opinions about the proposed Trans-Pacific Partnership trade agreement (TPP), though larger shares of voters do not offer an opinion about the TPP.
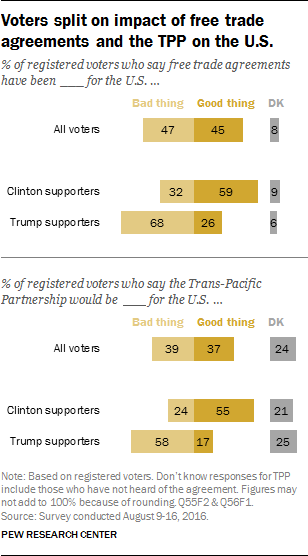
More than half of Clinton supporters (55%) view the TPP as a good thing for the United States, while most Trump supporters (58%) view the proposed trade deal as a bad thing.

Republican opposition to free trade agreements has increased dramatically in the past year. As recently as May 2015, more Republican voters said that free trade agreements had been a good thing for the U.S. (51%) than said they had been a bad thing (39%). Today, 61% say it is bad thing, while just 32% have a positive view. Democrats’ views are little changed over this period. The survey finds that Barack Obama’s overall approval rating remains positive: Currently 53% of the public approves of his job performance, while 42% disapprove. While voters who support Clinton and Trump diverge over the problems facing the country and how to solve them, they do agree on one thing: Majorities of both Trump supporters (80%) and Clinton supporters (63%) say that if Clinton were to win the presidency, she would continue Obama’s policies.

But the candidates’ supporters differ widely over the impact of Clinton extending Obama’s policies. Most Clinton supporters who expect this to happen view this as a good thing (59% of Clinton voters overall). By contrast, the vast majority of Trump supporters who say Clinton would continue Obama’s policies – 78% of his supporters overall – say it would be a bad thing.

Other important findings

Clinton’s bid for history. Most registered voters, regardless of their feelings toward Clinton, say that the election of a woman president would be very (39%) or somewhat (22%) important historically. But while an overwhelming share of Clinton supporters (85%) sees this milestone as historically important, just 33% of Trump supporters agree. Among Trump supporters, women are no more likely than men to regard the election of a woman president as historically important.

Republicans feel better about their party. While the share of the public with a favorable view of the Republican Party remains low (38%), Republicans are taking a more positive view of their party. Currently, 82% of Republicans have a favorable view of the GOP, up from 69% in June.

Nation’s diversity viewed positively. A majority of registered voters (57%) say an increasing number of people of many different races and ethnic groups and nationalities makes the country a better place to live, while about a third (34%) say it makes no difference and 8% say it makes the U.S. a worse place to live. Clinton supporters (72%) are far more likely than Trump supporters (40%) to view the nation’s increasing diversity positively.

1. Voters’ general election preferences

Currently, 41% of registered voters say they would vote for Hillary Clinton if the general election were held today, while 37% say they would vote for Donald Trump, 10% say they would vote for Gary Johnson and 4% say they would vote for Jill Stein.

Differences in support across demographic groups are largely consistent with preferences at earlier points in this cycle.

There continues to be a sizable gender gap in vote preferences: Women favor Clinton over Trump by 19 percentage points (49% to 30%), while men back Trump by a 12-point margin (45% to 33%). (For more on the gender gap, see “A Closer Look at the Gender Gap in Presidential Voting”).

Educational differences also are substantial, especially among white voters. Overall, voters with postgraduate degrees favor Clinton by a wide margin (59% vs. 21%), with 10% and 5% expressing support for Johnson and Stein, respectively. College graduates also favor Clinton (47% vs. 34%). Preferences are divided among those with some college experience or less: 41% back Trump, 36% favor Clinton (9% say Johnson and 5% Stein).

White voters without a college degree support Trump by roughly two-to-one (51% vs. 26%). By a smaller margin, college-educated white voters support Clinton (47%) over Trump (33%).

And divides across religious groups continue to be wide, as white evangelical Protestant voters overwhelmingly show support for Trump over Clinton in the four-way contest (63% vs. 17%). By contrast, religiously unaffiliated voters are more likely to rally around Clinton than Trump: 56% back her, compared with 19% who support Trump, 13% who prefer Johnson and 5% who would vote for Stein.

Profiling the candidates’ supporters

Gary Johnson is currently backed by 10% of all registered voters in a four-way race. When asked their preference in a two-way race, Johnson backers split evenly: 43% say they would support Clinton in a two-way contest, while 42% would favor Trump.

Johnson’s supporters are younger on average than voters who back either Clinton or Trump. Nearly a third (32%) of Johnson’s supporters in the four-way contest are younger than 30. This is roughly double the share of Clinton (15%) or Trump supporters (12%) who are younger than 30. Only 29% of Johnson backers are 50 or older, compared with 50% of Clinton supporters and 62% of Trump voters.

The racial and ethnic makeup of the candidates’ coalitions is also quite different. The overwhelming majority of Trump (87%) and Johnson supporters (79%) are white. By contrast, while a majority of Clinton backers are also white (58%), about a quarter of her supporters are black (24%) and one-in-ten (10%) are Hispanic.

A majority of those who support Johnson are independents (62%) and they are divided roughly evenly between those who lean toward the Republican Party (28%) and the Democratic Party (24%), while 14% decline to lean toward either party. Just 7% of all registered voters – and just 3% each of Clinton and Trump supporters – are independents who decline to lean.

More ‘negative voting’ than in ‘08

Supporters of both candidates continue to voice attitudes of “negative voting” more now than in the past few presidential cycles. Those who choose Clinton or Trump in the four-way contest express mixed views as to whether their vote is more for their own candidate, or against the opposing candidate.

Among Trump supporters, 44% say their choice is more a vote for Trump than a vote against Clinton, compared with 53% who say their vote is more against Clinton than for Trump. Those who support Clinton are slightly more likely to say their vote is more for the candidate (53%) than to say their vote is against Trump (46%).

Eight years ago, far more supporters said their choice was more a vote for their candidate than said it was a vote against the opposing candidate. In August 2008, 59% of voters who favored John McCain thought of their choice as more for McCain, compared with 35% who said it was a vote against Barack Obama. And fully 68% of those who supported Obama said their vote was more for Obama, more than twice as many as said their choice was more a vote against McCain (25%).

2. Perceptions of the presidential candidates

As has been the case since January, there is widespread skepticism that either Clinton or Trump would make a good president.

Just 27% of registered voters say Trump would be a great or good president; 15% say he would be average, while 12% say he would be poor and 43% say he would be terrible.

Views of a potential Hillary Clinton presidency are only somewhat less negative. About three-in-ten (31%) say she would be a great or good president, compared with 22% who say she would be average and 12% who think she would make a poor president. A third of voters (33%) say Clinton would be terrible as president – 10 points lower than the share who say this about Trump.

These numbers are little changed since March, when about a quarter said Donald Trump would be a “great” (10%) or “good” (16%) president and about a third said the same about Hillary Clinton (11% great, 22% good). As was the case in the spring, more say either candidate would make a poor or terrible president than say either would make a good or great one.

Supporters of Trump and Clinton are confident that their preferred candidate would make a great or good president. A 68%-majority of those supporting Trump say he would make a great (23%) or good (45%) president. This is similar to the positive views Clinton supporters have of their candidate: 69% say she would be a great (24%) or good (45%) president.

Nonetheless, both Trump and Clinton supporters are more likely to say the opposing candidate would make a terrible president than to say their own candidate would make a good or great one. An overwhelming majority of Clinton supporters (83%) say they believe Trump would make a “terrible” president. A slightly smaller – though still wide – majority of Trump supporters (72%) say they believe Clinton would be a terrible president if elected.

Younger Clinton supporters are somewhat less likely than older supporters to say that she would be a great or good president. Three-quarters (75%) of Clinton supporters age 50 and older say she would make a good or great president; 63% of Clinton backers under the age of 50 say this.

Most say Clinton would continue Obama’s policies if elected

Two-thirds of voters (67%) think that if Hillary Clinton were to win the presidency she would continue the policies of the Obama administration; just 27% think she would take the country in a different direction.

Among the 67% of voters who think Clinton would continue Obama’s policies, more say that this would be a bad thing (37% of all voters) than say it would be a good thing (28% of all voters).

Among Clinton’s supporters, 63% expect that she would continue Obama’s policies and most (59% 0f all Clinton supporters) say this would be a good thing.

Eight-in-ten Trump supporters (80%) say that Clinton would continue Obama’s policies if she were to be elected, but almost all of those who expect her to continue the current administration’s policies say this would be a bad thing (78% of all Trump supporters).

In September 2008, fewer than half of all registered voters (45%) thought John McCain would continue George W. Bush’s policies, if elected. At that time, a large majority of Obama supporters (79%) said McCain would continue Bush’s policies, compared with just 13% of McCain’ supporters.

Voters see chance of both candidates making major mistakes as president

Majorities of voters say there is at least some chance that both Hillary Clinton and Donald Trump would make major mistakes that would hurt the country, if they were elected president.

Overall, 55% of voters say there is a big chance that Donald Trump would make major mistakes as president, while another 31% say there is some chance. Just 13% say there is hardly any chance that Trump would make major mistakes that would hurt the country.

Voters express slightly less concern about a Hillary Clinton presidency: 44% say there is a big chance she would make major mistakes and 32% say there is some chance. About two-in-ten (22%) say there is hardly any chance – nine points higher than the share of voters who say this about Trump.

About half of Clinton’s supporters (51%) say there is at least some chance she would make major mistakes as president, while 48% think that there is hardly any chance.

Trump supporters are somewhat more likely than Clinton supporters to say there is at least some chance their candidate would make major mistakes as president; 67% of Trump backers say this, compared with 32% who say there is hardly any chance that Trump would make major mistakes.

Most say election of a woman as president would be historically important

Less than a month after Hillary Clinton became the first female presidential nominee of a major political party, most voters (60%) say it would be either very (41%) or somewhat (21%) important historically for the country to elect a woman president.

Women (65%) are 10 points more likely than men (55%) to say the election of a woman president would be would be very or somewhat important historically. There are far wider differences in views by candidate preference.

Among Clinton supporters, fully 85% say the election of a woman would be very or somewhat important, including comparable shares of men (82%) and women (86%).

By contrast, about two-thirds (64%) of Trump supporters say the election of a woman as president would be not too or not at all important. This view is held by a majority of both men (62%) and women (67%) who support Trump.

3. Views of the country and feelings about growing diversity

Overall, voters remain divided over whether life for people like them in the country today is better or worse compared with 50 years ago: 36% say that life today is better for people like them, 47% say it is worse and 13% say it is about the same.

But these perceptions are starkly different among supporters of the two major party candidates: About eight-in-ten (81%) Trump backers say that things have gotten worse for people like them compared with 50 years ago. Just 19% of Clinton supporters say the same. A 59% majority of Clinton supporters say life is better for people like them; only 11% of Trump voters think this.

As was the case earlier this year, there are significant demographic differences in these views. About half (51%) of black voters say life is better today for people like them and just 20% say it is worse (23% say it is about the same). By contrast, white voters are more likely to say life has gotten worse (52%) than say it has gotten better (33%); 12% say it

is little different. Hispanics are divided on this question: 4o% say life is better for people like them than it was a half-century ago, while about as many (39%) say it is worse (17% say it is about the same).

And better-educated voters continue to be more likely than those with less education to say life in this country for people like them has improved: 45% of those with a college degree say life is better today, 36% say it is worse and 14% say it is about the same. Among those with less education, roughly half (53%) say life today is worse for people like them, while 32% say it is better (13% say it is about the same).

Overall, voters’ opinions on this question are little changed since March, but a wide partisan divide has grown wider: In March, 66% of Republican and Republican-leaning voters said that life was better for people like them 50 years ago; today, 72% express this view. At the same time, Democrats’ assessments have become more positive: In March, 48% of Democratic and Democratic-leaning voters thought that life is better today compared with 50 years ago; currently 55% say this.

Will the future of the next generation be better or worse?

When asked about the next generation of Americans, 49% of registered voters say the future will be worse compared with life today. Just a quarter (24%) say that life for the next generation will be better, while 22% say things will be about the same.

Clinton supporters are roughly evenly divided on this question: 38% say things will be better for the next generation, 30% say they will be worse, while 28% say they will be about the same. Trump backers overwhelmingly say life for the next generation will be worse: 68% say this, while just 11% say it will be better and 15% say it will be about the same.

Views of the future also differ across demographic groups: While 52% of white voters say the future of the next generation will be worse than today and just 22% say it will be better (20% say it will be the same), black and Hispanic voters are somewhat less pessimistic. About four-in-ten of those in each group say life will be worse for the next generation.

Voters with a college degree are also somewhat less negative about the future: 27% say life will be better for the next generation while 44% say it will be worse. By comparison, 52% of those with less education say things will be worse for the next generation. There are no significant age differences in views on this question.

Overall, 33% of voters both say that life today is worse for people like them compared with 50 years ago and that life for future generations will be worse than today. A majority of Trump supporters (58%) hold this combination of views, compared with just 12% of Clinton backers. Conversely, Clinton supporters are far more likely than Trump supporters to say that things are both better today than 50 years ago and that they will be even better for future generations (31%, compared with just 2% of Trump supporters).

Voters are confident that U.S. can solve its problems

Nearly two-thirds (65%) of voters say that “as Americans, we can always find ways to solve our problems and get what we want,” while just 32% say that “the country can’t solve many of its important problems.” Majorities of both Clinton supporters and Trump supporters have an optimistic view of the nation’s ability to solve its problems, but that view is more prevalent among Clinton backers (71% vs. 58% of Trump supporters).

Those with higher levels of education are the most positive in their assessments of the nation’s ability to solve its problems: 78% of those with postgraduate degrees say this. By comparison, a narrower majority (56%) of those with no college experience say the same.

How has increasing diversity impacted the country?

Overall, 57% of registered voters say an increasing number of people of many different races, ethnic groups and nationalities in the U.S. makes the country a better place to live, while just 8% say increasing diversity makes the country a worse place to live; 34% say it doesn’t make much difference either way.

Among Clinton supporters, 72% think increasing diversity makes the U.S. a better place to live compared with only 2% who say it makes the U.S. a worse place to live. About a quarter (26%) say greater diversity doesn’t make much difference for life in the U.S.

About as many Trump supporters say greater diversity doesn’t make much difference for life in the U.S. (43%) as say it makes the U.S. a better place to live (40%); 16% of Trump supporters say an increasing number of people of many different races, ethnic groups and nationalities makes the U.S. a worse place to live.

Across levels of educational attainment, those with no more than a high school diploma are the least likely to say increasing diversity makes the U.S. a better place to live. About four-in-ten (42%) of those with no more than a high school diploma say greater diversity makes the country a better place compared with majorities of those with some college experience (59%), college graduates (66%) and postgraduates (76%).

Views of additional security scrutiny for U.S. Muslims

When it comes to the federal government’s efforts to prevent terrorism, 64% of voters say Muslims living in the U.S. should not be subject to additional scrutiny solely because of their religion; far fewer (30%) say U.S. Muslims should receive more scrutiny than people in other religious groups.

By an overwhelming margin (82%-14%), Clinton supporters say the government should not give more scrutiny to Muslims in the U.S. solely because of their religion. By contrast, most Trump supporters (57%) say Muslims living in the U.S. should be subject to more scrutiny than people in other religions groups; 37% of Trump supporters say they should not be.

Among Trump supporters, 63% of those who think he would be a great or good president say U.S. Muslims should receive additional security scrutiny, while 30% say they should not. Among Trump supporters who say he would be an average or worse president, 52% oppose additional federal scrutiny for U.S. Muslims, while 43% say they should be subject to more scrutiny.

4. How voters view the country’s problems

Voters view a number of issues as significant problems for the country. About half of registered voters (52%) say the gap between the rich and the poor is a “very big problem,” while nearly as many cite relations between racial and ethnic groups (48%) as a very big problem. Terrorism (46%) and crime (45%) also are considered very big problems by voters.

Roughly four-in-ten say immigration and the availability of good-paying jobs (38% each) are very big problems in the country, while somewhat fewer (30%) cite the condition of the environment.

On the list of seven issues, immigration and terrorism stand out as especially serious problems among Trump supporters; nearly two-thirds cite each as very big problems in the country (66% immigration, 65% terrorism).

Clinton supporters express far less concern about both issues. Just 17% describe immigration as a very big national problem; 40% say it is a moderately big problem, while 42% say it is either a small problem or not a problem at all. In addition, only about a third of Clinton supporters (36%) say terrorism is a very big problem in the country.

Trump supporters also are more likely than Clinton backers to say that crime (52% vs. 42%) and the availability of good-paying jobs (48% vs. 33%) are very big problems.

Far more Clinton supporters (70%) than Trump supporters (31%) view the gap between rich and poor as a major problem in the country. And while 43% of Clinton supporters rate the condition of the environment as a very big problem, just 16% of Trump supporters say this. While 43% of Trump backers say the condition of the environment is a moderately big problem, 38% say it is a small problem or not a problem.

Where Trump and Clinton supporters agree most is on the extent to which relations between racial and ethnic groups are a problem. About half of both camps view this as a very big problem (51% of Clinton supporters and 48% of Trump supporters).

Across demographic groups there are varying perspectives on the dominant concerns facing the country.

For example, black voters are more likely than whites to cite several issues as very big problems, including the rich-poor gap (by 30 percentage points), crime (26 points), the condition of the environment (18 points) and relations between racial and ethnic groups (16 points).

Among supporters of Trump and supporters of Clinton, there are divisions by level of family income over the concerns facing the country.

About four-in-ten Trump supporters (39%) from households with annual family income under $50,000 view the gap between the rich and poor as a very big problem, compared with 26% of Trump supporters with incomes of more than $50,000. Comparable shares of Clinton supporters in both income categories view the gap between rich and poor as a very big problem.

On crime, Clinton supporters are divided along income lines while Trump supporters are not. A majority (59%) of Clinton supporters with household income below $50,000 view crime as a very big problem, compared with just 26% of Clinton supporters with annual family incomes of $50,000 or more.

Lower income Clinton supporters also are more likely than higher income backers of Clinton to view terrorism as a very big problem (48% vs. 26%), while for Trump supporters, majorities at all income levels see this as a very big problem.

5. Issues and the 2016 campaign

On free trade, an issue area that has been front and center in the 2016 campaign, Trump supporters are broadly negative: They see trade agreements as having been bad for the U.S. and their own family’s finances and think the Trans-Pacific Partnership would be a bad thing for the country. Clinton supporters are on the opposite side of the issue: Most view free trade agreements positively and say they have done more to help than hurt their family’s finances.

In addition, there are signs that Trump’s focus on trade has moved Republicans from a generally positive view of free trade agreements to a more negative one.

Clinton supporters broadly back an increase in the federal minimum wage to $15 an hour, while a majority of Trump supporters are opposed. There also are fundamental differences between Clinton and Trump supporters in their views of the government’s role in regulating business and helping needy Americans.

Views of free trade agreements and the TPP

Donald Trump supporters are broadly critical of the impact of free trade agreements on the U.S. generally and of the potential impact of the Trans-Pacific Partnership, or TPP. By contrast, most Clinton backers have a positive impression of free trade and the TPP.

Far more Trump supporters say free trade agreements have been a bad thing (68%) than good thing (26%) for the U.S. When it comes to the proposed TPP agreement, views are also broadly negative: 58% say the TPP would be bad for the U.S., compared with just 17% who say it would be good for the U.S. A quarter of Trump supporters (25%) do not express an opinion about how the TPP would affect the U.S.

By 59% to 32%, more Clinton supporters say free trade agreements have been a good thing than bad thing for the U.S. Clinton supporters also view the potential impact of the TPP positively: 55% say it would be a good thing for the U.S., while 24% say it would be a bad thing and 21% are unsure about its impact on the country or say they have not heard of it.

Over the course of the last year, Republicans’ overall views on the issue of free trade have shifted in a more negative direction, while Democratic views are little changed.

In the current survey, nearly twice as many Republican and Republican-leaning registered voters say free trade agreements have been a bad thing for the U.S. than say they have been a good thing (61%-32%). This reflects a sharp shift in GOP opinion from just over a year ago. In May 2015 – one month before Donald Trump announced his candidacy for the Republican presidential nomination – more Republican voters said free trade agreements had been a good thing for the U.S. (51%) than said they had been a bad thing (39%). Current Republican views on free trade agreements are more negative than they have been at any point going back to 2009, the first time Pew Research Center asked this question.

By 58% to 34%, more Democratic and Democratic-leaning registered voters say free trade agreements have been a good thing than say they have been a bad thing for the U.S. These views are little changed in recent years but are somewhat more positive than in 2009, when 48% of Democrats called free trade agreements a good thing for the U.S., compared with 37% who called them a bad thing.

Differences in views of free trade extend to assessments of how these agreements have impacted voters’ personal finances.

Among all registered voters, 45% say free trade agreements have definitely or probably hurt their family’s financial situation, while 40% say they have definitely or probably helped them.

By a wide 68%-24% margin, far more Trump supporters say their family’s finances have been hurt than helped by free trade agreements. Clinton supporters have more positive views: 51% think free trade has definitely or probably helped their family’s financial situation, compared with 32% who think free trade agreements have definitely or probably hurt their family.

Across age groups, young voters are much more likely than older voters to say their finances have been helped by free trade agreements. Among those 18-29, 66% think their finances have been helped by free trade; fewer than half of all older age cohorts say the same.

Those with a postgraduate degree are more likely to say free trade agreements have helped than hurt their family’s finances by a 56%-26% margin. Views are more mixed among those with a college degree (43% helped, 40% hurt) and those with some college experience (42% helped, 45% hurt). Among those with no more than a high school diploma, far more say free trade agreements have definitely or probably hurt their family’s finances (57%) than say they have definitely or probably helped (30%).

Clinton and Trump supporters at odds over $15 minimum wage

A proposal to raise the minimum wage to $15 an hour has emerged as an issue in the 2016 presidential campaign. A wide majority of Clinton supporters (82%) favor raising the federal minimum wage from $7.25 to $15 an hour; nearly as many Trump supporters (76%) are opposed to this increase.

By a 54%-44% margin, more whites oppose than favor raising the minimum wage to $15 an hour. Among blacks (89%) and Hispanics (71%), large majorities favor increasing the federal minimum wage to $15 an hour.

Voters with family incomes of under $30,000 a year (67%) are much more likely than those earning $30,000-$74,999 (46%) or $75,000 or more a year (48%) to support raising the federal minimum wage to $15 an hour.

Views on government regulation of business and aid to the needy

Overall, 51% of voters say government regulation of business usually does more harm than good, compared with somewhat fewer (44%) who say regulation is necessary to protect the public interest.

Nearly eight-in-ten (79%) Trump supporters say government regulation usually does more harm than good, while just 17% say it is a necessary safeguard. Views among Clinton supporters are the reverse: 70% say government regulation of business is necessary to protect the public interest, compared with 27% who say it usually has a negative effect.

Postgraduates are the most likely to say government regulation of business is necessary to protect the public interest (59%). There is less support for government regulation of business among those with less education, particularly among those with no college experience (34% see regulation as necessary to protect the public’s interest).

Clinton and Trump supporters also disagree over government aid to needy Americans. By about three-to-one (72%-25%), Clinton supporters say the government should do more to help needy Americans, even if it means going deeper into debt. By roughly the same margin (71%-21%), Trump supporters take the opposite view and say that the government today can’t afford to do much more to help the needy.

Most voters with family incomes of under $30,000 a year (63%) say the government should do more to help the needy, even if it means going deeper into debt. About half or more of those with family incomes of $30,000 a year or more, say the government can’t afford to do much more to help the needy.

6. Views of Barack Obama and the political parties

Among the overall public, 53% now express approval of the way Barack Obama is handling his job as president. About four-in-ten (42%) disapprove. This is little changed from June, before the party conventions, when 50% approved and 44% disapproved, but his rating over the last several months remains significantly higher than in recent years.

As has been the case throughout his administration, perceptions of how Obama is handling his job are divided along party lines. Nearly nine-in-ten Democrats (88%) approve of Obama’s performance, while only one-in-ten disapprove. The inverse is true for Republicans: 13% approve and 85% disapprove of the way Obama is handling his job.

For the first time in more than three years, Obama’s job rating is now in positive territory among independents. Today, 53% of independents approve of Obama’s job performance, while 40% disapprove. In June, independents were divided in their assessment of his performance (46% approved, 46% disapproved).

The last time independents rated Obama’s job performance in positive territory was in December 2012, shortly after his reelection (when 53% approved and 39% disapproved).

Views of the parties

By a 56% to 38% margin, the Republican Party is viewed more unfavorably than favorably among the public. By contrast, about as many view the Democratic Party favorably (49%) as have an unfavorable opinion (46%).

Republican assessments of the GOP have ticked up in recent months. About eight-in-ten (82%) Republicans today have a favorable opinion of their party, up from 69% in June. Independent and Democratic views of the GOP are little changed in recent months.

Democrats continue to hold highly positive views of their party: 91% have a favorable opinion of the party. And independents’ ratings of the Democratic Party remain more positive than those of the Republican Party (44% vs. 30%).

Methodology

The analysis in this report is based on telephone interviews conducted August 9-16, 2016 among a national sample of 2,010 adults, 18 years of age or older, living in all 50 U.S. states and the District of Columbia (507 respondents were interviewed on a landline telephone, and 1,503 were interviewed on a cell phone, including 865 who had no landline telephone). The survey was conducted by interviewers at Princeton Data Source under the direction of Princeton Survey Research Associates International. A combination of landline and cell phone random digit dial samples were used; both samples were provided by Survey Sampling International. Interviews were conducted in English and Spanish. Respondents in the landline sample were selected by randomly asking for the youngest adult male or female who is now at home. Interviews in the cell sample were conducted with the person who answered the phone, if that person was an adult 18 years of age or older. For detailed information about our survey methodology, see https://alpha.pewresearch.org/pewresearch-org/methodology/u-s-survey-research/

The combined landline and cell phone sample are weighted using an iterative technique that matches gender, age, education, race, Hispanic origin and nativity and region to parameters from the 2014 Census Bureau’s American Community Survey and population density to parameters from the Decennial Census. The sample also is weighted to match current patterns of telephone status (landline only, cell phone only, or both landline and cell phone), based on extrapolations from the 2015 National Health Interview Survey. The weighting procedure also accounts for the fact that respondents with both landline and cell phones have a greater probability of being included in the combined sample and adjusts for household size among respondents with a landline phone. The margins of error reported and statistical tests of significance are adjusted to account for the survey’s design effect, a measure of how much efficiency is lost from the weighting procedures.

The following table shows the unweighted sample sizes and the error attributable to sampling that would be expected at the 95% level of confidence for different groups in the survey:

Sample sizes and sampling errors for other subgroups are available upon request.

In addition to sampling error, one should bear in mind that question wording and practical difficulties in conducting surveys can introduce error or bias into the findings of opinion polls.

Pew Research Center undertakes all polling activity, including calls to mobile telephone numbers, in compliance with the Telephone Consumer Protection Act and other applicable laws.

Pew Research Center is a nonprofit, tax-exempt 501(c)(3) organization and a subsidiary of The Pew Charitable Trusts, its primary funder.