
Pew Research Center

FOR RELEASE JULY 25, 2016

In Clinton’s March to Nomination, Many Democrats Changed Their Minds

90% of ‘consistent’ Sanders supporters favor Clinton over Trump

FOR MEDIA OR OTHER INQUIRIES:

Communications Department
202.419.4372
www.pewresearch.org

RECOMMENDED CITATION

Pew Research Center, July 2016, "In Clinton’s March to Nomination, Many Democrats Changed Their Minds"

About Pew Research Center

Pew Research Center is a nonpartisan, nonadvocacy fact tank that informs the public about the issues, attitudes and trends shaping the world. It does not take policy positions. The Center conducts public opinion polling, demographic research, computational social science research and other data-driven research. It studies politics and policy; news habits and media; the internet and technology; religion; race and ethnicity; international affairs; social, demographic and economic trends; science; research methodology and data science; and immigration and migration. Pew Research Center is a subsidiary of The Pew Charitable Trusts, its primary funder.

© Pew Research Center 2026

Table of contents

  • About Pew Research Center
  • In Clinton’s March to Nomination, Many Democrats Changed Their Minds
  • Methodology

In Clinton’s March to Nomination, Many Democrats Changed Their Minds

90% of ‘consistent’ Sanders supporters favor Clinton over Trump

Survey report

Hillary Clinton led Bernie Sanders for the Democratic nomination in every Pew Research Center survey conducted throughout the party’s primaries. But many Democratic voters vacillated in their candidate support throughout this period.
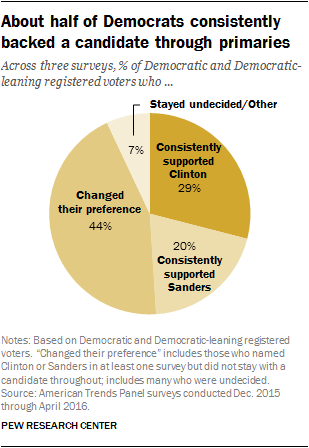
Today, however, overwhelming shares of all Democratic and Democratic-leaning registered voters – including 90% who consistently supported Sanders for the nomination – back Clinton in the general election against Donald Trump.

Even as Clinton led throughout, the share of voters who remained consistently loyal to her over the course of the election was far smaller than her overall support in any single survey. By April 2016, near the end of the Democratic primaries, Clinton was named the first choice of 46% of Democratic voters in an open-ended question about their nomination preferences. But only 29% had consistently named her their first choice in December 2015, March 2016 and April 2016. And even fewer, just 15%, had consistently named her their first choice going all the way back to March 2015.

This fluidity wasn’t confined to Clinton supporters: Sanders was the top choice of 37% of Democratic voters in April 2016, but only about half of these supporters (20% of all Democratic voters) consistently backed Sanders across the three primary-season surveys. Fully 44% of Democratic voters changed their preferences at least once in the surveys conducted over this four-month period, including those who may have been undecided at some point.
Explore change and stability in the race for the Democratic presidential nomination over the course of 2015 and early 2016.

This report and accompanying interactive is based on a longitudinal analysis of the primary and general election preferences of Democratic and Democratic-leaning registered voters in Pew Research Center’s nationally representative American Trends Panel. This approach provides the ability to examine voters’ choices at an individual level over the course of six surveys conducted throughout 2015 and 2016. For more detail, see Methodology used in this report. And for a similar look at the GOP nomination contest, see “For GOP Voters, a Winding Path to a Trump Nomination.”

Patterns of primary support differ, but agreement on the general election

Despite a sometimes contentious primary process, support for Clinton in the general election is high among even the 20% of Democratic voters who consistently backed Sanders through the primary and caucus season: Among this group, just 8% prefer Trump in the general election, while 90% favor Clinton. (The survey was mostly completed before Sanders announced that he would support Clinton on June 24.)

Those who switched their support at least once from December to April also overwhelmingly back Clinton in a matchup against Trump (88% vs. 9%).

And those who consistently backed Clinton through the primaries are nearly unanimous in their support for her in the general: 98% say they will vote for her this fall.
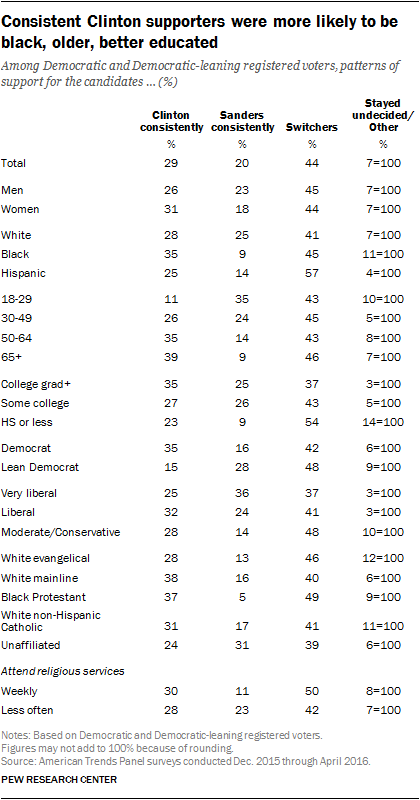
Throughout the Democratic primary race, support divided along many demographic lines. Some of Clinton’s most consistent support in the primaries came from black Democrats, 35% of whom loyally backed her through the primaries and just 9% of whom consistently backed Sanders. By comparison, white Democrats were about equally likely to consistently back Sanders (25%) as Clinton (28%).

Women were more likely to be consistent supporters of Clinton than Sanders (31% vs. 18%), while men were more divided (26% consistently backed Clinton, 23% Sanders).

The age divide seen throughout the primaries is reflected here in differences in loyal support for Clinton and Sanders: While 39% of Democratic voters 65 and older consistently backed Clinton, just 11% of those under 30 did so. Conversely, 35% of those under 30 were consistent Sanders supporters compared with smaller shares of those in other age groups.

More Democratic college graduates (35%) than those with no more than a high school education (23%) consistently supported Clinton. And Democrats who affiliate with the party (rather than lean) were also more likely to be consistent Clinton backers in the primaries. Democratic leaners, those self-identified as “very liberal” and the religiously unaffiliated, were more likely to be consistent Sanders backers.

Early supporters of Warren backed Sanders over Clinton

In March 2015, 10% of Democratic voters volunteered Elizabeth Warren as their top choice for the Democratic nomination, making her the second most popular choice (after Clinton, who was named by 41%). While she did not endorse either Sanders or Clinton in the Democratic race, early Warren supporters did have a preference between the two: More backed Sanders than Clinton in surveys over the course of the next year.
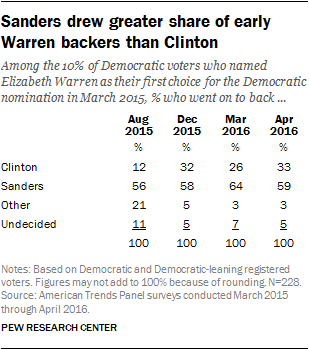
In the August 2015 survey, soon after Warren announced that she was not entering the presidential race, 56% of her prior supporters named Sanders their first choice; only 12% supported Clinton for the nomination while about two-in-ten (21%) preferred someone other than Clinton or Sanders and 11% were undecided.

Roughly six-in-ten of these prior Warren supporters backed Sanders in each individual survey through April 2016, including 38% who backed him in each of these subsequent four surveys. Though Sanders maintained a lead among this group, Clinton’s share of Warren supporters increased to about a third (32%) by December 2015 and remained at about that level in later surveys.

Today, an overwhelming majority of early Warren supporters (90%) say they prefer Clinton in the general election against Trump.

Methodology

The American Trends Panel (ATP), created by the Pew Research Center, is a nationally representative panel of randomly selected U.S. adults living in households. Respondents who self-identify as internet users and who provided an email address participate in the panel via monthly self-administered Web surveys, and those who do not use the internet or decline to provide an email address participate via the mail. The panel is being managed by Abt SRBI.

Members of the American Trends Panel were recruited from two large, national landline and cellphone random-digit-dial (RDD) surveys conducted in English and Spanish. At the end of each survey, respondents were invited to join the panel. The first group of panelists was recruited from the 2014 Political Polarization and Typology Survey, conducted January 23rd to March 16th, 2014. Of the 10,013 adults interviewed, 9,809 were invited to take part in the panel and a total of 5,338 agreed to participate.1 The second group of panelists was recruited from the 2015 Survey on Government, conducted August 27th to October 4th, 2015. Of the 6,004 adults interviewed, all were invited to join the panel, and 2,976 agreed to participate.2

Participating panelists provided either a mailing address or an email address to which a welcome packet, a monetary incentive and future survey invitations could be sent. Panelists also receive a small monetary incentive after participating in each wave of the survey.

The analyses in this report depend upon six separate surveys (fielded in March, August and December 2015 and March, April and June 2016). The data for 5,544 panelists who completed any of these six waves were weighted to be nationally representative of U.S. adults. In this report, results for December 2015 and later are based on all 2,353 Democratic and Democratic-leaning registered voters who responded to any of these six waves. Results for March and August 2015 are based on the 1,518 Democratic and Democratic-leaning registered voters who were members of the ATP at the time.

The ATP data were weighted in a multi-step process that begins with a base weight incorporating the respondents’ original survey selection probability and the fact that in 2014 some panelists were subsampled for invitation to the panel. Next, an adjustment was made for the fact that the propensity to join the panel and remain an active panelist varied across different groups in the sample. The third step in the weighting uses an iterative technique that matches gender, age, education, race, Hispanic origin and region to parameters from the U.S. Census Bureau’s 2014 American Community Survey. Population density is weighted to match the 2010 U.S. Decennial Census. Telephone service is weighted to estimates of telephone coverage for 2016 that were projected from the January-June 2015 National Health Interview Survey. Volunteerism is weighted to match the 2013 Current Population Survey Volunteer Supplement. It also adjusts for party affiliation using an average of the three most recent Pew Research Center general public telephone surveys. Internet access is adjusted using a measure from the 2015 Survey on Government. Frequency of internet use is weighted to an estimate of daily internet use projected to 2016 from the 2013 Current Population Survey Computer and Internet Use Supplement. As a final step, the data for the 3,472 the March/August panelists were poststratified so that the distribution of voter preferences for December 2016 matches the distribution for full set of 5,544 respondents.

Panelists who did not respond to all of the surveys used in this report are missing data for their vote preference for waves in which they did not participate. These missing values were imputed using the process described below.

Sampling errors and statistical tests of significance take into account the effects of both weighting and imputation. Interviews are conducted in both English and Spanish, but the Hispanic sample in the American Trends Panel is predominantly native born and English speaking.

The following table shows the error attributable to sampling, weighting and imputation that would be expected at the 95% level of confidence for different groups in the analysis. The margins of error shown reflect the largest margin of error for any of the shifts in support to or from each candidate at each point in time:


In addition to sampling error, one should bear in mind that question wording and practical difficulties in conducting surveys can introduce error or bias into the findings of opinion polls.

Pew Research Center is a nonprofit, tax-exempt 501(c)(3) organization and a subsidiary of The Pew Charitable Trusts, its primary funder.

About the missing data imputation

The American Trends Panel is composed of individuals who were recruited from two large, representative telephone surveys originally fielded in early 2014 and late 2015. Participants in the panel are sent surveys to complete about monthly. While wave-level response rates are relatively high, not every individual in the panel participates in every survey. The analyses in this report are based on six surveys (fielded in March, August, and December 2015 and March, April, and June 2016).

Of the more than 5,500 respondents who participated in at least one of the waves in which we collected primary vote preference, several hundred respondents (between 12 and 15 percent) did not participate in any given wave. A statistical procedure called hot deck imputation was used to guard against the analysis being undermined by this wave level nonresponse. In particular, there is some evidence that those who are most likely to participate consistently in the panel are more interested and knowledgeable about politics than those who only periodically respond. Omitting the individuals who did not participate in every wave of the survey might overstate the amount of stability in individuals’ preferences.

The particular missing data imputation algorithm we used is known as “hot deck” imputation. This algorithm identifies individuals who are very similar to those with missing data and sampling from the similar observed cases to fill in responses for the missing cases. For each case where the vote preference is missing, the algorithm searches for other cases that are similar along several dimensions (demographic: sex, age, race/ethnicity; socioeconomic: education; political attitudinal: partisan identity, ideological consistency, interest in politics, political knowledge; and geographic: census region, urban/suburban/rural; primary preference in other waves). After identifying a small set of similar individuals the algorithm selects one at random to serve as a “donor,” and fills in the missing preference with the value from the donor case. The imputation procedure was restricted to individuals who belonged to the panel during the same time period (e.g. March and August 2015 primary vote preferences were not retroactively imputed for panelists who joined in late 2015).