
Voters’ Perceptions of the Candidates: Traits, Ideology and Impact on Issues
Few voters ‘check the box’ on positive descriptions of candidates
Survey report
A new national survey finds that when voters are asked to “check the box” on words and phrases describing Hillary Clinton and Donald Trump, relatively small percentages express positive views of either presidential candidate.
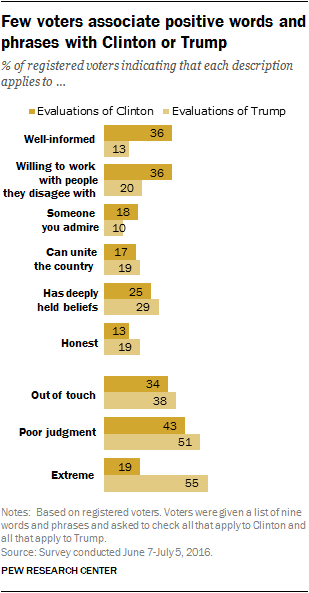
Just 18% of registered voters check the description “someone you admire” for Clinton and even fewer (10%) indicate that this description applies to Trump. Few voters also associate the word “honest” with either Trump (19%) or Clinton (13%). This also is the case for the phrase “can unite the country” – 19% indicate that this describes Trump, while 17% check it for Clinton.
Clinton is viewed more positively – and less negatively – than Trump in several dimensions. About a third (36%) checks “well-informed” for Clinton, compared with 13% who do so for Trump. And while 36% associate the phrase “willing to work with people they disagree with” to Clinton, just 20% indicate that it applies to Trump.
The largest gap between perceptions of Clinton and Trump is over whether the word “extreme” applies to each. More than half of voters (55%) indicate that this description applies to Trump, while just 19% associate it with Clinton.
The new survey was conducted June 7-July 5 among 4,602 adults, including 3,834 registered voters, on the Pew Research Center’s nationally representative American Trends Panel. This survey differs from many online and telephone surveys that ask voters to compare the candidates’ traits and characteristics – who is more honest or better informed – or if various traits do or do not apply to each candidate. In this case, respondents were given the list of nine descriptions and were asked to separately check all that describe Clinton and Trump.
As we have noted previously, results from self-administered surveys often differ from interviewer-administered surveys. This particular format – asking voters to “check all that apply” – could result in smaller percentages of respondents identifying candidates with positive or negative traits than do other surveys that ask explicitly if the traits do or do not describe each candidate.
A recent national survey by Pew Research Center included head-to-head comparisons of the candidates’ traits: 56% of registered voters said Clinton was better described by the phrase “personally qualified to be president,” while just 30% said this better described Trump. Clinton also held an advantage on having good judgment in a crisis (53%-36%). In evaluations of which candidate was better described as “honest and truthful,” 40% said Trump, 37% Clinton, while a sizable minority (20%) volunteered neither.
Supporters’ views of the candidates
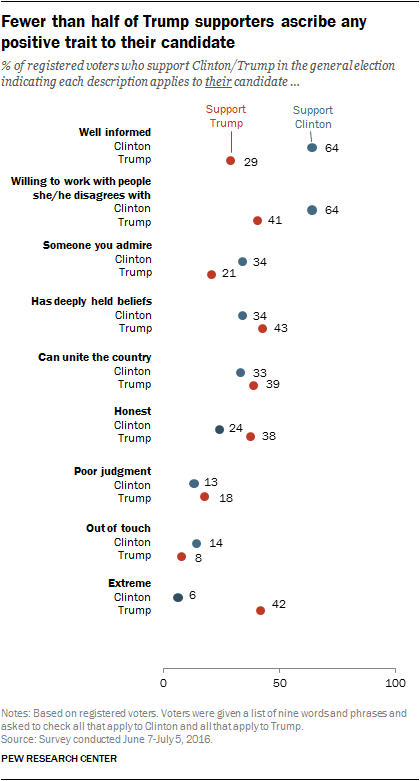
Both Clinton and Trump are viewed more positively by voters who support them in the general election than those who do not. Even among their supporters, however, views of the candidates are not all that positive.
Most Clinton supporters associate her with the phrases “well-informed” and “willing to work with people she disagrees with” (64% each).
But far fewer Clinton supporters ascribe other positive traits to their candidate. Only about a third of voters who favor Clinton in a general election contest against Trump indicate that Clinton “has deeply held beliefs” (34%), is “someone you admire” (34%) and “can unite the country” (33%). Just 24% of Clinton supporters check the term “honest” as a description of their candidate.
Yet Trump’s supporters are even less positive about their candidate than Clinton’s backers are about theirs. There is no positive trait that a majority of Trump supporters ascribe to their candidate.
While 64% of Clinton supporters associate Clinton with the description “well-informed,” fewer than half as many Trump supporters (29%) think this phrase fits Trump.
Trump supporters are far more likely than Clinton supporters to associate the term “extreme” with their candidate. About four-in-ten Trump supporters (42%) check off “extreme” as a description of Trump, compared with just 6% of Clinton supporters who associate that term with their candidate.
Lingering effects from primaries
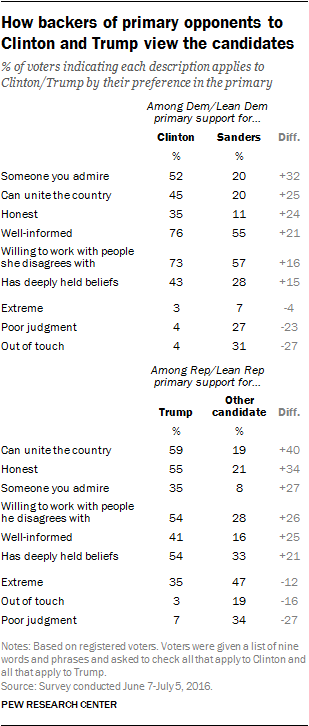
Both Clinton and Trump are viewed less positively among voters who supported other candidates in the primaries than among their own primary supporters.
Among Democratic-leaning registered voters who say they backed Bernie Sanders in the party primaries, just one-in-five indicate that Clinton is someone they admire or associate Clinton with the phrase “can unite the country” (20% each) and 11% associate her with the word “honest.”
Far higher shares of Democratic voters who say they backed Clinton in the primaries say all three traits apply to her, though only about a third of Clinton primary backers check off “honest” as a description for her.
Among Republicans and Republican-leaning voters, majorities of those who backed Trump in the primaries indicate that the terms “can unite the country” (59%) and “honest” (55%) apply to Trump. Only about two-in-ten Republicans who say they supported other candidates for the GOP nomination associate these terms with Trump (20% honest, 19% can unite the country).
Trump and Clinton supporters’ views of the opposing candidate
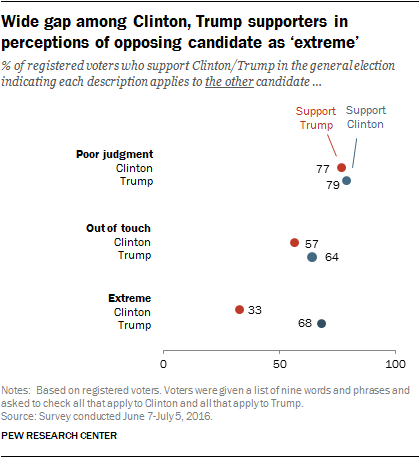
Both Clinton and Trump supporters see the opposing candidate negatively. Nearly eight-in-ten Clinton supporters (79%) offer that Trump has poor judgment, while a comparable share of Trump supporters associate this trait with Clinton (77%).
Almost two-thirds (64%) of Clinton voters describe the presumptive GOP nominee as “out of touch.” Nearly six-in-ten Trump supporters (57%) check off this description of Clinton.
However, while a sizable majority of Clinton supporters (68%) check the word “extreme” as a description of Trump, just a third of Trump supporters indicate that this description applies to Clinton.
Very few Trump voters or Clinton voters assign positive attributes to the other candidate. Most of these assessments number in the single digits, including the 1% of Clinton supporters who offer that Trump is well-informed and 8% of Trump supporters who report this of Clinton.
Perceptions of the candidates’ ideologies
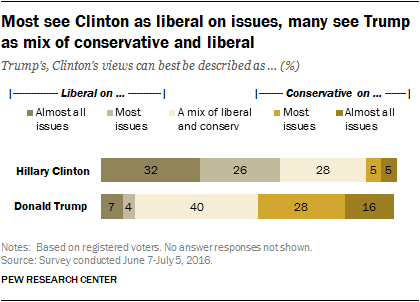
Most voters (58%) say Clinton has liberal views on almost all or most issues. Just 28% say Clinton has a mix of liberal and conservative positions and 10% think Clinton has conservative issue positions.
Perceptions of Trump’s ideology are more divided: 44% say he has conservative views on almost all issues or most issues, while 40% say he has a mix of conservative and liberal positions. Just 11% say he takes all or mostly liberal positions.
Trump and Clinton supporters differ substantially in their views of Clinton’s ideology, while the gaps are much more modest in perceptions of Trump’s ideology.
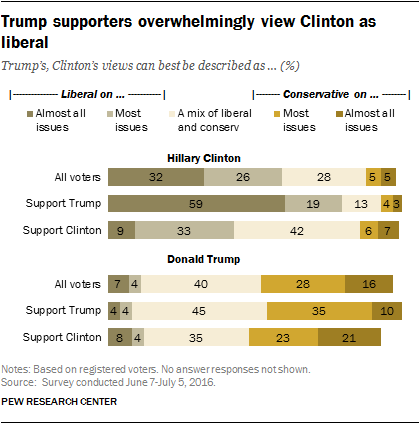
About eight-in-ten Trump voters (78%) describe Clinton as having at least mostly liberal views, with 59% saying that she has liberal views on almost all issues. Among Clinton supporters, 33% say she takes liberal positions on at least most issues and just 9% say she takes liberal positions on almost all issues.
In assessing Trump’s ideology, identical shares of Trump and Clinton supporters (45% each) say he has conservative views on most or almost all issues. But more Clinton than Trump supporters say Trump is conservative on almost all issues (21% vs. 10%).
Democratic and Democratic-leaning voters who say they backed Bernie Sanders for the party’s nomination view Clinton’s ideology fairly similarly as do those who backed Clinton in the primaries.
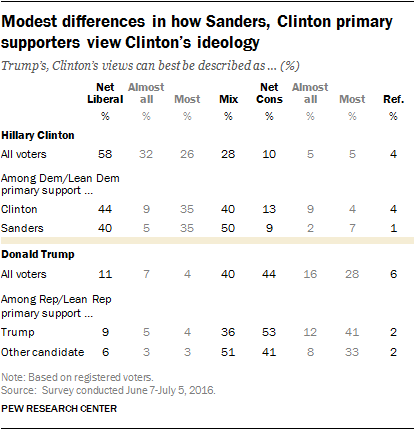
Among Clinton primary supporters, 44% say she has at least mostly liberal views while nearly as many say has a mix of conservative and liberal positions (40%). Among Sanders primary supporters, more say Clinton has mixed views (50%) than liberal views (40%).
Among Republican and Republican-leaning voters, those who say they backed Trump in the primaries are more likely than those who supported other candidates to say he has conservative views on almost all or most issues (53% vs. 41%).
Views of the candidates’ impact on issues
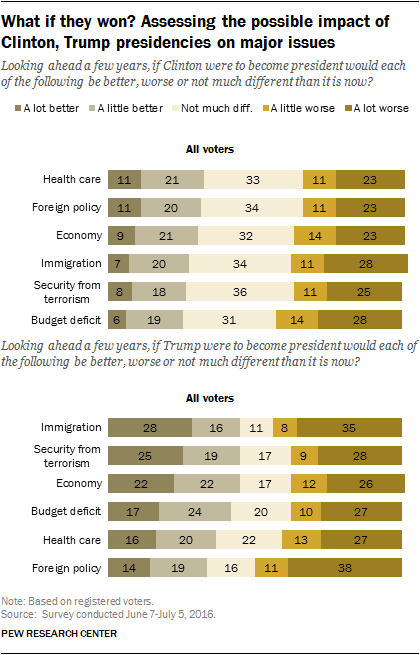
Voters are broadly skeptical that, if elected, Clinton or Trump would achieve progress on major issues facing the country. Asked to look ahead a few years, fewer than half say things would get even a little better on six different issues – ranging from the economy to foreign policy – under either a Clinton or Trump administration.
In general, higher percentages say all six issues will get at least a little better in coming years under Trump than Clinton. However, on five of the six issues, comparable percentages feel that things would get worse under Trump as under Clinton.
And far more voters say foreign policy would get worse under a Trump presidency (49%) than under a Clinton administration (34%).
Across the six issues, more voters expect say things would not change much under Clinton than under Trump. Roughly a third of voters say that on issues ranging from security from terrorism (36%) to the budget deficit (31%), things will not be much different in the years ahead than they are today. In assessing a possible Trump presidency, smaller percentages – no more than about one-in-five –expect little change on any issue.
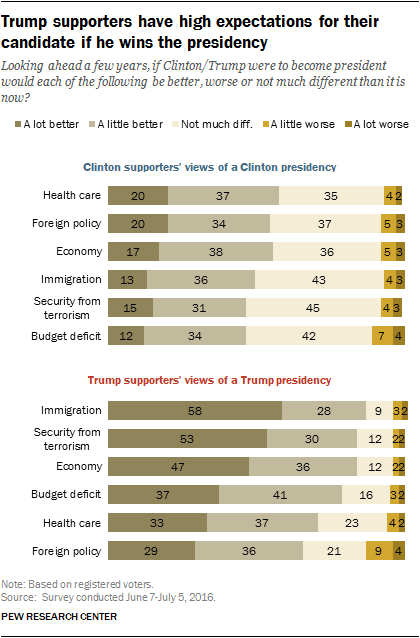
Even many Clinton supporters do not anticipate much change if Clinton were to become president. On immigration and security from terrorism, for example, about as many Clinton supporters expect things to get better if she becomes president (49% immigration, 46% terrorism) as say things would be little different (43% immigration, 45% terrorism).
On the other hand, Trump supporters are more likely than Clinton supporters to expect improvement on every issue if Trump becomes president.
Fully 86% of Trump supporters expect immigration to get better under a Trump presidency, including 58% who say it would get a lot better. Nearly as many Trump supporters (83%) expect security from terrorism to improve, with 53% saying it would get a lot better.
