Pew Research Center

FOR RELEASE JUNE 22, 2016

Partisanship and Political Animosity in 2016

Highly negative views of the opposing party – and its members

FOR MEDIA OR OTHER INQUIRIES:

Communications Department
202.419.4372
www.pewresearch.org

RECOMMENDED CITATION

Pew Research Center, June 2016, "Partisanship and Political Animosity in 2016"

About Pew Research Center

Pew Research Center is a nonpartisan, nonadvocacy fact tank that informs the public about the issues, attitudes and trends shaping the world. It does not take policy positions. The Center conducts public opinion polling, demographic research, computational social science research and other data-driven research. It studies politics and policy; news habits and media; the internet and technology; religion; race and ethnicity; international affairs; social, demographic and economic trends; science; research methodology and data science; and immigration and migration. Pew Research Center is a subsidiary of The Pew Charitable Trusts, its primary funder.

© Pew Research Center 2026

Table of contents

  • About Pew Research Center
  • Partisanship and Political Animosity in 2016
  • 1. Feelings about partisans and the parties
  • 2. The roots of partisanship
  • 3. Partisan environments, views of political conversations and disagreements
  • 4. Partisan stereotypes, views of Republicans and Democrats as neighbors
  • 5. Views of parties’ positions on issues, ideologies
  • 6. How do the political parties make you feel?
  • 7. Partisan views of 2016 candidates, Barack and Michelle Obama, views of the election
  • Methodology
  • Appendix A: Measures and scales

Partisanship and Political Animosity in 2016

Highly negative views of the opposing party – and its members

The 2016 campaign is unfolding against a backdrop of intense partisan division and animosity. Partisans’ views of the opposing party are now more negative than at any point in nearly a quarter of a century.

For the first time in surveys dating to 1992, majorities in both parties express not just unfavorable but very unfavorable views of the other party. And today, sizable shares of both Democrats and Republicans say the other party stirs feelings of not just frustration, but fear and anger.

More than half of Democrats (55%) say the Republican Party makes them “afraid,” while 49% of Republicans say the same about the Democratic Party. Among those highly engaged in politics – those who say they vote regularly and either volunteer for or donate to campaigns – fully 70% of Democrats and 62% of Republicans say they are afraid of the other party.

Frustration, fear and anger among partisans

Across a number of realms, negative feelings about the opposing party are as powerful – and in many cases more powerful – as are positive feelings about one’s own party. While partisans generally agree with their party’s policy positions at least most of the time, just 16% of Republicans and 20% of Democrats say they “almost always” agree with their party’s policy stances. By contrast, more than twice as many Republicans and Democrats (44% each) say they “almost never” agree with the other party’s positions.

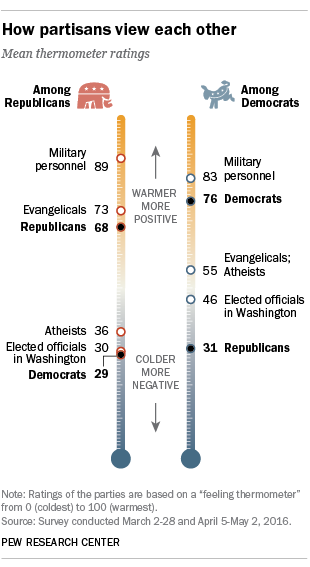
These sentiments are not just limited to views of the parties and their policy proposals; they have a personal element as well. Asked to rate several groups on a 0-100 “thermometer” – where 0 is the coldest, most negative rating and 100 represents the warmest, most positive rating – Republicans and Democrats give very low ratings to the people in the opposing party. Democrats give Republicans a mean rating of 31 – far lower than the average ratings for five other groups on the thermometer, including military personnel and elected officials. Republicans give Democrats a mean rating of 29; only elected officials (30) and atheists (36) are nearly as low.

'Cold' views of other party's members, frigid views of its presidential candidate

Yet Democrats’ thermometer ratings of Donald Trump and Republicans’ ratings of Hillary Clinton are lower – much lower. The average rating for Trump among Democrats is 11 on the 0-100 scale. Fully 82% of Democrats give Trump a “very cold” rating (less than 25), including about two-thirds (68%) who give him a zero, the lowest possible rating. (For an analysis of Trump’s thermometer ratings among Republicans, see “More ‘warmth’ for Trump among GOP voters concerned by immigrants, diversity.”)

Clinton gets an average rating of 12 among Republicans. Among the 76% of Republicans who give Clinton a very cold rating, 59% rate her at zero.

These are among the principal findings of Pew Research Center’s study of partisanship and political animosity, conducted among 4,385 adults from March 2-28 and April 5-May 2 on the Center’s nationally representative American Trends Panel. This report was made possible by The Pew Charitable Trusts, which received support for the survey from The William and Flora Hewlett Foundation. The surveys were conducted before Trump and Clinton became their parties’ presumptive presidential nominees.

Viewing people in the other party as ‘closed-minded,’ ‘lazy’

For Democrats, no single critique resonates more than the notion that Republicans are closed-minded. Fully 70% of Democrats say that Republicans are more closed-minded than other Americans. And nearly as many Democrats (67%) say the people in their party are more open-minded than other Americans.

What Republicans and Democrats say about each other

Fewer Democrats (42%) say Republicans are more dishonest than other Americans, 35% say they are more immoral and 33% say they are more unintelligent.

Many Republicans, by contrast, think Democrats fall short on several traits. While more than half of Republicans (52%) view Democrats as more closed-minded than other Americans, nearly as many say Democrats are more immoral (47%), lazier (46%) and more dishonest (45%).

Not only do almost half of Republicans say Democrats are lazier than other Americans, most (59%) also say the members of their own party are more hard-working. And about half of Republicans (51%) view Republicans as more moral than other Americans.

Despite these widespread partisan stereotypes, most Democrats and Republicans stop short of saying that it would be more difficult to get along with a new community member who belonged to the other party. About three-in-ten Democrats (31%) and 27% of Republicans say it would be harder to get along with a new person in their community if they belonged to the other party.
Most find little common ground with those they disagree with politically

On the other hand, somewhat greater shares of Democrats (42%) and Republicans (43%) say it would be easier to get along with a new neighbor who belongs to their own party.

While the current partisan environment does not for the most part appear to be turning neighbor against neighbor, it may be making for some difficult conversations about politics.

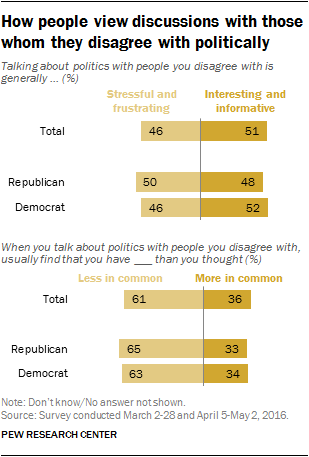
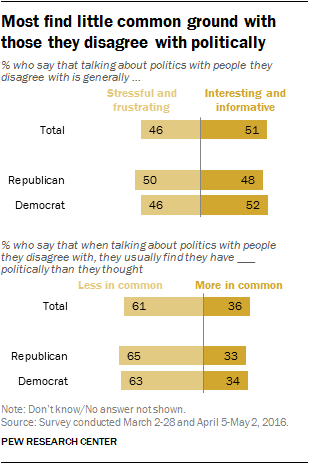
Both Republicans and Democrats are about as likely to say that talking about politics with people whom they disagree with is “stressful and frustrating” as say such conversations are “interesting and informative.”

And majorities in both parties (65% of Republicans, 63% of Democrats) say that when they talk to people on the other side, they usually end up finding they have less in common politically than they thought.

Growing numbers see opposing party as a ‘threat’
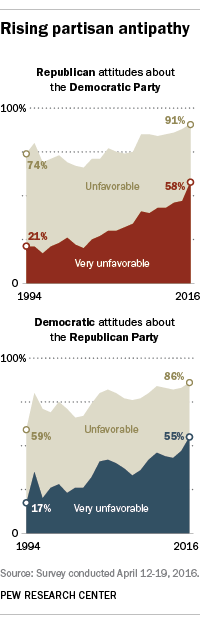
Rising partisan antipathy

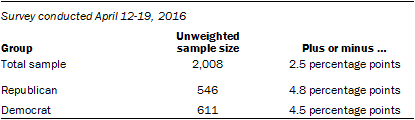
Our study of polarization in 2014 found that a major element of partisan polarization “has been the growing contempt that many Republicans and Democrats have for the opposing party.” Since then, levels of mutual contempt have grown, and “many” has become “most,” according to a separate survey of 2,008 adults, conducted on landlines and cellphones from April 12-19, 2016.

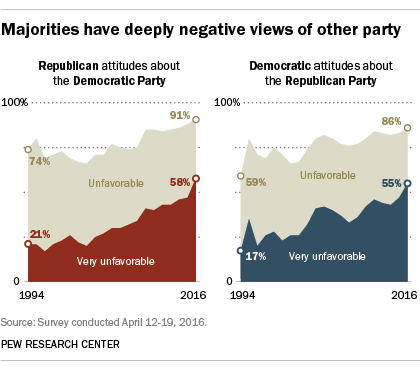
Today, 58% of Republicans have a very unfavorable impression of the Democratic Party, up from 46% in 2014 and just 32% during the 2008 election year. Among Democrats, highly negative views of the GOP have followed a similar trajectory – from 37% in 2008 to 43% in 2014 and 55% currently.

To gauge the depth of partisan dislike, the 2014 survey asked those who expressed very unfavorable opinions of the opposing party if they would go so far as to say “the party’s policies are so misguided that they threaten the nation’s well-being.”

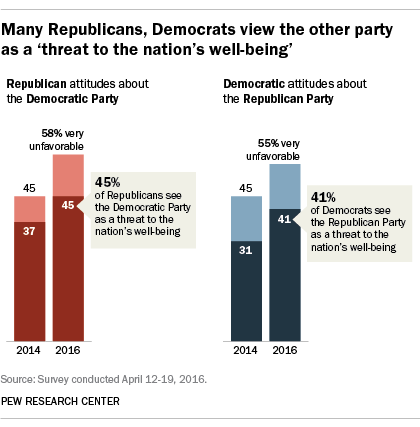
Over the past two years, as the numbers of Republicans and Democrats with very unfavorable views of the opposing party have grown, so too have the shares saying the other party threatens the nation’s well-being: 45% of Republicans now view Democratic policies as a threat, up from 37% in 2014. And 41% of Democrats say the same about the Republican Party’s policies, an increase of 10 percentage points from two years ago.

Negative roots of partisanship – and partisan leaning

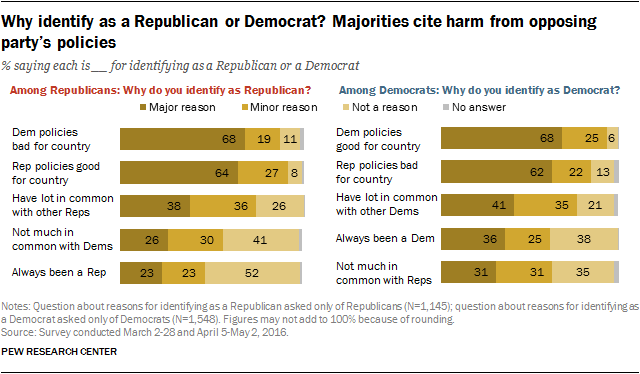
The power of negative feeling toward the opposition is reflected in the reasons people give for identifying with their own party. Majorities in both parties point to the positive impact of their own party’s policies as a major reason for their choice of parties – but nearly as many cite the harm caused by the opposing party’s policies.

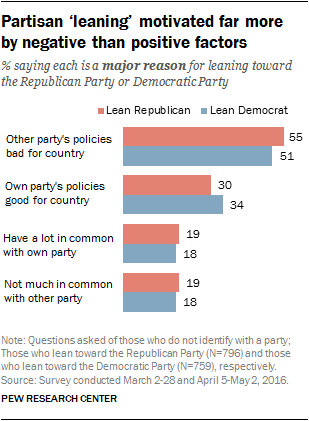
And independents, who now outnumber both Republicans and Democrats and overwhelmingly “lean” to one party or the other, are far more likely to cite negative than positive factors for why they form their loose partisan ties.

Among Republicans, 68% say a major reason they identify with the GOP is that “the Democratic Party’s policies are harmful to the country,” while 64% say it is because they think “the Republican Party’s policies are good for the country.”

More Democrats cite the positive effects of their party’s policies than the negative consequences of GOP policies, but the margin is modest: 68% say a major reason they are a Democrat is that the Democratic Party’s policies are beneficial for the country, while 62% say a major reason is because Republican policies harm the country.
Why identify as a Republican or Democrat? Majorities cite harm from opposing party’s policies

Other reasons for identifying with a party, such as having a lot in common with its members or having long-standing ties with a party, are cited far less frequently as major factors for choosing to identify with a party.
Overview_7i

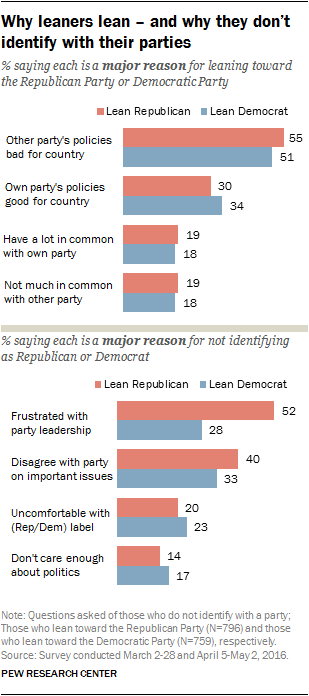
For independents, by contrast, negative motives are cited most frequently among the reasons for leaning toward a party. Among Republican-leaning independents, 55% say a major reason for leaning toward the GOP is that Democratic policies are harmful to the country. Just 30% cite the positive effects of Republican policies.

For Democratic leaners, far more also point to the negative consequences of the other party’s policies (51%) rather than the positive effects of their own party’s policies (34%) as a reason to associate, however loosely, with their own party.

Other key findings

Having a friend from the other party matters, especially for Republicans. In both parties, those who have few or no friends in the other party are more likely to have “very cold” feelings about the people in that party. This is especially the case for Republicans: Those with few or no Democratic friends are twice as likely to rate Democrats very coldly than are Republicans with at least some Democratic friends (62% vs. 30%).

Most Republicans and Democrats want compromise on their terms. Majorities of Democrats (62%) and Republicans (58%) say their party should get more of what it wants on the key issues facing the nation. Partisans with colder feelings toward the other party are even more likely to say their own side should get more of what it wants.
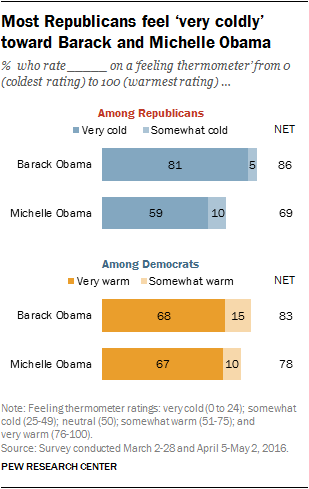
Most Republicans feel ‘very coldly’ toward Barack and Michelle Obama

Four-in-ten Republicans give Michelle Obama a zero. Republicans feel very negatively toward Barack Obama, but a majority also gives “very cold” thermometer ratings to Michelle Obama. Fully 81% of Republicans feel very coldly toward Barack Obama, including 59% who give him a zero on the 0-100 scale. Nearly six-in-ten Republicans (59%) give very cold ratings to Michelle Obama; 40% of Republicans give her a zero.

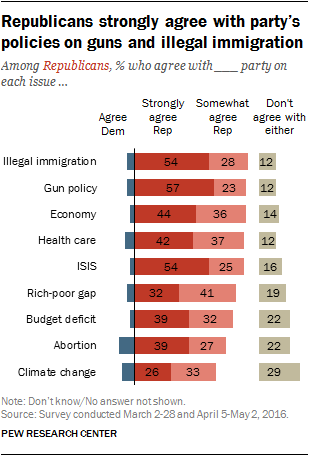
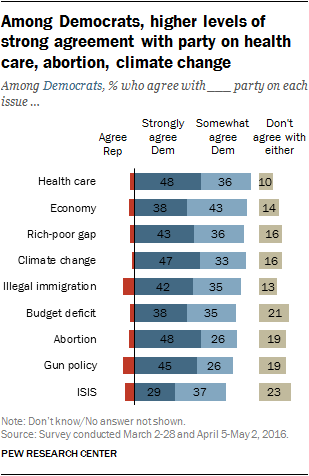
Parties and issues. Majorities of Republicans and Democrats say they agree with their parties’ positions on nine issues tested. However, “strong” agreement varies widely by issue: Republicans are more likely to strongly agree with the GOP’s position on illegal immigration and gun policy, while Democrats are most likely to strongly agree with Democratic positions on health care, abortion and climate change.
1. Feelings about partisans and the parties

Majorities have deeply negative views of other partyPartisans’ dislike of the opposing party is part and parcel of American politics, but recent years have witnessed a growing intensity in these feelings.
For the first time in more than two decades of Pew Research Center surveys, majorities of partisans have not only an unfavorable view of the other party, but a very unfavorable one. Today, 55% of Democrats and 58% of Republicans view the other party in deeply negative terms.

Intensely negative ratings of the opposing party were far less common in the past, even in presidential election years: In 2000 only about a quarter of both Democrats (23%) and Republicans (26%) had a very unfavorable view of the other party; by 2012 that had risen to more than four-in-ten.

In just the two years since Pew Research Center documented this trend in “Political Polarization in the American Public” in 2014, the share rating the other party very unfavorably has increased by 12 percentage points in both parties.

Many Republicans, Democrats view the other party as a 'threat to the nation's well-being'This strong dislike translates into an even greater sense of risk for many on both sides of the aisle. As in 2014, most of those who view the other party very unfavorably say that the opposing party’s policies “are so misguided that they threaten the nation’s well-being.” Still, a larger share now says this: 45% of Republicans now say that Democratic policies threaten the nation, while 41% of Democrats view GOP policies in equally stark terms (up from 31% in 2014).
Views of the opposing party have grown colder over time

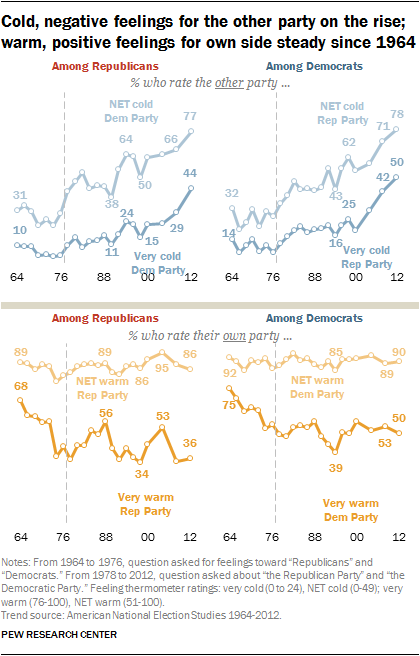
Cold, negative feelings for the other party on the rise; warm, positive feelings for own side steady since 1964As others have documented, data from the American National Election Studies (ANES) also show an increase in negative feelings about the opposing party. For decades the ANES have asked Republicans and Democrats to rate their feelings toward their own party and the other on a 0-to-100 thermometer scale (a slightly different “feeling thermometer” is used throughout the rest of this report). 1

Since 1964, Republicans’ and Democrats’ feelings toward the other party have grown much colder. The share of both parties with cold feelings toward the opposing party has steadily increased over the past five decades, from around 30% in 1964, to about 45% in 1984, to roughly six-in-ten in 2004; at the time of the most recent ANES in 2012, nearly 80% of Democrats and Republicans alike gave the other party a cold rating.

A significant part of the growth in cold feelings has been the growth of very cold (0-24) feelings for the other side. In 1964, just 10% of Republicans and 14% of Democrats said they felt very cold toward the other side. In 2012, 44% of Republicans and 50% of Democrats were very cold. Over this same period, Americans’ overall warmth toward their own party has been largely stable, but intensely warm feelings are lower than they were in the 1960s and early 1970s.

Feelings toward partisans

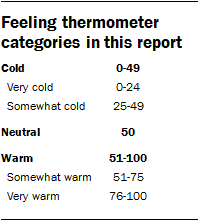
In the current survey, when asked to rate a number of groups on a “feeling thermometer” between 0 and 100 – where 0 is the coldest, most negative rating and 100 represents the warmest, most positive – Democrats give Republicans an average rating of just 31, and Republicans give Democrats a similarly low rating of 29.

How partisans view each otherDemocrats feel colder toward Republicans than they do toward any other group asked about. Even elected officials in Washington receive an average rating 15 degrees warmer (46) than Republicans. Republicans rate Democrats (29) just as poorly as they do elected officials in Washington (30).
Ratings of members of one’s own party are substantially warmer, though a sizable partisan gap in feelings about one’s own party is evident: On average, Democrats rate members of their own party a 76 on the 0-100 scale, while Republicans give an average 68 rating to their co-partisans.

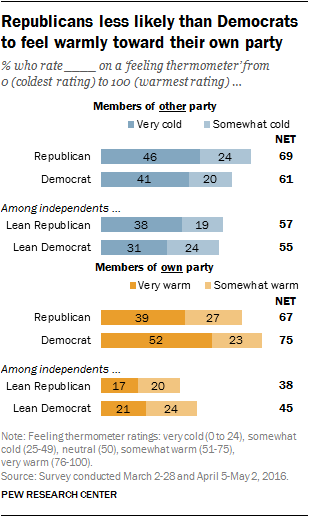
Although the average rating Republicans and Democrats give to one another is roughly the same, Republicans are somewhat more likely than Democrats to choose a rating for the opposing party that is “cold” (0-49 on the 0-100 scale): 69% of Republicans rate their feelings for Democrats as cold, compared with 61% of Democrats who say this about Republicans.

Republicans less likely than Democrats to feel warmly toward their own partyAnd Democrats are somewhat more likely than Republicans to give members of their own party “warm” ratings (51-100 on the 0-100 scale). Three-quarters of Democrats (75%) give a warm rating to Democrats; about two-thirds of Republicans (67%) feel warmly toward Republicans. Much of the difference comes from a 13-percentage-point gap between the shares of Democrats (52%) and Republicans (39%) who give their co-partisans a “very warm” rating (a rating of 76 or higher).
Compared with self-identified partisans, independents who lean to a party largely share the negative views of the other party, but hold decidedly colder views of the party they lean toward. Though roughly seven-in-ten Republicans (69%) are cold toward Democrats, that falls to 57% among Republican leaners. Nearly as many Democratic leaners as Democrats have cold feelings about Republicans (55% vs. 61%). And while 75% of Democrats give members of their own party a warm rating, just 45% of Democratic leaners give Democrats a warm rating. A similar 29-point gap exists between Republicans (67%) and Republican leaners (38%) in their warm ratings of Republicans.

Politically engaged feel more negatively about those on ‘other side’

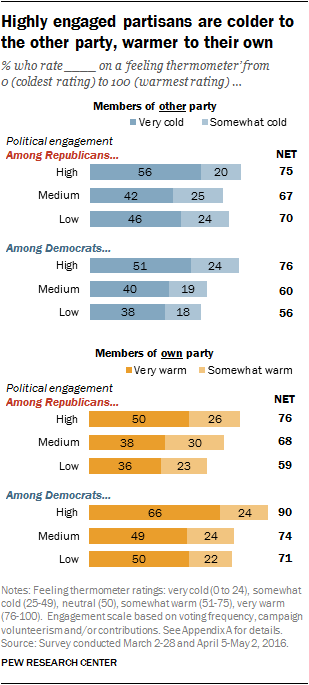
Highly engaged partisans are colder to the other party, warmer to their ownPartisans who are highly engaged in politics – those who nearly always vote and have either donated money to or volunteered for a campaign in the past year – feel more coldly toward members of the other party and more warmly toward members of their own party than people who are less engaged in politics.
Highly engaged Democrats are more likely than less engaged Democrats to express cold feelings about members of the GOP: 76% give Republicans a cold rating, including 51% who give a very cold rating. In comparison, 60% of those who are moderately engaged (regular voters who do not volunteer or give money) give a cold rating, along with 56% of those with lower levels of political engagement.

The relationship between political engagement and coldness toward those affiliated with the opposing party is less striking among Republicans. Highly engaged Republicans are more likely than those who are moderately engaged to express very cold feelings toward Democrats (56% vs. 42%), but are only modestly more likely to express cold views overall (75%, compared with about seven-in-ten among the less engaged).

Engagement is related to warmth toward one’s own side to similar degrees in both parties: 90% of highly engaged Democrats express warm feelings for Democrats, while smaller shares of the moderately engaged (74%) and least engaged (71%) say the same. Two-thirds of highly engaged Democrats (66%) go so far as to give a very warm rating, compared with about half of less engaged Democrats. Among Republicans, there is a similar 17-point gap in warm ratings between the most and least engaged (76% vs. 59%, respectively).

More ideological in both parties are colder to the opposition

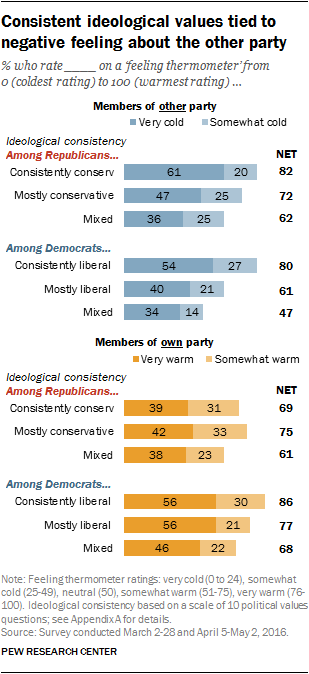
Consistent ideological values tied to negative feeling about the other partyOver the past several decades, not only have views of the opposing party become more deeply negative, but both parties’ members have become more consistently ideological.
The current survey finds that ideologically consistent partisans – Democrats with political values that are consistently liberal and Republicans with values that are consistently conservative – hold some of the most negative views of the other party. 2

Among Republicans, 82% of those with consistently conservative political values say they have cold feelings toward Democrats, compared with 72% of those who have values that are mostly conservative and 62% of Republicans who take about an equal number of conservative and liberal positions.

The pattern is similar – and somewhat more pronounced – among Democrats. Eight-in-ten Democrats who take down-the-line liberal positions feel coldly toward Republicans, on par with the share of consistently conservative Republicans who feel coldly toward Democrats. Far fewer Democrats with mostly liberal positions (61%) feel coldly toward Republicans, and just 47% of Democrats with ideologically mixed views rate members of the GOP coldly.

Among Democrats, those with consistently liberal views are warmer to their party than other Democrats: 86% express warm views of Democrats, compared with 77% of those with mostly liberal views and 68% among those who are ideologically mixed in their views.

But among Republicans, the link between ideology and warmth toward their own party is somewhat weaker. While Republicans with mostly conservative views are more likely to feel warmly toward Republicans than those with mixed views (75% vs. 61%), all Republicans are about as likely to feel very warmly towards their co-partisans: 39% of those with consistently conservative views, 42% with mostly conservative views and 38% with ideologically mixed views feel very warmly toward other Republicans.

Ideology can be measured using one’s political values or based on what people consider themselves to be. Though these measures are correlated, they can differ (for example, not all of those who have consistently liberal political values call themselves liberal). But, as with ideology based on political values, self-identification is also associated with antipathy toward the opposing party. Republicans who self-identify as more conservative are colder toward Democrats and warmer toward Republicans than those who think of themselves as less conservative. A similar pattern is seen among Democrats, with those who are more liberal expressing colder views of the GOP’s membership than those who identify as less liberal.

Antipathy and presidential approval

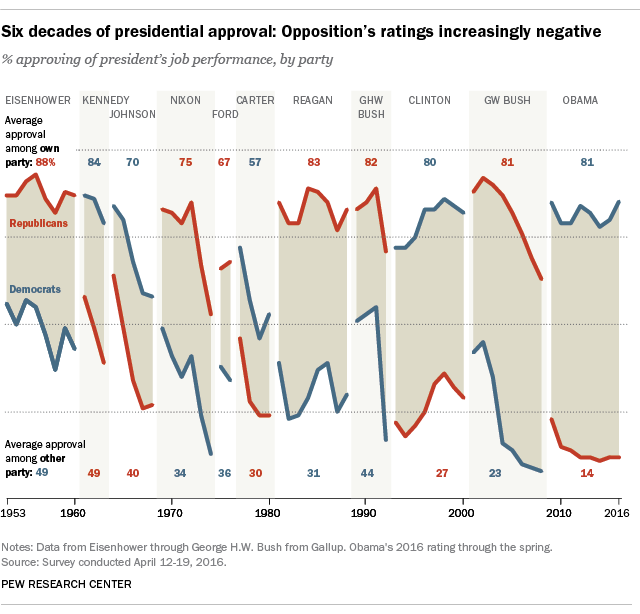
As Republicans and Democrats have grown more negative in their views of the other party, so too have their evaluations of presidents representing the other party become more critical. Partisan divisions over presidential performance are wider now than at any point since the 1950s, and this growing gap is largely the result of increasing disapproval from the opposition party.

With seven of the eight years of his term completed, Barack Obama’s average approval since taking office stands at just 14% among Republicans, while his average approval among Democrats is 81%. During George W. Bush’s time in office, his average overall approval rating among Democrats was just 23%; on average 81% of Republicans approved of Bush’s performance. (These are averages for the full Bush administration. During his final year in office, an average of just 8% of Democrats approved of his performance, along with 63% of Republicans).

Six decades of presidential approval: Opposition's ratings increasingly negativeBush’s and Obama’s polarized job approval ratings stand in contrast to public ratings of previous modern presidents. For example, on average 31% of Democrats approved of Ronald Reagan’s job performance throughout his presidency, while he garnered similar ratings to Obama’s among those in his own party (83% average approval). Just over a quarter of Republicans (27% on average) approved of Bill Clinton’s job performance during his time in office. And going back to Dwight Eisenhower’s administration, nearly half of Democrats (49%), along with 88% of Republicans, said they approved of the job the GOP president was doing in office.
2. The roots of partisanship

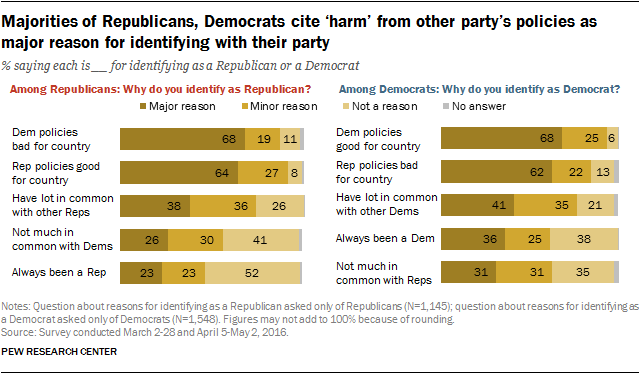
Why do people choose to identify as a Republican or a Democrat? For Republicans, about as many (68%) cite as a major reason the harm that Democratic policies inflict on the country as cite the beneficial impact of GOP policies (64%).

The balance of views among Democrats is only slightly more positive: 68% say a major reason they belong to their party is that Democratic policies are good for the country. However, concern over Republican policies also looms large: 62% say a major reason for their party choice is that “the Republican Party’s policies are harmful to the country.”

For members of both parties, other factors rank far behind the parties’ policies among reasons for choosing a party. Roughly four-in-ten Democrats (41%) and Republicans (38%) say a major reason for identifying with their party is that they “have a lot in common” with the people who belong to the parties. Fewer people – 31% of Democrats and 26% of Republicans – say the lack of common ground with members of the opposing party is a main reason why they are a Democrat or Republican.

Majorities of Republicans, Democrats cite ‘harm’ from other party’s policies as major reason for identifying with their party

Just 31% of Democrats cite long-standing ties with the party – “ever since I can remember I’ve been a Democrat” – as a major reason for identifying with the party. Even fewer Republicans (23%) cite this as a major reason they belong to the GOP.

2_2i

For independents who lean to the Republican and Democratic parties, the main motivation for leaning to their party is the harm that the opposing party’s policies cause the country.

More than half of Republican leaners (55%) and 51% of Democratic leaners say harm from the opposing party’s policies are a major reason for leaning to their party. No other factor comes close – just 30% of Republican leaners and 34% of Democratic leaners cite the positive effects from their preferred party’s policies as a major reason.

When asked why they lean but do not identify with their party, about half of Republican leaners (52%) cite frustration with GOP leaders as a major reason; another 40% say they disagree with the party on some important issues.

These factors are cited less frequently by Democratic leaners: Just 28% say frustration with the Democratic Party’s leaders is a major reason they do not identify as Democrats, and 33% cite disagreements on key issues as a major reason.

Wearing the party label, somewhat uneasily

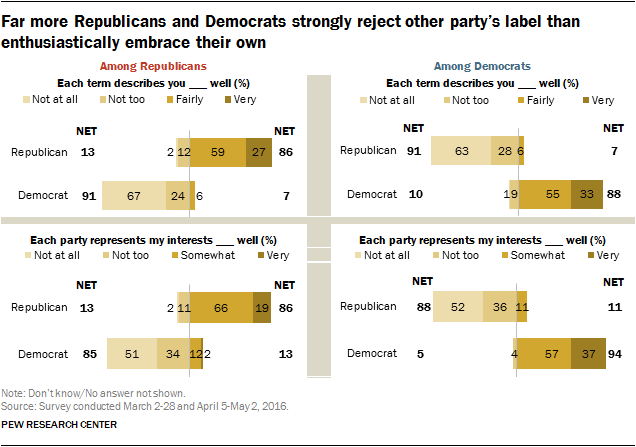
Far more Republicans and Democrats strongly reject the other party’s label than enthusiastically embrace their own. A wide majority of Republicans (86%) say that the term “Republican” describes them at least fairly well, but only 27% say the term describes them very well. However, more than twice as many Republicans (67%) say the term “Democrat” describes them not at all well.

A similar pattern is seen among Democrats. Fully 88% of Democrats say the term “Democrat” describes them at least fairly well, but just a third (33%) say the party label describes them very well. As with Republicans, far more Democrats (63%) say the opposing party’s label describes them not at well than say their own party’s name describes them very well.

Large shares of Democrats and Republicans credit their own parties with representing their interests at least fairly well. However, while 37% of Democrats say the Democratic Party represents their interests very well, only about half as many Republicans (19%) say the same about their party. Overwhelming shares in both parties say the opposing party does not represent their interests well, with about half in each saying the other party does not do at all well in this regard (52% of Republicans, 51% of Democrats).

Far more Republicans and Democrats strongly reject other party’s label than enthusiastically embrace their own
Republican leaners more likely to say neither party represents them well

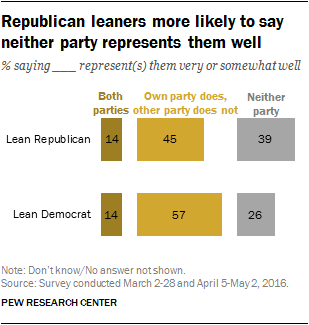
In another sign of their dissatisfaction with the Republican Party, fewer than half of Republican leaners (45%) say the GOP does well in representing their interests, while the Democratic Party does not do a good job. But nearly as many Republican leaners (39%) say neither party does well in representing their interests. Democratic leaners are more likely to say their party does well in representing their interests: 57% say this, compared with just 26% who say neither party does a good job.


Party shifting rare, more common among Republicans than Democrats

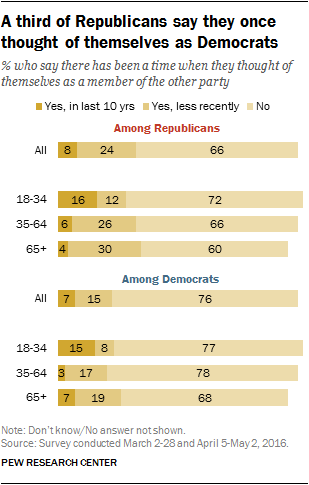
Most partisans say they have always thought of themselves as belonging to their current party, but about a third of Republicans (32%) say that at one point they thought of themselves as Democrats, while 22% of Democrats say they previously considered themselves Republicans.

A third of Republicans say they once thought of themselves as Democrats

However, relatively small numbers in each party – 8% of Republicans and 7% of Democrats – say they have thought of themselves as members of the other party in the past decade.

Young people are more likely than older adults to have thought of themselves as members of the opposite party in the past 10 years. Among Republicans, 16% of those under 35 say they thought of themselves as Democrats in the past decade, compared with 6% of those 35 and older. The pattern is similar among Democrats: 15% of those younger than 35 vs. 4% of older Democrats were Republicans in the past decade.

Most independents who lean to a party once saw themselves as members of it

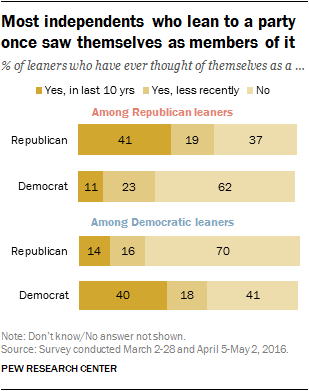
Among independents who lean to the Republican and Democratic parties, most at one time thought of themselves as members of the party to which they currently lean.

About six-in-ten Republican leaners (61%) say they once considered themselves Republicans, including 41% who thought of themselves as Republicans in the past decade. Similarly, 58% of Democratic-leaning independents say they once thought of themselves as Democrats (40% in the past decade).

About a third of Republican-leaning independents (35%) say in the past they thought of themselves as Democrats, while a comparable share of Democratic leaners say they once viewed themselves as Republicans.

3. Partisan environments, views of political conversations and disagreements

For the most part, people have politically mixed friend groups, although both Republicans and Democrats are more likely to say they have a lot of friends from their own party than from the opposing party.

The partisan diversity of people’s friend networks is linked to how people feel about the members of the other party, particularly among Republicans. Those who have at least some close friends in the other party tend to feel less coldly toward people in that party than those with few friends of the opposing party. And among Republicans, those who have close Democratic friends hold fewer negative stereotypes of Democrats than those who do not.

During this campaign year, most people discuss politics and government at least a few times a week. Yet for many, talking politics with those who disagree with them can be an unsatisfying experience. About half describe such conversations as “interesting and informative,” but nearly as many call them “stressful and frustrating.” And most say when they discuss politics with people they disagree with, they find they have less in common politically than they had thought.
Partisan environments: friends, spouses and family ties

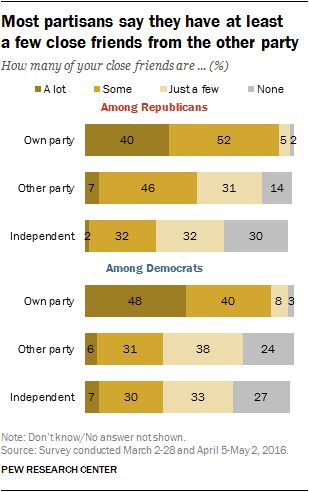
Most partisans say they have at least a few close friends from the other party

Overall, friendships with people who share a party are more common than friendships across party lines. Yet most Americans have at least some political diversity among their close friends: Large majorities of both Democrats and Republicans say they have at least a few close friends from the other party.

Though few in either party say that they have “a lot” of friends in the other party (just 7% of Republicans and 6% of Democrats), Republicans are more likely than Democrats to say they have at least a few close friends in the opposing party. More than eight-in-ten Republicans (84%) say they have at least a few Democratic friends; just 14% report that they have no close Democratic friends. Three-quarters of Democrats (74%) say they have at least a few close Republican friends, while roughly a quarter (24%) say they have no close Republican friends.

At the same time, four-in-ten Republicans (40%) and 48% of Democrats say that they have “a lot” of close friends of their own party, and nearly all partisans have at least a few close friends who share their party.

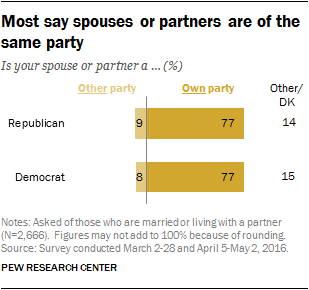
While many Republicans and Democrats have politically diverse networks of friends, the vast majority of those who are married or living with a partner say their spouse or partner belongs to the same political party. Fully 77% of Republicans who are married or living with a partner – and an identical percentage of married Democrats – say their spouse belongs to the same party.

Most say spouses or partners are of the same party

Mixed political relationships are rare: Just 9% of Republicans say their spouse or partner is a Democrat, while roughly the same share of Democrats (8%) say their spouse is a Republican.

In a study of political polarization in 2014, relatively few Republicans (22%) or Democrats (19%) said they would be unhappy if an immediate family member married someone from the other party. On the other hand, just 5% in each party said they would be happy about a mixed political marriage. Most (71% of Republicans, 76% of Democrats) said it would not matter.
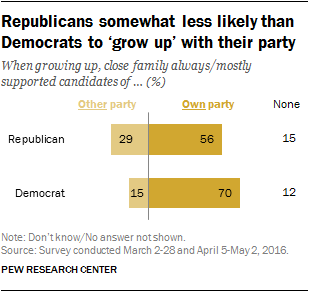
Republicans somewhat less likely than Democrats to ‘grow up’ with their party

Most Americans have adopted the party that they grew up with, though Democrats (70%) are more likely than Republicans (56%) to have grown up in a family that always or mostly supported candidates of their current party.

This difference between the family environments of Republicans and Democrats is largely the result of many older Republicans reporting having grown up in families that supported Democrats: Among Republicans ages 65 and older, roughly as many say their families almost always or mostly supported Democratic candidates (42%) as say they always or mostly supported Republicans (37%). By comparison, 68% of Republicans younger than 50 say they grew up in Republican households, identical to the share of Democrats younger than 50 who say they grew up in Democratic households (68%). Similarly, roughly seven-in-ten older Democrats say their families backed Democratic candidates when they were growing up.

Personal connections linked to feelings about the ‘other side’

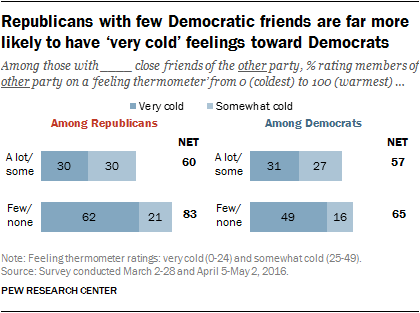
Republicans with few Democratic friends are far more likely to have ‘very cold’ feelings toward Democrats

Having friendships that cross party lines is associated with feelings about the opposing party, especially among Republicans. Fully 83% of Republicans with “just a few” or no close Democratic friends give Democrats cold thermometer ratings (0-49), and 62% give them very cold ratings (0-24). By contrast, Republicans with at least some Democratic friends are less likely to give Democrats cold ratings: 60% rate them at least somewhat cold, with just 30% feeling very coldly toward them.

Differences among Democrats are not as stark, but nearly half (49%) of Democrats with just a few or no close Republican friends rate Republicans very coldly, compared with 31% of those with at least some Republican friends.

Similarly, Republicans with just a few or no Democratic friends are more likely than those who have more Democratic friendships to say Democrats are closed-minded (17 percentage points more likely), unintelligent (+17 points), immoral (+16 points) and dishonest (+14) when compared with other Americans. On these same dimensions, they also are more likely to associate the positive side of these traits with Republicans.

As with thermometer ratings of the opposing party, these differences are less pronounced among Democrats. When it comes to most traits, Democrats who have few close Republican friends are not significantly more likely to negatively stereotype Republicans than Democrats who have close Republican friends.

Many find political discussions with opponents ‘stressful’

How people view discussions with those whom they disagree with politically

In an era of partisan division, Republicans and Democrats have generally similar views about the value of discussions with people whom they disagree with politically.

Half of Republicans say they generally find such discussions to be “stressful and frustrating,” while 48% find them “interesting and informative.” Democrats also are divided – 46% say conversations with those with whom they disagree are stressful, while 52% say they are interesting.

Nearly two-thirds of Republicans (65%) and 63% of Democrats say that, when they talk politics with those with whom they disagree, they find they have less in common politically than they thought. Only about a third of Republicans (33%) and Democrats (34%) say they find they have more in common politically with those they disagree with.

Among Democrats, a majority (56%) of those with at least a college degree say they find political conversations with those they disagree with to be stressful and frustrating; by contrast, most Democrats (58%) with lower levels of education find such discussions to be interesting and informative. There are only modest educational differences among Republicans in these views. However, Republicans who have a lot or some Democratic friends (51%) are more likely than those who do not (35%) to find these types of conversations interesting.

In both parties, majorities across educational and demographic groups say they find they have less common ground politically when they talk politics with people they disagree with.

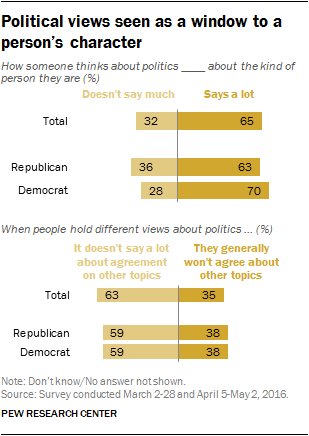
Most think a person’s political views ‘say a lot’ about their character

Political views seen as a window to a person’s character

There is broad agreement, again across partisan lines, that someone’s political beliefs say a lot “about the kind of person they are.” Fully 70% of Democrats say one’s political views speak to their character, as do 63% of Republicans. Just 28% of Democrats and 36% of Republicans say a person’s political views do not say much about the kind of person they are.

At the same time, identical majorities of both Republicans and Democrats (59% each) say that political differences do not preclude people agreeing on other, nonpolitical topics. About four-in-ten Republicans and Democrats (38% each) say that if people hold different views on politics they generally will not agree on other topics.

Those who have friends of the other party are much less likely than those who do not to say that political beliefs convey a lot “about the kind of person” someone is: Among Republicans, 58% of those with Democratic friends believe this, while 82% of those with a few or no Democratic friends contend that how people think about politics is indicative of their character. Among Democrats, there is a 9-percentage-point difference in these views (68% vs. 77%).

4. Partisan stereotypes, views of Republicans and Democrats as neighbors

Many Republicans and Democrats associate negative characteristics with members of the other party – and positive traits with their own. But the specific criticisms Democrats and Republicans have of each other vary. And on several of these traits, a majority of partisans say Republicans and Democrats aren’t much different from the public as a whole.

Of the five characteristics asked about, Democrats are particularly likely to say Republicans are closed-minded: Fully 70% say Republicans are a lot (35%) or somewhat (35%) more closed-minded compared with other Americans; 23% say they are about the same as other Americans on this dimension; and just 5% view Republicans as more open-minded than other Americans.

Democrats are less likely to opt for other negative descriptors of Republicans: About four-in-ten (42%) say GOP members are more dishonest than other Americans, while about half say they are about the same and 5% say they are more honest. Though half or more of Democrats do not think of Republicans as different from other Americans when it comes to morality, intelligence or work ethic, roughly a third say they are more immoral (35%) and more unintelligent (33%); just 18% say Republicans are lazier than other Americans (9% say they are more hardworking).

Though no one negative trait stands out to the same degree among Republicans in their evaluations of Democrats, Republicans are somewhat more likely to lodge criticism in several areas: Roughly half (52%) think of Democrats as more closed-minded than other Americans, and about as many say Democrats are more immoral (47%), more lazy (46%) and more dishonest (45%).

Partisans also have positive associations with members of their own party, and these largely mirror the negative stereotypes of the other party. Almost six-in-ten Republicans (59%) say Republicans are more hard-working than other Americans; just 37% of Democrats say the same about fellow Democrats. And while about half of Republicans (51%) see members of their party as more moral than other Americans, a smaller share of Democrats (38%) say this about their co-partisans.

Nearly as many Democrats say Democrats are more open-minded than Americans as a whole (67%) as say Republicans are more closed-minded (70%). Only about a third of Republicans (32%) think other Republicans are more open-minded. Nearly two-in-ten Republicans (18%) say Republicans are more closed-minded than other Americans, the largest share to ascribe a negative trait to those in their own party.

Republicans and Democrats are equally likely to say those in the other party are unintelligent (32% vs. 33%, respectively) and to view members of their own party as intelligent (43% vs. 40%).

Political engagement and partisanship

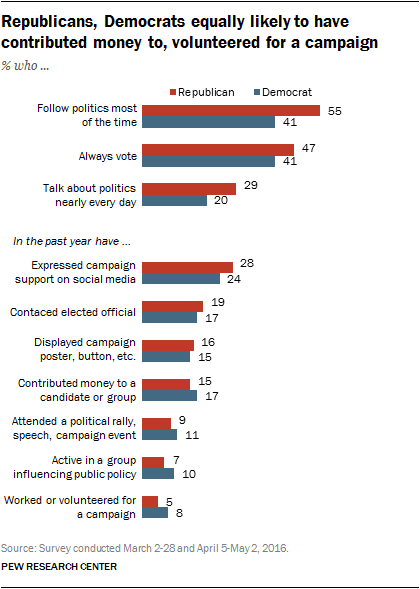
Republicans, Democrats equally likely to have contributed money to, volunteered for a campaign

Participation in politics can take a variety of different forms. More than half of Republicans (55%) and roughly four-in-ten Democrats (41%) report following what is going in government and public affairs most of the time. However, only 5% of Republicans and 8% of Democrats say they have worked or volunteered for a political campaign over the past year.

Contributing money to candidates or groups working to elect candidates is somewhat more common (15% of Republicans and 17% of Democrats have done this in the last year), while roughly a quarter of Republicans (28%) and Democrats (24%) say they have publicly expressed support for a political campaign on Facebook, Twitter or other social media.

Democrats and Republicans participate at roughly equal rates across a range of different activities, and those who are more politically engaged are more likely to associate negative traits with the other side and more likely to associate positive traits with their own.

More participation among those who hold negative partisan stereotypes

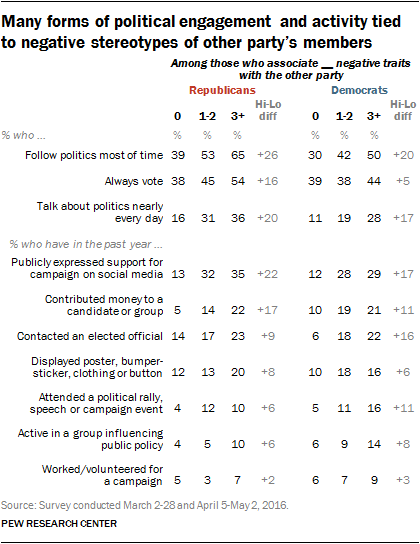
Many forms of political engagement and activity tied to negative stereotypes of other party’s members

About one-in-four partisans hold none of these negative stereotypes of those on the other side (25% of Republicans and 22% of Democrats). Across most measures of political participation, these individuals with no negative partisan stereotypes were less likely to participate in politics.

Conversely, those who associate three or more negative traits with people in the opposing party (as 37% of Democrats and 44% of Republicans do) participate in politics at the highest rates.

For instance, while just 5% of Republicans who do not associate any negative traits with Democrats have contributed money to a candidate or group working to elect a candidate in the past year, that rises to 14% among those who hold one or two negative stereotypes of the opposing party, and to 22% among those who ascribe three or more of the five negative traits to Democrats.

Similar patterns are evident for other types of political activity, such as contacting elected officials and publicly expressing support for candidates, and are seen among both Democrats and Republicans.

Partisanship a factor in views of neighbors

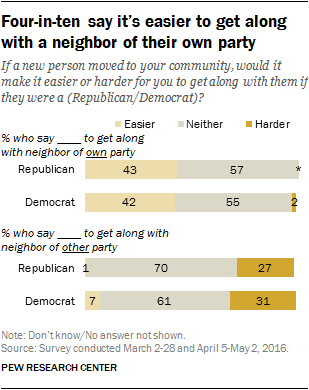
Four-in-ten say it’s easier to get along with a neighbor of their own party

For many Republicans and Democrats alike, the extent to which they might get along with a new neighbor might depend on who that neighbor is – and their partisan affiliation.

Majorities in both parties say the party affiliation of a new neighbor wouldn’t make it any easier or harder to get along with them, But roughly four-in-ten Republicans (43%) and Democrats (42%) say it would be a lot or somewhat easier if the newcomer “were a Republican” or “were a Democrat,” respectively. Comparable majorities of each side (57% of Republicans, 55% of Democrats) think it would be neither easier nor harder to get along with a newcomer who identified with their own party. Very few think it would be harder to get along with a member of their own party who moved to the community.

But just as some find it easier to get along with those who share their partisan affiliation, some say it would be more difficult to get along with a member of the other party: 31% of Democrats say it would be harder to get along with a new person in the community if they were a Republican, while nearly as many Republicans (27%) say it would be tougher to get along with a new Democratic neighbor.

About six-in-ten Democrats (61%) say having a new neighbor who is a member of the GOP would make it neither easier nor harder to get along, and 7% say it would be easier. Seven-in-ten Republicans (70%) would react neutrally toward a new Democratic neighbor, and just 1% say it would be easier to get along with them.

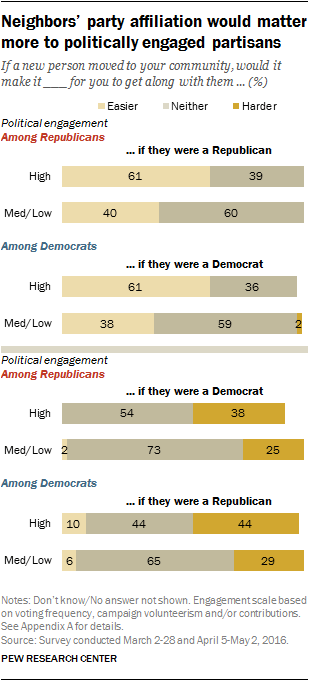
Neighbors’ party affiliation would matter more to politically engaged partisans

Highly engaged partisans (those who vote regularly, and either volunteer or contribute to campaigns) are far more likely than those who are less engaged to say it would be easier to get along with a co-partisan – and harder to get along with someone from the other party.

In thinking about a new person in the community, identical majorities of both Republicans and Democrats who are highly engaged (61%) would find it a lot or somewhat easier to get along if the person were a member of their own party.

Fewer of those who are less politically engaged feel the same way (40% of Republicans and 38% of Democrats), with about six-in-ten saying it would be neither easier nor harder.

Similarly, those with higher levels of political engagement are more likely to express skepticism about being able to get along with new neighbors identifying with the other party: 44% of highly engaged Democrats and nearly as many highly engaged Republicans (38%) say it would be harder to get along with a new person in the community if they were a member of the other party. By comparison, only about a quarter of less engaged Democrats (29%) and Republicans (25%) would find it harder to get along with a neighbor of the opposing party.

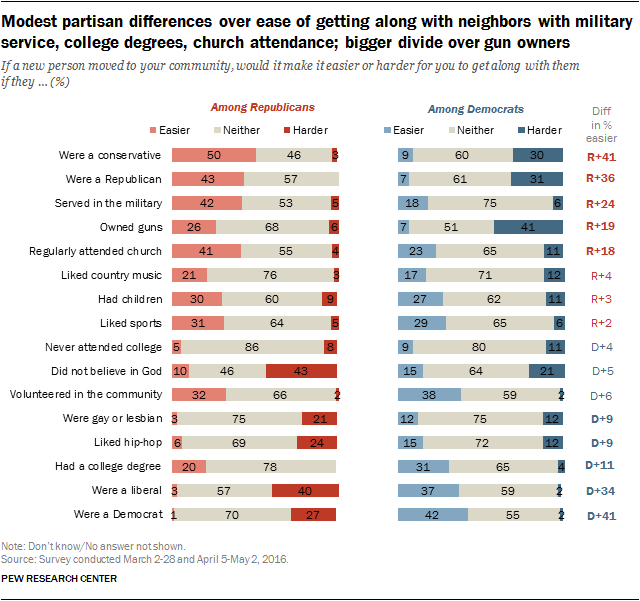
Republicans and Democrats show some distinctive preferences toward other potential characteristics of new neighbors as well, from gun ownership to belief in God – though in nearly all cases, majorities say these traits would not have an effect on their ability to get along with a new neighbor.

Republicans are about twice as likely as Democrats to say it would be easier to get along with a new person in the community if they had served in the military (42% vs. 18%) or regularly attended church (41% vs. 23%). Still, most Democrats say these traits would not have much impact on their ability to get along.

Modest partisan differences over ease of getting along with neighbors with military service, college degrees, church attendance; bigger divide over gun owners

About a quarter of Republicans (26%) say it would be easier to get along with a new neighbor if they owned guns, while just 6% say it would be harder; 68% say it would not make a difference. By contrast, 41% of Democrats think it would be harder to get along with a new neighbor if they owned guns and just 7% say this would make it easier to get along (51% say neither).

Among Republicans, about as many say it would be harder to get along with a new neighbor who did not believe in God (43%) as say it would be neither easier nor harder (46%). Republicans are twice as likely as Democrats to find it hard to get along with someone who did not believe in God (43% vs. 21%), while Democrats are nearly as likely to say it would be easier to get along with a non-believer as to say it would be harder (15% vs. 21%).

About three-in-ten Democrats (31%) and somewhat fewer Republicans (20%) say having a college degree is something that would make it easier to get along with a neighbor, though clear majorities in both parties say this would not impact their ability to get along.

Neighbors who like sports, have children or volunteer in the community are viewed as easier to get along with by more than a quarter of Republicans and Democrats alike. In both parties, relatively few say these characteristics would make it harder to get along with a neighbor, while most say they would not matter much.

5. Views of parties’ positions on issues, ideologies

Republicans and Democrats see little common ground between the two parties when it comes to issues, ideas and ideology. Majorities of partisans say the policy positions of the Republican and Democratic parties are very different, and neither Republicans nor Democrats say the other party has many good ideas.

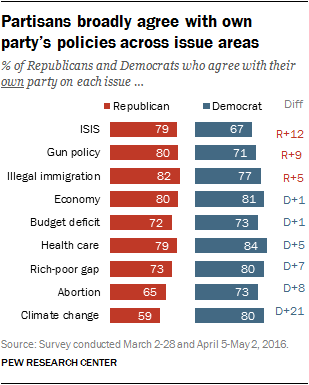
In general terms, both Republicans and Democrats agree with their own party’s policies. In-party agreement extends to specific issues, such as policies to deal with the economy, health care and immigration.

Partisans broadly agree with own party’s policies across issue areas

However, there are some issue areas – climate change for Republicans and policies to deal with ISIS for Democrats – where somewhat smaller majorities of partisans say they agree with their own party’s approach. Even then, few partisans express agreement with the other party on these issues.

Overall, about seven-in-ten Republicans (71%) and Democrats (70%) say they generally agree with their party’s positions almost always or more than half the time. Even larger majorities – 84% of Republicans and 82% of Democrats – disagree with the other party’s positions at least most of the time.

Most Republicans and Democrats also agree with their own party’s policies on a range of specific issues, including the economy, immigration, health care and policies to deal with the Islamic militant group in Iraq and Syria.

However, the shares agreeing with their own party vary by issue, and the patterns of agreement are different within the two parties.

Republicans strongly agree with party’s policies on guns and illegal immigration

Republicans are less likely to say they agree with their own party’s positions on climate change and abortion than they are to say this about other major issues. Overall, 65% strongly or somewhat agree with the Republican Party’s policies on abortion and 59% say they agree with the party’s approach to dealing with climate change. By contrast, larger majorities of Republicans agree with their party’s positions on illegal immigration (82%), the economy (80%) and gun policy (80%).

Among Democrats, the percentage that agrees with their party’s policies to deal with ISIS (67%) is smaller than the share agreeing with the Democratic Party’s stance on issues such as health care (84%), the economy (81%) and climate change (80%).

There is little evidence that the other party’s positions hold appeal for Republicans or Democrats, even on the issues for which agreement with one’s own party is relatively low.

For example, while a modest 59% of Republicans agree with their own party’s positions on climate change, just 9% say they agree with the Democratic Party’s policies on the issue; a much larger share (29%) say they don’t agree with either party on the issue. Similarly, 23% of Democrats say they do not agree with either party’s policies to deal with ISIS compared with just 7% who agree with the GOP’s policies (67% of Democrats agree with their own party on the issue).

Among Republicans, strong agreement with their own party is most concentrated on the issues of gun policy, illegal immigration and policies to deal with ISIS.

Among Democrats, higher levels of strong agreement with party on health care, abortion, climate change

More than half of Republicans strongly agree with the Republican Party’s policies on guns (57%), illegal immigration (54%) and ISIS (54%). Strong agreement is lower on other issues – such as the economy (44%) and health care (42%) – yet overall levels of agreement on these issues are comparable to those on gun policy, immigration and ISIS.

Democrats express the highest levels of intense agreement with their own party on different issues than Republicans.

Overall, 48% of Democrats say they strongly agree with the Democratic Party’s positions on health care and abortion, and 47% say they strongly agree with their party on climate change.

Just 29% of Democrats say they strongly agree with their party’s policies to deal with ISIS, while 37% somewhat agree.

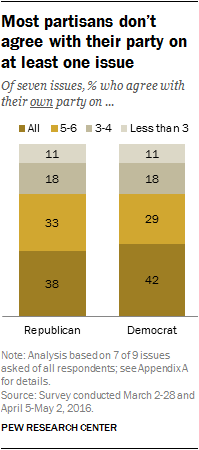
Most partisans don’t agree with their party on at least one issue

While Republicans and Democrats express different levels of agreement with their own party on specific issues, the overall number of issues on which they express agreement with their own party is similar.

About seven-in-ten Republicans (71%) and Democrats (72%) agree with their own party on at least five of the seven issues asked of all survey respondents (excluding the budget deficit and the gap between the rich and poor); about four-in-ten express agreement with their party on all seven issues (38% and 42%, respectively). Relatively few Republicans (18%) or Democrats (18%) agree with their party on three or four of the issues, and just 11% of both parties agree on fewer than three issues.

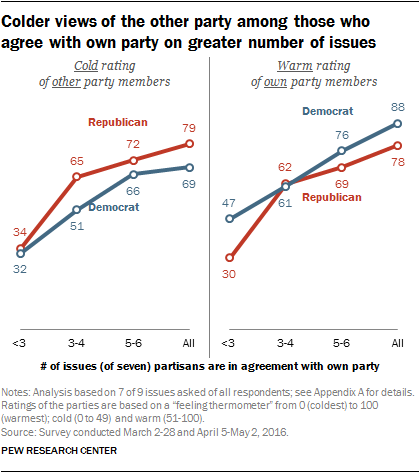
The feelings Republicans and Democrats express about members of the other party are closely tied to their levels of issue agreement with their party. Those who agree with their party on a greater number of issues are more likely than those who agree with their party on fewer issues to give members of their own party warm ratings; they are also more likely to give members of the other party cold ratings on a thermometer scale from 0 to 100.

Colder views of the other party among those who agree with own party on greater number of issues

Nearly seven-in-ten Democrats (69%) and eight-in-ten Republicans (79%) who agree with their own party on all issues say they have a cold view of members of the other party. By contrast, far fewer Democrats (32%) and Republicans (34%) who agree with their party on fewer than three issues express cold feelings toward members of the other party.

Similarly, 78% of Republicans who agree with their party on all seven issues express warm ratings toward other Republicans, compared with just 30% of Republicans who agree with their party on fewer than three issues. The pattern is similar among Democrats: 88% of those who express across-the-board issue agreement with the Democratic Party have warm feelings toward other Democrats. Among Democrats who agree with their own party on only a few issues, just 47% have a warm view of Democrats.

Greater agreement with party’s positions among the politically engaged

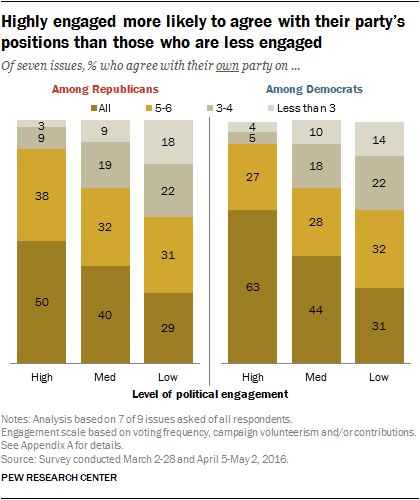
Republicans and Democrats who are highly engaged with politics are more likely to agree with their own party’s positions on issues than those who are less engaged.

Highly engaged more likely to agree with their party’s positions than those who are less engaged

Among Republicans who are highly engaged with politics (regular voters who volunteer or contribute to political causes), 88% say they agree with the Republican Party’s positions on at least five of seven major issues. Republicans who have medium or low levels of political engagement are less likely to express agreement with their own party on these issues (72% and 60%, respectively).

The same relationship between political engagement and in-party issue agreement is seen among Democrats. Nine-in-ten highly engaged Democrats agree with their own party on most of the seven issues, compared with 72% of Democrats with medium levels of political engagement and 63% of Democrats with low levels of political engagement.

More politically engaged Republicans and Democrats also are more likely than the less engaged to see large differences between the policies of the two parties and to say the other party has almost no good ideas.

How different are the policies of the Republican and Democratic parties?

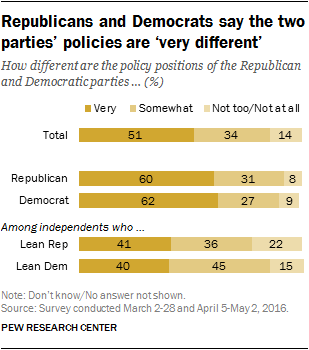
Republicans and Democrats say the two parties’ policies are ‘very different’

The public sees a clear distinction between the policy positions of the Republican and Democratic parties: About half (51%) say the positions of the two parties are very different, while another 34% say they are somewhat different. Just 14% say they are either not too or not at all different.

Partisans are especially likely to see the two parties as holding different views: 60% of Republicans and 62% of Democrats say the parties take very different policy positions.

By contrast, those who say they lean toward a party, but do not identify with it, see more modest differences between the two parties. About four-in-ten Republican leaners (41%) and Democratic leaners (40%) say the policy positions of the Republican and Democratic parties are very different.

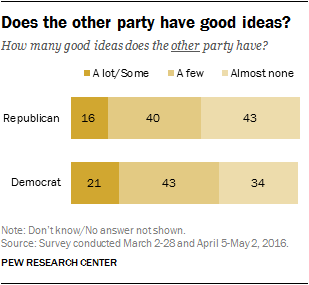
Does the other party have good ideas?

Republicans and Democrats also do not see many good ideas coming out of the other party. Among Democrats, just 21% say the Republican Party has either a lot or some good ideas; 43% say it has a few and 34% say it has almost no good ideas. Views of the Democratic Party’s ideas among Republicans are similarly skeptical: Only 16% say the Democratic Party has a lot or some good ideas, while 40% say it has a few and 43% say it has almost none.


For many, political compromise means their party gets more

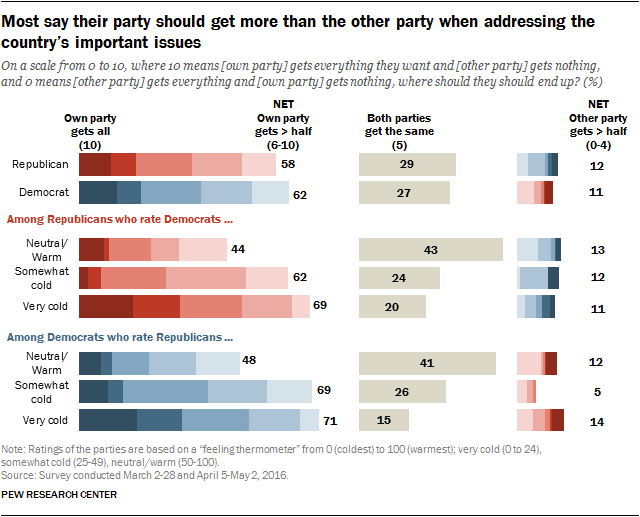
Most partisans say that, when it comes to how Democrats and Republicans should address the most important issues facing the county, their party should get more out of the deal.

On a scale of 0 to 10, where 10 means their party gets everything it wants and 0 means the other party gets everything it wants, about six-in-ten of those in both parties (58% of Republicans, 62% of Democrats) think their side should get more on the key issues facing the nation. Roughly three-in-ten Republicans (29%) and Democrats (27%) say both parties should get about half of what they want (a 5 on the scale).

Most say their party should get more than the other party when addressing the country’s important issues

Partisans with colder feelings toward the other party are more likely to say that their own side should get more. Among Republicans, 44% of those who feel neutral or warm toward Democrats say their own party should get more than half of what it wants on key issues facing the country. That share rises to 62% of Republicans who give Democrats somewhat cold ratings, and 69% of those who rate Democrats very coldly.

The same pattern is evident among Democrats. Among those who give Republicans a very cold rating, 71% say Democrats should get more in partisan dealings; 69% of those who rate Republicans coldly say the same. By comparison, a smaller share (48%) of those who rate Republicans neutrally or warmly say their own party should get most of what it wants.

Contrasting perceptions of parties’ ideologies

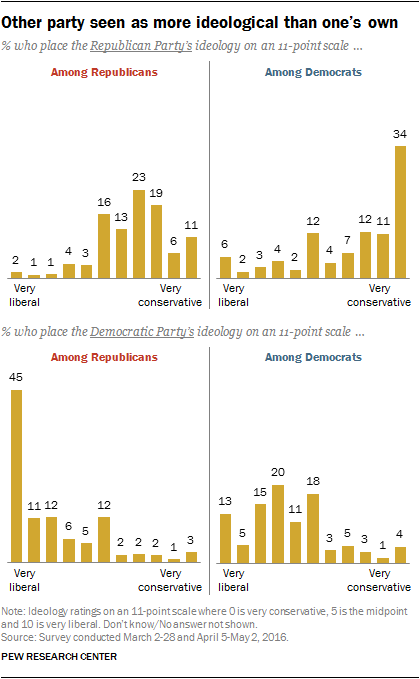
Other party seen as more ideological than one’s own

Republicans and Democrats tend to view the opposing party as highly ideological, while viewing their own party as less ideological.

On an 11-point scale where 10 is very liberal and 0 is very conservative, a 34% plurality of Democrats use the most conservative option to describe the ideology of the Republican Party. Fully 58% of Democrats select one of the three most conservative points to describe the Republican Party’s ideology.1

While most Republicans (71%) describe their party as conservative (0-4 on the scale), just 11% of Republicans select the most conservative option. About a third of Republicans rate their party one of the three most conservative points (36%), while about as many (35%) give their party a conservative rating that is closer to the midpoint (a 3 or 4). Just 16% select the midpoint of the scale (5) and only about one-in-ten (11%) place themselves on the liberal side of the scale.

A similar pattern is seen in views of the Democratic Party’s ideology. Fully 45% of Republicans select the most liberal option to describe the Democratic Party, and nearly seven-in-ten Republicans (68%) use one of the three most liberal points on the scale (8, 9 or 10) to describe the party.

Democrats have a more evenly distributed view of their party’s ideology. Just 13% give it the most liberal score on the scale and only a third (33%) describe the party’s ideology with one of the three most liberal points on the scale. About three-in-ten Democrats (31%) give their party a liberal rating that is closer to the midpoint (a 6 or 7), and 18% place the ideology of their party in the middle of the scale (5); 17% place themselves on the conservative side of the scale.

6. How do the political parties make you feel?

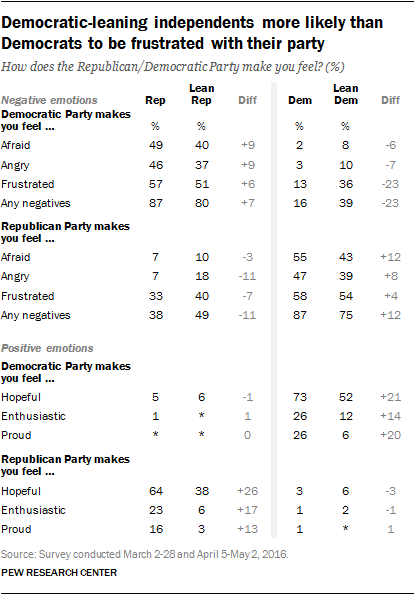
Republicans and Democrats have strong negative reactions to the opposing party. Feelings of frustration are most common – 58% of Democrats and 57% of Republicans feel frustrated by the other party. But large shares also react with fear and anger toward the other party.

A majority of Democrats (55%) say the GOP makes them feel afraid, while 49% of Republicans say the same about the Democratic Party.

And nearly half of Democrats (47%) and Republicans (46%) say the other party makes them feel angry.

Overwhelming majorities in both parties (87% in each) have at least one of these negative feelings about the other party – frustration, fear or anger.

When thinking about their own parties, substantial majorities of both Democrats (73%) and Republicans (64%) say their parties make them feel hopeful. But far fewer say their own parties stir feelings of enthusiasm or pride.

Only about a quarter of Democrats (26%) and a similar share of Republicans (23%) say their party makes them feel enthusiastic. Roughly a quarter of Democrats (26%) also say their party makes them feel proud, while fewer Republicans (16%) say the same about their party.

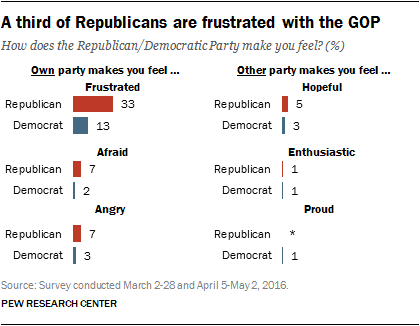
A third of Republicans are frustrated with the GOP

Republicans are more likely to say that their party engenders frustration than say it makes them feel enthusiastic or proud. A third of Republicans (33%) say the GOP makes them feel frustrated. By comparison, just 13% of Democrats express frustration with their party.

Very few partisans feel afraid or angry toward their own party. And only tiny shares in each party say the other party makes them feel hopeful, enthusiastic or proud.

Highly politically engaged are most likely to be afraid of other party

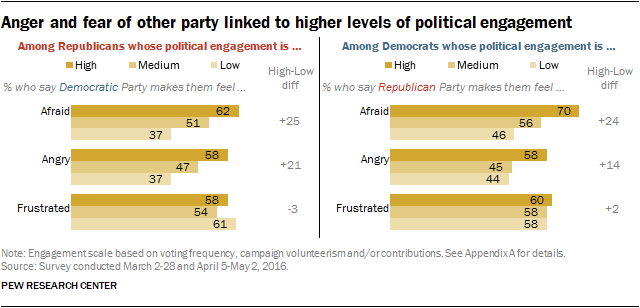
Those who are more politically active are significantly more likely to be express negative emotions about the other party – particularly to say that it makes them feel afraid or angry.

Among highly politically engaged Republicans – those who say they vote regularly and have volunteered for or donated to a political campaign in the past year – 62% say that the Democratic Party makes them feel afraid. Among those moderately engaged (those who vote regularly, but do not participate in or donate to campaigns) 51% are afraid. And among the least engaged Republicans (irregular voters or those not registered to vote), just 37% say they are afraid of the Democratic Party.

The pattern is similar among Democrats. Fully 70% of highly engaged Democrats say they are afraid of the Republican Party, compared with 46% of Democrats who do not vote regularly or are not registered.

Similarly, political engagement is associated with anger at the other party: 58% of both Democrats and Republicans who are highly politically engaged are angered by the other party; fewer than half of those who are less engaged say the same.

On the other hand, frustration with the other party is not associated with political engagement: About six-in-ten of those in both parties, regardless of how actively they participate in politics, say they feel frustrated with the other party.

Anger and fear of other party linked to higher levels of political engagement

Political engagement and feelings about one’s own party

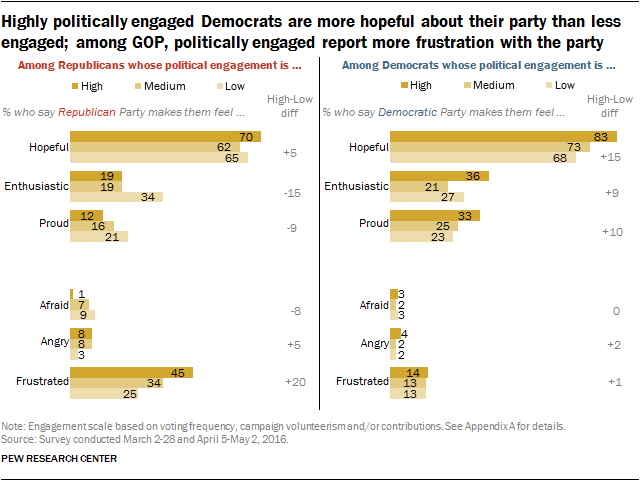
Among Democrats, those with higher levels of political engagement are more likely than those who are less engaged to express positive emotions about their party. But among Republicans the differences in positive feelings are far more modest. And Republicans who are more engaged are less enthusiastic about the party – and more frustrated – than are those who are less active.

Highly engaged Democrats say their party makes them feel hopeful (83%) at higher rates than less engaged Democrats. And while feelings of enthusiasm and pride are not widely felt emotions, those who are the most politically active are more likely to express both emotions about the Democratic Party. Highly engaged Democrats are no more likely than less engaged Democrats to express frustration with their own party (14% vs. 13%).

Highly politically engaged Democrats are more hopeful about their party than less engaged; among GOP, politically engaged report more frustration with the party

Among Republicans, the GOP inspires feelings of hope among similar shares of the highly engaged as well as the least engaged (70% vs. 65%). But about a third of the least engaged Republicans (34%) feel enthusiastic about the GOP, compared with 19% of those who are more politically engaged. Relatively few Republicans overall (16%) feel proud of the GOP, and there is no significant difference by levels of political engagement.

Highly engaged Republicans are, however, more likely than those who are less engaged to express frustration with the GOP: Fully 45% of highly engaged Republicans say this, compared with a quarter (25%) of the least engaged Republicans.

Primary preferences and views of the parties

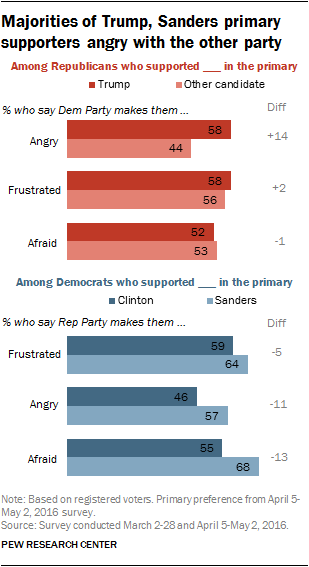
Majorities of Trump, Sanders primary supporters angry with the other party

Republican registered voters who supported Donald Trump in the GOP primary are more likely than those who supported other candidates to say that the Democratic Party makes them feel angry (58% vs. 44%). But Republican voters who supported Trump in the primaries are no more likely than those who did not back Trump to say that they feel frustrated with or afraid of the Democratic Party.

On the Democratic side, voters who supported Hillary Clinton and Bernie Sanders in the primaries are about as likely to say that the Republican Party makes them feel frustrated (59% and 64%, respectively). But Sanders backers are more likely than those who preferred Clinton to say that they the Republican Party makes them feel afraid (68% vs. 55%), and to say that the GOP makes them feel angry (57% vs. 46%).

Republican voters who backed Trump in the primaries are more hopeful, enthusiastic and proud of the Republican Party than those who did not support him in the primaries. For example, 75% of those who supported Trump say the party makes them feel hopeful, compared with 59% of Republicans who supported another candidate.

On the other hand, Democratic supporters of Clinton and Sanders are about equally hopeful or enthusiastic about the Democratic Party, while those who backed Clinton are more likely than Sanders supporters to say that the party makes them proud (32% vs. 21%).

How leaners feel about their party and the opposition

Democratic-leaning independents more likely than Democrats to be frustrated with their party

Like partisans, independents who lean to the Republican or Democratic Party feel negatively toward the opposition. Eight-in-ten Republican-leaning independents (80%) have at least one negative reaction to the Democratic Party (frustration, anger or fear) as do 87% of those who identify as Republicans. Among Democratic leaners, 75% express at least one of these emotions about the GOP, compared with 87% of Democrats.

Democratic leaners are far more likely than Democrats to be frustrated with the Democratic Party. More than a third of Democratic-leaning independents (36%) say they are frustrated with the Democratic Party, compared with just 13% of those who affiliate with the party. Among Republicans and Republican leaners, there are smaller differences in the shares saying they are frustrated with the Republican Party (33% of partisans vs. 40% of leaners).

Both Democrats and Republicans feel more positively toward their parties than do leaners. For instance, 64% of Republicans say their party makes them feel hopeful, compared with just 38% of Republican leaners. And while 73% of Democrats feel hopeful about the Democratic Party, about half (52%) of Democratic leaners say the same.

7. Partisan views of 2016 candidates, Barack and Michelle Obama, views of the election

Republicans and Democrats feel much more negatively toward the other’s party’s presumptive presidential nominees than they do toward members of the opposing party. (The surveys were conducted from early March through early May, before Hillary Clinton and Donald Trump effectively secured their party’s nominations.)

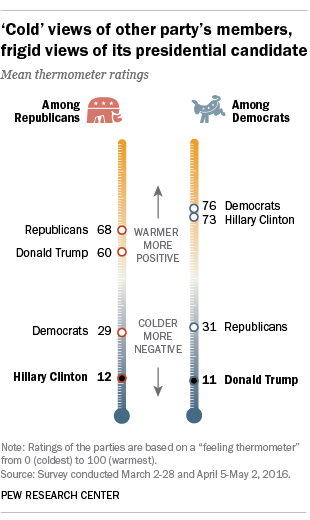
'Cold' views of other party's members, frigid views of its presidential candidate

Republicans’ views of Clinton – and Democrats’ views of Trump – are extraordinarily negative. Republicans give Clinton a mean, or average, rating of just 12 on a “feeling thermometer” ranging from 0 to 100 (where 0 is coldest, 100 warmest). About three-quarters of Republicans (76%) give Clinton a very cold thermometer rating (lower than 25), including 59% who give Clinton a rating of zero.

The average rating for Trump among Democrats is 11. Fully 82% of Democrats give him a very cold rating, with 68% giving him a rating of zero on the 0-100 scale.

Republicans give Democrats an average thermometer rating of 29 – more than double the average rating they give Clinton (12). Nearly half of Republicans (46%) give Democrats a very cold rating, 30 percentage points less than the 76% who give Clinton a very cold rating.

The average rating Democrats give Republicans is 31, far higher than their average rating for Trump (11). And 41% of Democrats give Republicans a very cold rating, half the share that feels very coldly toward Trump (82%).

Democrats’ average thermometer rating for Clinton is 76, which is on par with the rating Democrats give their fellow partisans. But among Republicans, their average rating for Trump (60) is lower than their average rating for Republicans (68).

Political engagement and ratings of Clinton and Trump

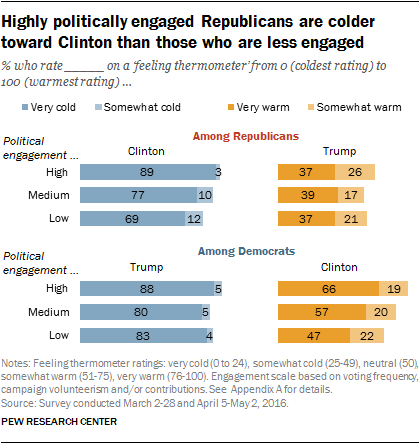
Highly politically engaged Republicans are colder toward Clinton than those who are less engaged

Politically engaged Republicans express more negative views of Clinton than do those who are less politically engaged. By contrast, Democrats’ views of Trump vary little by political engagement.

Nearly nine-in-ten highly politically engaged Republicans (89%) – those who vote regularly and either volunteer or contribute to campaigns – give Clinton very cold thermometer ratings. That compares with 69% of those who are largely disengaged politically (those who do not vote regularly or are not registered to vote).

Among Democrats, views of Trump are consistent across levels of political engagement. Fully 88% of highly engaged Democrats give him a very cold rating, as do 83% of those who not politically engaged.

On the other hand, highly engaged Democrats are more likely than those with lower levels of engagement to give Clinton warm ratings. Among Republicans, views of Trump differ little by levels of political engagement.

Though Clinton is viewed more warmly by Democrats than Trump is by Republicans overall, the contrast is even more pronounced among partisans who are highly politically engaged: While 66% of highly engaged Democrats rate Clinton very warmly (and 85% rate her at least somewhat warmly), just 37% of highly engaged Republicans rate Trump warmly (64% rate him at least somewhat warmly).

Partisanship and feelings about the election

Those with ‘cold’ feelings for other side more certain at the ballot box

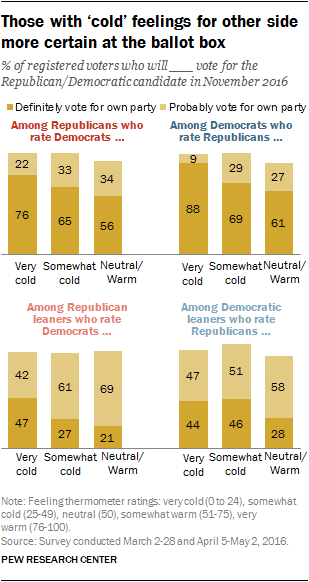
Party affiliation – and leaning – is strongly associated with intention to vote in presidential elections. Nearly all partisans, and in excess of 85% of partisan leaners, say they will definitely or probably vote for the candidate of the party they affiliate with or lean to, regardless of who the candidates are. (These surveys were conducted before Trump and Clinton effectively secured their party’s nominations.)

But those who feel more negatively about the opposing party (and more warmly toward their own) are more certain about their choice in November.

About three-quarters of Republicans who feel very coldly toward Democrats (76%) and almost nine-in-ten Democrats who feel very coldly toward Republicans (88%) say they will definitely remain loyal to their party’s nominee.

Those who feel less coldly toward the opposing party are less definitive in their intentions and more likely to say they will “probably” vote for the party’s nominee. Independent voters, even those who lean toward a party, are less likely than partisans to say they will “definitely” vote for a party’s candidate, though nearly all say they probably or definitely will. But, as with partisans, feelings toward members of the other party are linked to certainty among these voters.

Wide majorities of those cold to other party say it really matters who wins

Republican leaners with very cold feelings for Democrats are 26 points more certain they will support the Republican candidate than those who are neutral or warm (47% vs. 21%). Among Democratic-leaning independents, those with very cold feelings (44%) and somewhat cold feelings (46%) are more likely to say they will definitely support the Democrat than those who are not cold toward Republicans (28%).

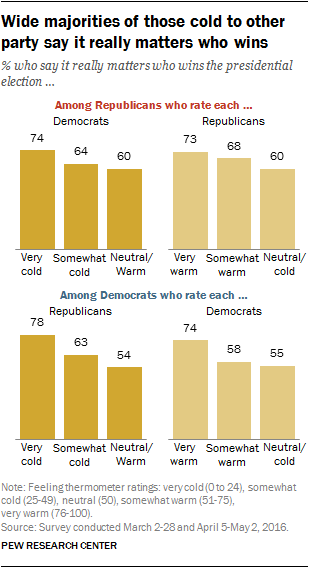
Similarly, partisans with highly negative views of the other party are more likely than those who feel less negatively to say that it really matters who wins this fall’s presidential election.

Overall, two-thirds of both Republicans and Democrats (67%) say it really matters who wins the election. But among Republicans who give Democrats a very cold rating on the feeling thermometer, 74% say it really matters who wins the general election. This group of Republicans is more likely than those with a neutral or warm sentiment toward members of the other party to say it really matters (74% vs. 60%).

Likewise, Republicans who give members of their own party a very warm rating are more likely than those who are neutral or cold to Republicans to say it really matters who wins (73% vs. 60%).

The differences are similar among Democrats. Among all Democrats, 66% say the outcome of the election really matters. Among those who rate Republicans very coldly on the scale, 78% express this view. Fewer of those who are somewhat cold to Republicans (63%) and those who are neutral or warm toward members of the other party (54%) say the same.

And while just over half of Democrats with a neutral or cold rating (55%) or a somewhat warm rating (58%) toward Democrats say it really matters who wins, fully 74% of Democrats who rate members of their own party warmly say this.

Deeply polarized views of Barack and Michelle Obama

Most Republicans feel ‘very coldly’ toward Barack and Michelle Obama

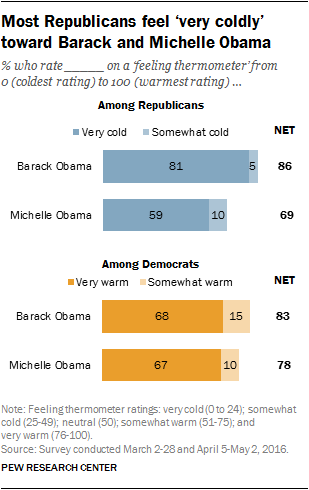
Republicans feel extremely negatively toward Barack Obama, but a majority also gives “very cold” thermometer ratings to Michelle Obama.

Fully 81% of Republicans feel very coldly toward Barack Obama, including 59% who give him a zero on the 0-100 scale; 5% rate him neutrally (50), while just 5% give him a warm rating.

Nearly six-in-ten Republicans (59%) give very cold ratings to Michelle Obama; 40% of Republicans give her a zero. About two-in-ten (21%) give her a neutral rating of 50; only 8% rate her warmly.

Republican views of Barack Obama do not vary substantially by political engagement, though the most politically engaged Republicans are 19 percentage points more likely than the less engaged to give Michelle Obama a cold rating (85% vs. 66%).

Democrats have highly positive views of both Barack and Michelle Obama. Fully 68% rate Barack Obama very warmly (a rating of 76 or more on the 100-points scale), while 67% give the same rating to Michelle Obama. Just 7% of Democrats give either of the Obamas cold ratings.

Methodology

Survey conducted March 2-28, 2016 and April 5-May 2, 2016

The American Trends Panel (ATP), created by the Pew Research Center, is a nationally representative panel of randomly selected U.S. adults living in households. Respondents who self-identify as internet users and who provided an email address participate in the panel via monthly self-administered Web surveys, and those who do not use the internet or decline to provide an email address participate via the mail. The panel is being managed by Abt SRBI.

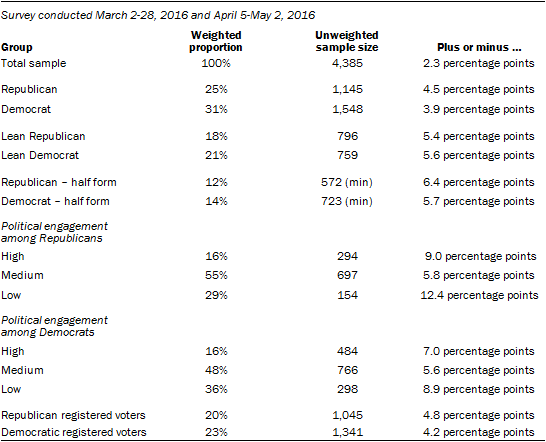
Most of the data in this report are based on 4,385 respondents who participated in both the March 2-28, 2016 and April 5-May 2, 2016 waves of the panel (3,962 by Web and 423 by mail). The margin of sampling error for the full sample of 4,385 respondents is plus or minus 2.3 percentage points.

Members of the American Trends Panel were recruited from two large, national landline and cellphone random-digit-dial (RDD) surveys conducted in English and Spanish. At the end of each survey, respondents were invited to join the panel. The first group of panelists was recruited from the 2014 Political Polarization and Typology Survey, conducted January 23rd to March 16th, 2014. Of the 10,013 adults interviewed, 9,809 were invited to take part in the panel and a total of 5,338 agreed to participate.1 The second group of panelists was recruited from the 2015 Survey on Government, conducted August 27th to October 4th, 2015. Of the 6,004 adults interviewed, all were invited to join the panel, and 2,976 agreed to participate.2

Participating panelists provided either a mailing address or an email address to which a welcome packet, a monetary incentive and future survey invitations could be sent. Panelists also receive a small monetary incentive after participating in each wave of the survey.

The Web component of the combined two waves had a response rate of 78% (3,962 responses among 5,091 Web-based individuals in the panel); the mail component had a response rate of 68% (423 responses among 625 non-Web individuals in the panel). Taking account of the combined, weighted response rate for the recruitment surveys (10.0%) and attrition from panel members who were removed at their request or for inactivity, the cumulative response rate for the combined two ATP waves is 3%.3

The ATP data were weighted in a multi-step process that begins with a base weight incorporating the respondents’ original survey selection probability and the fact that in 2014 some panelists were subsampled for invitation to the panel. Next, an adjustment was made for the fact that the propensity to join the panel and remain an active panelist varied across different groups in the sample. The final step in the weighting uses an iterative technique that matches gender, age, education, race, Hispanic origin and region to parameters from the U.S. Census Bureau’s 2014 American Community Survey. Population density is weighted to match the 2010 U.S. Decennial Census. Telephone service is weighted to estimates of telephone coverage for 2016 that were projected from the January-June 2015 National Health Interview Survey. Volunteerism is weighted to match the 2013 Current Population Survey Volunteer Supplement. It also adjusts for party affiliation using an average of the three most recent Pew Research Center general public telephone surveys. Internet access is adjusted using a measure from the 2015 Survey on Government. Frequency of internet use is weighted to an estimate of daily internet use projected to 2016 from the 2013 Current Population Survey Computer and Internet Use Supplement. Sampling errors and statistical tests of significance take into account the effect of weighting. Interviews are conducted in both English and Spanish, but the Hispanic sample in the American Trends Panel is predominantly native born and English speaking.

The following table shows the unweighted sample sizes and the error attributable to sampling that would be expected at the 95% level of confidence for different groups in the survey:

Methodology_1

Survey conducted April 12-19, 2016

Some of the analysis in this report is based on telephone interviews conducted April 12-19, 2016 among a national sample of 2,008 adults, 18 years of age or older, living in all 50 U.S. states and the District of Columbia (505 respondents were interviewed on a landline telephone, and 1,503 were interviewed on a cell phone, including 914 who had no landline telephone). The survey was conducted under the direction of Abt SRBI. A combination of landline and cell phone random digit dial samples were used; both samples were provided by Survey Sampling International. Interviews were conducted in English and Spanish. Respondents in the landline sample were selected by randomly asking for the youngest adult male or female who is now at home. Interviews in the cell sample were conducted with the person who answered the phone, if that person was an adult 18 years of age or older. For detailed information about our survey methodology, see https://alpha.pewresearch.org/pewresearch-org/methodology/u-s-survey-research/

The combined landline and cell phone sample are weighted using an iterative technique that matches gender, age, education, race, Hispanic origin and nativity and region to parameters from the 2014 Census Bureau’s American Community Survey and population density to parameters from the Decennial Census. The sample also is weighted to match current patterns of telephone status (landline only, cell phone only, or both landline and cell phone), based on extrapolations from the 2015 National Health Interview Survey. The weighting procedure also accounts for the fact that respondents with both landline and cell phones have a greater probability of being included in the combined sample and adjusts for household size among respondents with a landline phone. The margins of error reported and statistical tests of significance are adjusted to account for the survey’s design effect, a measure of how much efficiency is lost from the weighting procedures.

The following table shows the unweighted sample sizes and the error attributable to sampling that would be expected at the 95% level of confidence for different groups in the survey:

Methodology_2

Sample sizes and sampling errors for other subgroups are available upon request.

In addition to sampling error, one should bear in mind that question wording and practical difficulties in conducting surveys can introduce error or bias into the findings of opinion polls.

Pew Research Center undertakes all polling activity, including calls to mobile telephone numbers, in compliance with the Telephone Consumer Protection Act and other applicable laws.

Pew Research Center is a nonprofit, tax-exempt 501(c)(3) organization and a subsidiary of The Pew Charitable Trusts, its primary funder.

Appendix A: Measures and scales

Thermometer ratings

Feeling thermometer categories in this reportThe survey measured ratings toward a number of groups and people in the U.S. on a “feeling thermometer” ranging from zero (“as cold and negative as possible”) to 100 (“as warm and positive as possible”), with 50 as the neutral point. See topline for full question wording.
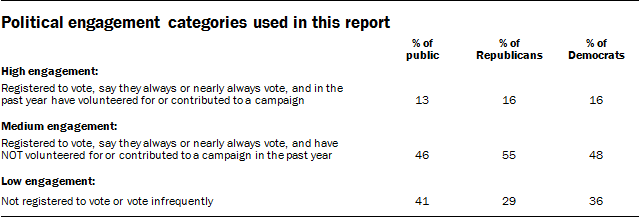
Throughout this report, ratings on the scale are grouped according to intensity as shown in the accompanying table.

Political engagement

Throughout this report, a three category measure of political engagement is used.

Political engagement categories used in this report

Party issue agreement scale

The survey measured respondents’ proximity to the Republican and Democratic policy positions on nine issues. For each issue, respondents could say whether they strongly agree or somewhat agree with either the Republican Party or the Democratic Party, or that they don’t agree with either party. Seven of these issues (health care policy; policies to deal with illegal immigration; policies to deal with climate change; policies to deal with ISIS, the Islamic militant group in Iraq and Syria; abortion policy; gun policy; and policies to deal with the economy) were asked of all respondents and a scale of policy agreement was constructed. For instance, among Democrats, 42% agree (strongly or somewhat) with the Democratic Party on seven out of seven issues. Among Republicans, 38% agree with the Republican Party on seven out of seven issues.

Ideological consistency scale

The ideological consistency scale is composed of 10 questions asked on Pew Research Center surveys going back to 1994 to gauge peoples’ ideological worldview. The questions cover a range of political values including attitudes about size and scope of government, the social safety net, immigration, homosexuality, business, the environment, foreign policy and racial discrimination.

The scale is designed to measure how consistently liberal or conservative people’s responses are across these various dimensions of political thinking (what some refer to as ideological ‘constraint’). Though this measure is correlated with self-identified ideology, where people fall on this scale does not always align with whether they think of themselves as liberal, moderate or conservative.

The questions in the scale were asked on the initial recruitment surveys (either the 2014 Political Polarization and Typology Survey, conducted January 23rd to March 16th, 2014 or the 2015 Survey on Government, conducted August 27th to October 4th, 2015).

For more detail on the items in the scale, see here.