Pew Research Center

FOR RELEASE NOVEMBER 23, 2015

Beyond Distrust: How Americans View Their Government

Broad criticism, but positive performance ratings in many areas

FOR MEDIA OR OTHER INQUIRIES:

Communications Department
202.419.4372
www.pewresearch.org

RECOMMENDED CITATION

Pew Research Center, November 2015, "Beyond Distrust: How Americans View Their Government"

About Pew Research Center

Pew Research Center is a nonpartisan, nonadvocacy fact tank that informs the public about the issues, attitudes and trends shaping the world. It does not take policy positions. The Center conducts public opinion polling, demographic research, computational social science research and other data-driven research. It studies politics and policy; news habits and media; the internet and technology; religion; race and ethnicity; international affairs; social, demographic and economic trends; science; research methodology and data science; and immigration and migration. Pew Research Center is a subsidiary of The Pew Charitable Trusts, its primary funder.

© Pew Research Center 2026

Table of contents

  • About Pew Research Center
  • Beyond Distrust: How Americans View Their Government
  • 1. Trust in government: 1958-2015
  • 2. General opinions about the federal government
  • 3. Views of government’s performance and role in specific areas
  • 4. Ratings of federal agencies, Congress and the Supreme Court
  • 5. Political engagement and views of government
  • 6. Perceptions of elected officials and the role of money in politics
  • 7. Views of the political parties and how they manage government
  • 8. Perceptions of the public’s voice in government and politics
  • 9. Views of the nation, how it’s changing and confidence in the future
  • 10. Government and taxes
  • 11. How government compares with other national institutions
  • Methodology
  • Appendix A: Why partisans include ‘leaners’

Beyond Distrust: How Americans View Their Government

Broad criticism, but positive performance ratings in many areas

Overview
Overview - 1

A year ahead of the presidential election, the American public is deeply cynical about government, politics and the nation’s elected leaders in a way that has become quite familiar.

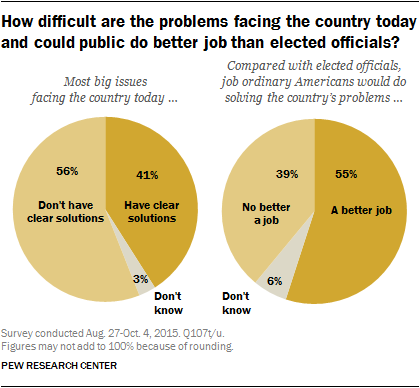
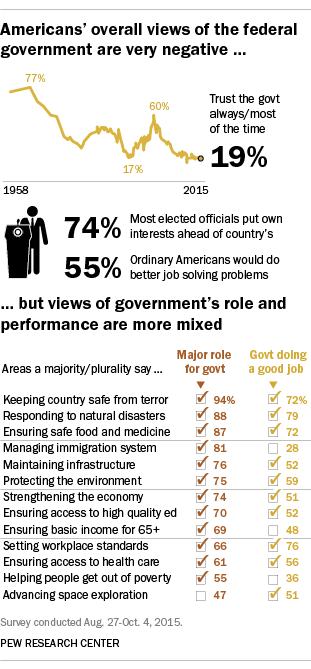
Currently, just 19% say they can trust the government always or most of the time, among the lowest levels in the past half-century. Only 20% would describe government programs as being well-run. And elected officials are held in such low regard that 55% of the public says “ordinary Americans” would do a better job of solving national problems.

Yet at the same time, most Americans have a lengthy to-do list for this object of their frustration: Majorities want the federal government to have a major role in addressing issues ranging from terrorism and disaster response to education and the environment.

And most Americans like the way the federal government handles many of these same issues, though they are broadly critical of its handling of others – especially poverty and immigration.

A new national survey by Pew Research Center, based on more than 6,000 interviews conducted between August 27 and October 4, 2015, finds that public attitudes about government and politics defy easy categorization. The study builds upon previous reports about the government’s role and performance in 2010 and 1998. This report was made possible by The Pew Charitable Trusts, which received support for the survey from The William and Flora Hewlett Foundation.

The partisan divide over the size and scope of government remains as wide as ever: Support for smaller government endures as a Republican touchstone. Fully 80% of Republicans and Republican-leaning independents say they prefer a smaller government with fewer services, compared with just 31% of Democrats and Democratic leaners.
Overview - 2

Yet both Republicans and Democrats favor significant government involvement on an array of specific issues. Among the public overall, majorities say the federal government should have a major role in dealing with 12 of 13 issues included in the survey, all except advancing space exploration.

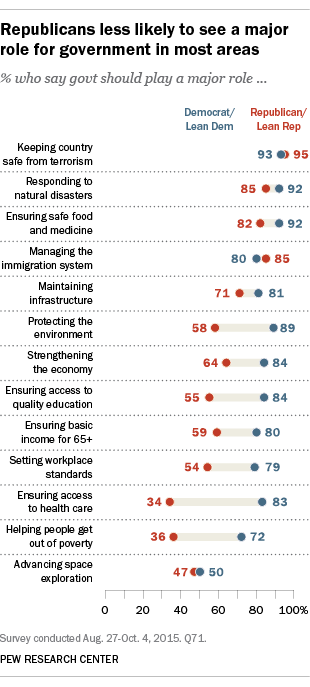
There is bipartisan agreement that the federal government should play a major role in dealing with terrorism, natural disasters, food and medicine safety, and roads and infrastructure. And while the presidential campaign has exposed sharp partisan divisions over immigration policy, large majorities of both Republicans (85%) and Democrats (80%) say the government should have a major role in managing the immigration system. But the partisan differences over government’s appropriate role are revealing – with the widest gaps on several issues relating to the social safety net.

Only about a third of Republicans and Republican leaners see a major role for the federal government in helping people get out of poverty (36%) and ensuring access to health care (34%), by far the lowest percentages for any of the 13 issues tested. Fully 72% of Democrats and Democratic leaners say the government should have a major role in helping people out of poverty, and 83% say it should play a major role in ensuring access to health care.

Moreover, while majorities of Republicans favor a major government role in ensuring a basic income for people 65 and older (59%), protecting the environment (58%) and ensuring access to high-quality education (55%), much larger shares of Democrats – 80% or more in each case – favor a large government role.

However, these differences are a matter of degree. Overwhelming numbers of Republicans and Democrats say the federal government should have either a major or minor role on all 13 issues tested. Relatively few in either party want the government to have no role in these issues, though 20% of Republicans say the government should have no role in ensuring health care.

Why We Include “Leaners” in the Republican and Democratic Groups

Throughout most of this report, Republicans and Democrats include independents and other non-partisans who lean toward the parties. In virtually all situations, these Republican and Democratic leaners have far more in common with their partisan counterparts than they do with each other if combined into a single “independent” group. See appendix A for more detail.


Views of what government does well – and what it doesn’t

Overview - 3

At a general level, the public finds the government frustrating and badly managed. Just 20% say the federal government runs its programs well, and 59% say it is in need of “very major reform,” up 22 percentage points since 1997.

These assessments stand in contrast with the public’s more mixed views of government performance at a specific level. In 10 of 13 areas included in the survey, the balance of opinion about government performance is more positive than negative.

In several areas, Democrats and Republicans give the federal government similar ratings: Large majorities of both Democrats and Republicans say it does a good job of responding to natural disasters (82% and 78%, respectively) and setting fair and safe standards for workplaces (79% and 77%, respectively).

Roughly half in each party say the federal government does well in maintaining roads, bridges and other infrastructure (52% of Democrats, 50% Republicans) and ensuring access to high-quality education (54% of Republicans, 52% of Democrats).

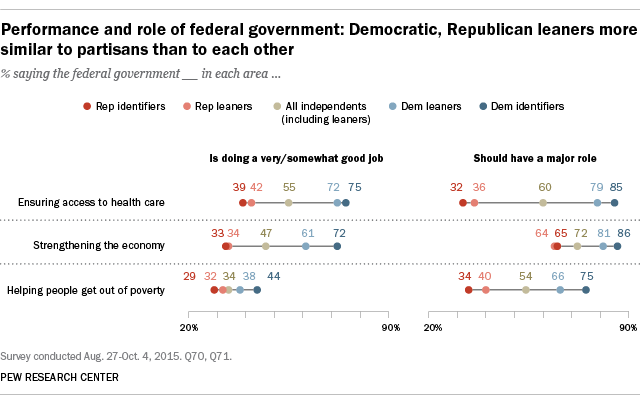
However, there are substantial partisan differences in views of government performance on a pair of issues that are likely to be important in the 2016 campaign. Republicans are half as likely as Democrats to say the government does a good job in strengthening the economy (34% vs. 68%). And the gap is as large in perceptions of government performance in ensuring access to health care (40% of Republicans vs. 74% of Democrats).

Notably, neither Democrats nor Republicans give the federal government positive ratings when it comes to helping people get out of poverty. Just 42% of Democrats and 30% of Republicans say the government does well in lifting people out of poverty. For Democrats, the low ratings come on an issue for which there is broad support for large-scale government involvement (72% of Democrats favor a major government role). By contrast, Republicans are highly critical of government performance on poverty, but just 36% say government should have a major role in addressing this issue.

The government gets very negative ratings from members of both parties for its management of the immigration system. Four-in-ten Democrats think the government does well on immigration, compared with 15% of Republicans – the lowest rating among Republicans for the government’s handling of any issue.

Are Republicans now ‘angrier’ at government?

For years, the public’s general feelings about government have tended more toward frustration than anger.

Currently, 22% say they are “angry” at the federal government; 57% are “frustrated,” and 18% say they are “basically content.” These sentiments have changed little over the past year, but two years ago – during the partial government shutdown – a record 30% expressed anger at government.

Overview - 4

The share of Republicans and Republican leaners saying they are angry with the government is not as high as in October 2013 (32% now, 38% then). Nonetheless, Republicans are nearly three times as likely as Democrats (12%) to say they are angry with the government. And among politically engaged Republicans and Democrats – those who vote frequently and follow politics on a regular basis – the gap is nearly four-to-one (42% to 11%).

Among both Democrats and Republicans, large majorities say they can seldom, if ever, trust the federal government (89% of Republicans, 72% of Democrats). While trust in government among Republicans has varied widely depending on whether a Republican or Democrat is in the White House, Democrats’ views have shown far less change.

In Barack Obama’s six years as president, 13% of Republicans, on average, have said they can trust the government always or most of the time – the lowest level of average trust among either party during any administration dating back 40 years. During George W. Bush’s presidency, an average of 47% of Republicans said they could trust the government. By contrast, the share of Democrats saying they can trust the government has been virtually unchanged over the two administrations (28% Bush, 29% Obama).

Other general attitudes about the federal government have moved in a more negative direction over the past two decades. Nearly six-in-ten (59%) say the government needs “very major reform,” up from 37% in 1997 during the Clinton administration. Most of the change has come among Republicans – fully 75% say the government needs very major reform, up from 43% in 1997; among Democrats, 44% say the government needs sweeping reform, compared with 31% then.

Republicans also are far more likely than Democrats to say that the government is wasteful and inefficient (75% vs. 40% of Democrats) and to give the government a “poor” rating for how it operates its programs (50% vs. 18%).

In politics, most say ‘their side’ is losing

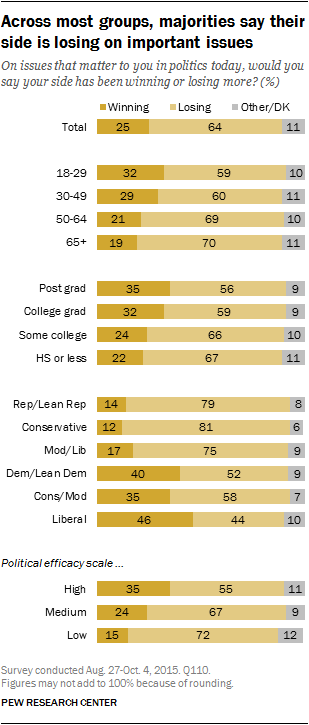
While overall views of the federal government are very negative, there also are several indications of widespread dissatisfaction with the current state of politics. In politics today, far more people say “their side” – however they perceive it – is losing more often than it is winning.

Overview - 5

Overall, nearly two-thirds of Americans (64%) say that on the issues that matter to them, their side loses more often than it wins. Just 25% say their side comes out ahead more often.

This sense of “losing” is more widely shared among Republicans than Democrats – large majorities of both conservative Republicans (81%) and moderate and liberal Republicans (75%) say their political side loses more often than it wins.

But while most Republicans feel like they lose more often than they win, most Democrats do not feel like “winners” either. Overall, 52% of Democrats say their side loses more often than it wins, while 40% say it usually wins. Liberal Democrats are divided over whether their side wins or loses more often (46% winning vs. 44% losing) – the only ideological group in which a majority does not think its side is losing.

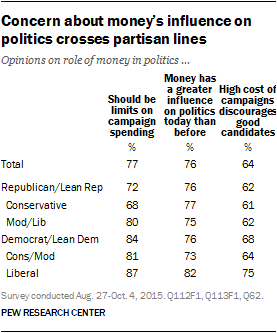
Cynicism about politics also is reflected in the public’s attitudes regarding money in politics. Fully 76% say that “money has a greater influence on politics and elected officials today than in the past.” Just 22% say the influence of money in politics is little different than in the past.

And, as both parties’ nominating contests continue, 64% of all Americans – including 68% of Democrats and 62% of Republicans – say that the high cost of a presidential campaign “discourages many good candidates from running.” Just 31% overall say that the high cost of presidential campaigns does not discourage good candidates from running.

Overview - 6

Increasingly, Americans even express less confidence in their own collective political wisdom. Just 34% say they have a very great deal or good deal of confidence in the wisdom of the American people when it comes to making political decisions, while 63% have little or no confidence. In January 2007, these opinions were almost the reverse – 57% had at least a good deal of confidence in the political wisdom of the people, while 41% did not.

The loss of confidence cuts across the political spectrum: 36% of Republicans have at least a great deal of confidence in the public’s political wisdom; 61% did so in 2007. The decline has been about as large among Democrats (57% then, 37% now).

Elected officials: ‘intelligent,’ not ‘honest’

Negative views of elected officials are hardly a new phenomenon – for years, large majorities have faulted elected officials for losing touch with Americans and not caring about the views of average people. But with the election approaching, the criticisms of elected officials have taken on an especially sharp edge.

Just 22% of the public say that most elected officials put the interests of the country ahead of their own interests; 74% say they put their own interests ahead of the nation’s.

When asked if certain traits apply to elected officials – as well as to business leaders and the typical American – most people do say the term “intelligent” describes elected officials very or fairly well (67%). However, just as many view the “typical American” as intelligent. Somewhat more (83%) say the term describes business leaders well.

Overview - 7

And elected officials receive very low marks for honesty. Just 29% say the term “honest” describes elected officials. That compares with 45% who say business leaders are honest and 69% who say the same about typical Americans.

A large majority of the public (72%) also views elected officials as “selfish” – but that criticism is not unique to politicians. Comparable percentages also say the term applies to typical Americans (68%) and business leaders (67%).

Perhaps the most withering critique of elected officials is the belief – shared by a majority of the public – that “ordinary Americans” could do a better job than they could of solving the nation’s problems.

Overview - 8

Most Americans (56%) acknowledge that the problems facing the country do not have clear solutions. Even so, most (55%) also say ordinary Americans could do a better job of solving national problems than elected officials.

There are few meaningful partisan differences in views of elected officials. Nearly identical shares of Republicans and Democrats view elected officials as intelligent, honest and selfish. However, Republicans are somewhat more likely than Democrats to say that ordinary people are more capable of solving the nation’s problems (62% vs. 49%).

Other important findings
Overview - 9

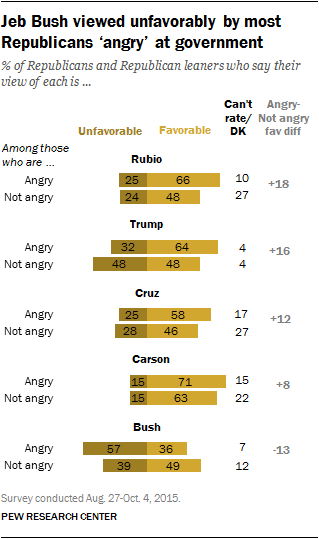
‘Anger’ at government and views of GOP candidates. Donald Trump is viewed more favorably by the nearly one-third of Republicans and leaners who are angry at government (64% favorable) than by those who are frustrated or content with government (48%). Other GOP presidential candidates (Marco Rubio, Ted Cruz and Ben Carson) also get higher favorable ratings among Republicans who are angry at government than among non-angry Republicans, in part because they are better known among the “angry” group.

In contrast, Jeb Bush’s favorable rating is 18 percentage points lower among “angry” than “non-angry” Republicans (57% vs 39%).

Deep partisan divides among the politically engaged. When it comes to the role of government in specific areas, already-wide partisan gaps grow even wider among politically engaged adults, particularly over government’s role in health care, poverty assistance, education, environmental protection and the economy. For example, fully 90% of politically engaged Democrats say the government should have a major role in ensuring access to health care; just 21% of politically engaged Republicans agree. Among less-engaged Democrats and Republicans the differences are not as dramatic (79% of Democrats vs. 47% of Republicans).

Views of government agencies. Most government agencies continue to be viewed favorably by majorities of the public. Fully 84% have a favorable view of the U.S. Postal Service – the highest rating among 17 agencies and departments tested. But just 39% have a favorable opinion of the scandal-plagued Department of Veterans Affairs, and its favorable rating has plummeted 29 percentage points since 2013.

Is politics a contest between right and wrong? Most Americans reject the idea that “politics is a struggle between right and wrong.” However, 53% of conservative Republicans do see politics this way – the highest share of any ideological group.

Overview - 10

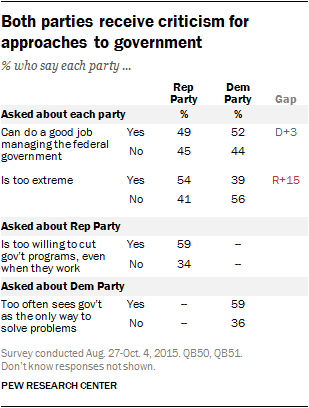
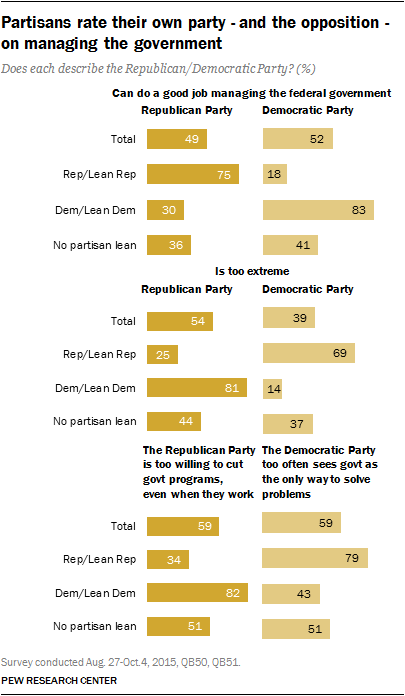
Opinions of the political parties and governance.  Similar shares of the public say the Democratic Party (52%) and the Republican Party (49%) could do a good job managing the federal government. Yet both also are criticized for their approaches to governance: 59% say the GOP is too willing to cut government programs, even when they work; an identical percentage (59%) says the Democratic Party too often sees government as the only way to solve problems.

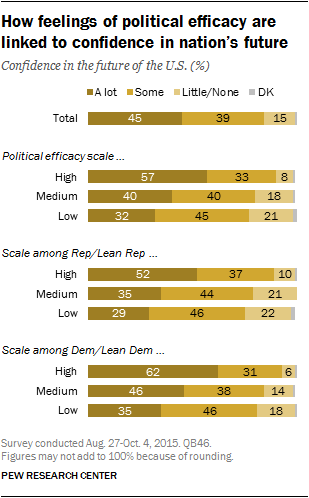
Young people less confident in the nation’s direction. About four-in-ten adults younger than 30 (38%) say they have “quite a lot” of confidence in the nation’s future. Among those 50 and older, 50% are highly confident in the nation’s future.

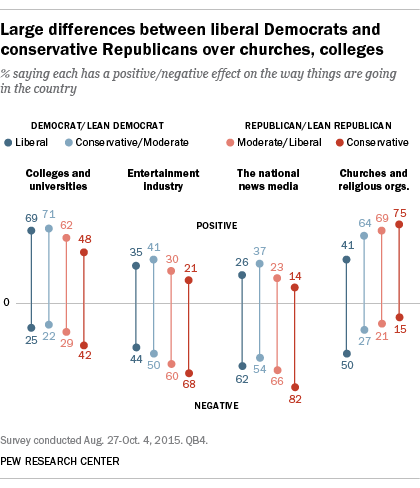
Views of other national institutions. The federal government is not the only national institution viewed negatively by the public. A majority (56%) say large corporations have a negative impact on the country, while an identical percentage says the same about the entertainment industry. And nearly two-thirds (65%) say the national news media has a negative effect on the country.

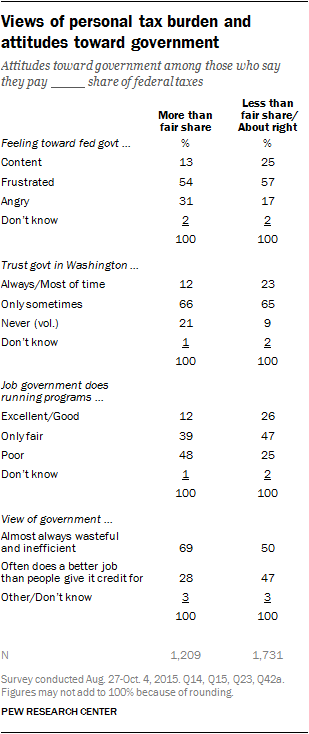
Opinions about taxes and government. While the public expresses a range of negative assessments of the government, there continues to be limited public outcry over personal tax burdens. Slightly more than half (54%) say they think they pay about the right amount in taxes, considering what they get from the federal government. At the same time, 52% say that most Americans demand more from the government than they are willing to pay for in taxes.

1. Trust in government: 1958-2015

The public’s trust in the federal government continues to be at historically low levels. Only 19% of Americans today say they can trust the government in Washington to do what is right “just about always” (3%) or “most of the time” (16%).

Trust - 1

Fewer than three-in-ten Americans have expressed trust in the federal government in every major national poll conducted since July 2007 – the longest period of low trust in government in more than 50 years. In 1958, when the American National Election Study first asked this question, 73% said they could trust the government just about always or most of the time.

The erosion of public trust in government began in the 1960s. The share saying they could trust the federal government to do the right thing nearly always or most of the time reached an all-time high of 77% in 1964. Within a decade – a period that included the Vietnam War, civil unrest and the Watergate scandal – trust had fallen by more than half, to 36%. By the end of the 1970s, only about a quarter of Americans felt that they could trust the government at least most of the time.

Trust in government rebounded in the 1980s before falling in the early to mid-1990s. But as the economy boomed in the late 1990s, confidence in government increased. And in 2001, the 9/11 terror attacks on the United States transformed public attitudes on a range of issues – including trust in government.

In early October 2001, a month after the attacks, 60% said they could trust the government, roughly double the share earlier that year and the highest percentage expressing trust in government in more than 40 years. But the rise in government trust was short-lived – by the summer of 2002, the share saying they could trust the government had tumbled 22 percentage points.

Amid the war in Iraq and economic uncertainty at home, trust in government continued to decline. By July 2007, trust had fallen to 24%. Since then, the share saying they can trust the federal government has generally fluctuated in a narrow range, between 20% and 25%.

Trust in government and partisanship

Currently, 26% of Democrats and Democratic leaners say they can trust the federal government nearly always or most of the time, compared with 11% of Republicans and Republican leaners. Since Barack Obama took office in 2009, higher shares of Democrats than Republicans have expressed trust in government.

Since the 1970s, trust in government has been consistently higher among members of the party that controls the White House than among the opposition party. However, Republicans are much more reactive than Democrats to changes in political power. Republicans express much higher levels of trust during Republican than during Democratic presidencies, while Democrats’ attitudes tend to be more consistent, regardless of which party controls the White House.

Trust - 2

During the eight years of George W. Bush’s presidency, 47% of Republicans, on average, said they could trust the federal government just about always or most of the time. During Obama’s presidency, average trust among Republicans has fallen to 13% – by far the lowest level of average trust among either party during any administration dating back to the 1960s.

Trust - 3

Average trust among Democrats, by contrast, has remained more stable throughout the George W. Bush and Obama years. During the Obama administration, trust among Democrats has averaged 29%, compared with 28% during the Bush administration.

Trust in government – among the public overall, and among both Republicans and Democrats – was much higher during Bush’s first term than his second. Among the public, trust on average fell from 43% in Bush’s first term, which included the post-9/11 spike in trust, to 29% in his second. The decline came among both Republicans, whose average trust declined from 54% to 41%, and Democrats (35% to 21%).

While the falloff in Republican trust in government between the Bush and Obama administrations has been striking, it continues a pattern that has persisted for decades. During Ronald Reagan’s two terms, an average of 52% of Republicans expressed trust in government, and 43% did so during George H.W. Bush’s single term. This compares with 26% average trust among Republicans during Jimmy Carter’s presidency and 25% during Bill Clinton’s. Average trust among Democrats across all four of these presidencies – Carter’s, Reagan’s, Bush’s and Clinton’s – showed far less variance.

Trust in recent times: A closer look

In January 2001, following the contentious 2000 presidential election, a CBS/New York Times poll found that only 31% of Americans said they could trust the government just about always or most of the time. In the wake of the 9/11 terrorist attacks eight months later, however, trust rose to 60% among the general public, according to a Gallup poll conducted in early October.

Trust - 4

This near-doubling from the start of the year crossed party lines: Fully 67% of Republicans and Republican leaners and 51% of Democrats and Democratic leaners said they could trust the government nearly always or most of the time. But this spike in confidence was short-lived. By December 2001, about half of Americans (48%) said they could trust the federal government; trust remained relatively high among Republicans (60%), while falling to 39% among Democrats.

In July 2003, as opposition to the Iraq War grew, 36% of the public said they trusted government, according to a CBS/New York Times poll. About half of Republicans (51%) trusted government compared with just 25% of Democrats.

As Bush began his second term in 2005, trust in government continued to be deeply divided along partisan lines. In a Pew Research Center survey conducted in September 2005, shortly after Hurricane Katrina struck the Gulf Coast, 49% of Republicans and just 19% of Democrats said they could trust the federal government.

Public trust in the federal government declined, especially among Republicans, during the final years of Bush’s presidency. In January 2007, Republicans were almost twice as likely as Democrats to express trust in the federal government (43% vs. 22%). By October 2008, during the financial crisis, just 19% of Republicans and 12% of Democrats trusted the government to do the right thing.

After Obama took office, Republican trust in government – already quite low – sank further. In a Pew Research Center survey in March 2010, amid the contentious debate over the Affordable Care Act, about a third of Democrats (32%) said they could trust the government at least most of the time, compared with just 13% of Republicans.

The bitter debate over the debt ceiling in 2011 eroded Democratic trust in government. In a September 2011 CNN survey, just 20% of Democrats and Democratic leaners expressed trust in the federal government. Even fewer Republicans (10%) trusted the federal government.

With Obama’s re-election in 2012, Democratic trust in government increased, reaching 37% in January 2013; at that time, just 15% of Republicans had confidence in the federal government. But by October 2013, amid a partial shutdown of the federal government, trust in government had fallen 10 percentage points among Democrats, to 27%, and 5 points among Republicans (to 10%).

Since then, trust in government has fluctuated, but the levels of government trust today are about the same as they were in fall 2013: Just 26% of Democrats and 11% of Republicans say they can trust the federal government just about always or most of the time.

Low trust in government across demographic spectrum

Trust - 5

Trust in government differs only modestly between demographic groups. No more than about a quarter in any group trusts the federal government just about always or most of the time.

Young people are somewhat more likely than older adults to say they can trust the federal government. About a quarter of adults younger than 30 (27%) trust the government at least most of the time, compared with 19% of those ages 30 to 49 and 15% of those 50 and older.

Whites are slightly less trusting of government – only 15% feel they can always or mostly trust the government – than blacks (23%) or Hispanics (28%). Trust in government among whites is also down from February 2014 when 22% reported largely trusting the government.

While Republicans and Republican leaners generally express very little trust in the federal government, trust is especially low among conservative Republicans. Just 9% say they can trust the government always or most of the time, compared with 14% of moderate and liberal Republicans. Among Democrats and Democratic leaners, comparable shares of liberals (28%) and moderates and conservatives (25%) express trust in government.

And among all politically engaged Republicans, just 6% say they can trust the government; more than three times as many (22%) volunteer they can “never” trust the government. There are no significant differences among Democrats by level of political engagement.

Trust in government by generation

Trust - 6

Historically, there have been only modest generational differences in trust in government. Over time, the trajectory of these attitudes has been similar across generations.

As noted, young people are slightly more trusting in the federal government than older people. Currently, 25% of Millennials (ages 18-34) say they can trust the federal government just about always or most of the time. That compares with 19% of Gen Xers (35-50), 14% of Boomers (51-69) and 16% of Silents (70-87).

In 2009 and 2010, the differences across generations were somewhat larger: In August 2009, the three-point moving average of trust in the federal government among Millennials was 36%, compared with about 20% across older generations.

In the early 1990s, Gen Xers – whose oldest members were then in their early 20s – expressed somewhat greater trust in government than did Boomers and Silents, but these differences have diminished over time. Similarly, there were, at most, small differences in trust between Boomers and Silents in the 1970s and 1980s. Most important, the steep downward slide in trust in government that occurred in the 1970s was seen among both Boomers and Silents.

Trust in government and satisfaction with the nation

Trust - 7

Trust in government often, though not always, moves in parallel with satisfaction in the overall state of the nation. The periods of especially low trust in the federal government – the late 1970s, the early 1990s, and the years since the financial crisis and Great Recession – have also been characterized by relatively low levels of satisfaction with national conditions.

But during recent periods of rapid economic growth, such as the mid-1980s and late 1990s, national satisfaction increased more dramatically than did trust in the federal government.

Over the course of the 2000s, the two indicators moved in lockstep. Both reached a high in the aftermath of the 9/11 terror attacks and declined over the next several years.

After plunging in October 2013 with the government shutdown, satisfaction in the nation has rebounded somewhat. Currently, slightly more than a quarter of Americans (27%) say they are satisfied in the country. Trust in government has so far lagged behind and remains at historically low levels.

Erosion of trust and diminished belief in government fairness

Trust - 8

The long-term erosion of public trust in the federal government has been mirrored by a steep decline in the belief that the government is run for the benefit of all Americans.

The 1960s were a period in which Americans had highly favorable attitudes toward the federal government. In 1964, 64% said that the government was “run for the benefit of all the people,” according to the National Election Study. Just 29% said that the government was “pretty much run by a few big interests looking out for themselves.”

At the same time, an overwhelming majority of the public (77%) said they could trust the federal government just about always or most of the time.

Yet within a decade, trust had plummeted and the share of Americans who said the government was run for the benefit of all had fallen nearly 40 percentage points – from 64% in 1964 to 25% in 1974.

Over the course of the past half-century, the two measures have mapped very closely. Currently, just 19% say the government is run for the benefit of all – and an identical percentage says they can trust the federal government just about always or most of the time.

2. General opinions about the federal government

Since the late 1990s, the public’s feelings about the federal government have tended more toward frustration than either anger or contentment. That remains the case today: 57% feel frustrated with the government, while smaller shares either feel angry (22%) or are basically content (18%).

Yet while the public’s sentiments about government have not changed dramatically, Americans increasingly believe the federal government is in need of sweeping reform. Fully 59% say the government needs “very major reform,” up from 37% in 1997.

Overall attitudes about government – from the feelings it engenders to views of its performance and power – are deeply divided along partisan lines. And, like public trust in government, the partisan tilt of these opinions often changes depending on which party controls the White House. However, it is notable that on several measures, including perceptions of whether government is a “friend” or “enemy,” Republicans are far more critical of government today than they were during the Clinton administration.

More are frustrated than angry at government

Views of govt - 1

Anger at government is more widespread today than it was in the 1990s. Only on rare occasions, however, do more than about a quarter of Americans express anger at the federal government.

During the partial government shutdown in October 2013, 30% said they were angry at the government – the highest percentage in nearly two decades of polling. Since then, the share expressing anger at government has declined; currently, 22% say they are angry at the government.

Since the late 1990s, majorities have expressed frustration with the federal government – with one notable exception. In November 2001, during the period of national unity that followed the 9/11 terrorist attacks, 53% said they were basically content with the federal government, while just 34% expressed frustration (and only 8% said they were angry).

Views of govt - 2

Currently, 32% of Republicans and Republican-leaning independents say they are angry at the federal government, compared with 12% of Democrats and Democratic leaners. The share of Republicans who are angry at government has declined since the fall of 2013 (from 38%); over the same period, anger among Democrats has fallen by about half (from 25% to 12%).

Throughout most of the Obama presidency, a quarter or more of Republicans have expressed anger at the government; during the George W. Bush administration, GOP anger was consistently no higher than 10%. Conversely, Democratic anger at government peaked in October 2006, when 29% expressed anger at government.

Views of govt - 3

Currently, 37% of conservative Republicans express anger at the federal government, compared with 24% of moderate and liberal Republicans. There are no significant differences in the shares of liberal Democrats (11%) and conservative and moderate Democrats (13%) who are angry at the government.

Among demographic groups, whites and older Americans are especially likely to express anger at the government. A quarter of whites say they are angry at the federal government, compared with 17% of Hispanics and 12% of blacks.

Roughly three-in-ten adults ages 50 and older (29%) say they are angry, about twice the share who say they are content with government (13%). Among those younger than 30, the balance of opinion is reversed — just 12% say they are angry with government, while 28% say they are basically content.

Biggest problem with government? Congress, politics cited most often

Asked to name in their own words the biggest problem with the government in Washington, 13% specifically mention Congress, including 11% who cite gridlock or an inability to compromise within the institution. Nearly as many (11%) name politics and partisanship, while 7% mention the size or scope of government and 6% cite corruption.

Views of govt - 4

Democrats and Democratic-leaning independents are more likely to name Congress than are Republicans: 17% of Democrats say this, compared with 10% of Republicans.

Among those who call out politics as the biggest problem, several specifically mention those in the opposing party: 9% of Republicans name Barack Obama, Democrats or a “liberal agenda” as the main problem, while 7% of Democrats point to Republicans or a “conservative agenda.”

The size of government and corruption are mentioned more frequently by Republicans than Democrats: 11% of Republicans say government plays too big a role, compared with 4% of Democrats. And while 10% of Republicans mention corruption, just 3% of Democrats do so.

Overall, just 5% of the public cites debt or overspending as the biggest problem with the federal government, while 4% each mention the economy or jobs and health care.

More Republicans (8%) than Democrats (4%) name the deficit and fiscal irresponsibility as the leading problem, while Democrats are somewhat more likely to mention health care (6% vs. 1%).

Most say the government needs sweeping reforms

In 1997, most Americans (62%) said the federal government was “basically sound” and needed only minor reforms or said it needed very little change. Far fewer (37%) said it needed “very major reform.” By 201o, those attitudes had flipped – more said the government needed major reform (53%) than said it was sound or needed little change (45%).

Views of govt - 5

Today, 59% say it needs very major reform, while only 39% say the federal government needs little or no change.

Most of the change since the late 1990s has come among Republicans: Fully 75% of Republicans and leaners now say the federal government needs very major reform, up from 43% in 1997 and 66% five years ago. The share of Democrats saying the government is in need of sweeping reform has risen more modestly since 1997 – 44% now, 31% then – and has barely changed since 2010 (42%).

The public’s overall rating of the government’s performance also has become more negative. Most Americans now say the federal government is doing either an only fair (44%) or poor (33%) job running its programs; just 20% give it an excellent or good rating on this measure.

In 2010, 28% gave the government a “poor” rating for handling programs and 20% did so in 1997. As is the case in views of government reform, the increase in poor ratings for government performance have come almost entirely among Republicans.

Half of Republicans and Republican leaners (50%) now say the government does a poor job running its programs, compared with 46% who said this in 2010 and just 29% who did so in 1997. Conservative Republicans and Republican leaners are particularly likely to rate the government’s performance as poor. About six-in-ten conservative Republicans (59%) say this, compared with 36% of moderate and liberal Republicans. However, moderate and liberal Republicans are not particularly positive about government either: 49% rate its performance as only fair, and just 14% say it is doing an excellent or good job.

Among Democrats and leaners, only 18% currently say the federal government does a poor job running its programs, which reflects just a 7-percentage-point increase since 1997. Half of Democrats (50%) rate government’s performance as only fair, while 30% say it does an excellent or good job.

Is government a ‘friend’ or ‘enemy?’

Views of govt - 6

Asked to place themselves on a scale from 1 to 10 “where ‘1’ means you think the federal government is your enemy and ‘10’ means you think the federal government is your friend,” 27% of registered voters say they think of government as an enemy (1-4), up 8 points since 1996. The share of voters who place themselves in the middle of the scale (5-6) has declined from 44% to 39%. A third (33%) currently say they view the government as a friend (7-10), little changed from 36% in 1996.

Today, 35% of Republican voters view the federal government as an enemy, up from 22% in 1996. Similarly, 34% of independents take this view, a 13-point increase from 19 years ago.1

In 1996, Republicans were somewhat more likely to view the government as a friend (34%) than as an enemy (22%). Today, that balance of opinion is reversed: 21% say they see it as a friend, while 35% see it as an enemy.

Half of all Democrats (50%) see the government as a friend; only 12% see the government as an enemy. These views are similar to opinions among Democrats in 1996.

Few think the government is run ‘for the benefit of all people’

Views of govt - 7

About three-quarters of the public (76%) say the federal government is “run by a few big interests,” while only 19% say the government “is run for the benefit of all the people.” This view is little changed over the past five years, and is on par with views in the early 1990s.

The sense that the government is run by a few big interests has long been the view of most Americans, with majorities consistently saying this for much of the past 15 years (one exception is in 2002, about a year after the Sept. 11 attacks, and a time of relatively high trust in government). Public views of the influence of big interests have largely tracked with movements in public trust in government.

The belief that government is run by a few big interests spans all demographic and partisan groups. Majorities in both parties now say that a few big interests run the government, though this view is somewhat more widely held among Republicans and Republican-leaning independents (81% say this) than among Democrats and Democratic-leaning independents (71%).

Size and scope of government

Views of govt - 8

Currently, 53% favor a smaller government that provides fewer services, while 38% prefer a bigger government with more services. These opinions have changed little in recent years, but on several occasions in the 1990s, 60% or more favored smaller government.

The partisan divide over the size of government is not new, though it is particularly wide today. Eight-in-ten Republicans and Republican-leaning independents (80%) favor a smaller government, 15 points higher than did so in January 2007, while Democratic views have remained largely unchanged (31% favor a smaller government, compared with 32% in 2007).

Views of govt - 9

There also are ideological divisions within each party. Nearly nine-in-ten conservative Republicans (87%) prefer a smaller government, while a smaller majority (71%) of moderate and liberal Republicans say this. And among Democrats, two-thirds (67%) of liberal Democrats prefer a bigger government with more services, but a narrower 53% majority of conservative and moderate Democrats say this (36% prefer a smaller government, with fewer services).

Views of govt - 10

By more than two-to-one (62% to 27%), whites prefer a smaller government that provides fewer services. A majority of blacks (59%) – and an even larger share of Hispanics (71%) – favor a larger government with more services.

About half of 18- to 29-year-olds (52%) would rather have a bigger government providing more services; only a quarter of those ages 65 and older (25%) say this. The gap between older and younger people is seen within parties as well: 35% of younger Republicans favor a bigger government, compared with 6% of Republicans 65 and older. Younger Democrats are more supportive of bigger government than older Democrats (65% vs. 48%).

Lower-income households stand out for their support of bigger government: 49% of those with family incomes of less than $30,000 prefer larger government, the highest share of any income category.

Views of govt - 11

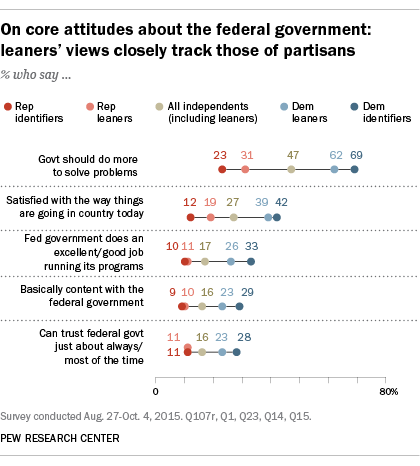
A separate question frames the issue of the scope of government somewhat differently: Should government “do more to solve problems,” or is it “doing too many things better left to businesses and individuals?” The public is evenly divided, as it has been since the question was first asked in 2010: 47% say the government should do more to solve problems, while 48% say it is doing too many things better left to businesses and individuals.

There is a wide partisan gap in views of how much the government should do. Two-thirds of Democrats (66%) say the government should do more to solve problems; 71% of Republicans say it is doing too many things better left to others.

Government viewed as ‘wasteful and inefficient’

The perception of government as wasteful and inefficient has endured for decades. But partisan views of government wastefulness, like trust in government, change depending on which party controls the White House.

Views of govt - 12

Overall, 57% of Americans say that “government is almost always wasteful and inefficient,” while 39% say it “often does a better job than people give it credit for.” This balance of opinion is largely unchanged over the past decade.

Currently, three-quarters of Republicans fault the government for being wasteful and inefficient. That is little changed from recent years, but higher than the share of Republicans who described government as wasteful during George W. Bush’s administration. Republicans are now about as likely to criticize the government for being wasteful as they were in 1994, during Bill Clinton’s administration (75% now, 74% then).

Just 40% of Democrats view the government as wasteful and inefficient, which is in line with previous measures during Obama’s presidency. Democrats were more likely to say government was wasteful during the Bush administration. However, Democrats were less likely to view the government as wasteful during Bush’s presidency than Republicans have been during most of the Obama and Clinton administrations.

As with other questions about the government’s performance, there are internal ideological divisions within each party in views of government efficiency. Among Republicans and Republican-leaning independents, there is a 15-percentage-point gap between the proportion of conservatives (81%) and moderates and liberals (66%) who say the government is always wasteful and inefficient. And liberal Democrats (64%) are more likely than conservative and moderate Democrats (52%) to say the government does a better job than it gets credit for.

As a career, government viewed as more appealing than politics

Though many Americans express anger or frustration about the federal government, nearly half (48%) say if they had a son or daughter finishing school they would like to see them pursue a career in government.

Views of govt - 13

The share saying they would like a child to pursue a career in government is down 8 points since 2010, but careers in government continue to be seen as more appealing than careers in politics: Just 33% say they would like to see a child enter into politics as a career.

Since 1997, Democrats have viewed both political and governmental careers more favorably than Republicans. Though just 38% of Democrats and Democratic leaners would like to see a son or daughter pursue a career in politics, that number falls to 29% among Republicans and Republican leaners.

But partisans are further apart on views about a career in government. Today, a 58% majority of Democrats say they would like to see a child work in government, while just 38% of Republicans say this, a wider partisan divide on this question than in the past.

3. Views of government’s performance and role in specific areas

Amid a climate of deep distrust and frustration with government, the public’s ratings of the federal government’s performance in a range of areas stand out for being relatively positive. In 10 of the 13 areas tested in the survey, half or more say the federal government is doing a very good or somewhat good job.

Large majorities say the federal government is doing a very or somewhat good job responding to natural disasters (79%), setting fair and safe standards for workplaces (76%), keeping the country safe from terrorism (72%) and ensuring that food and medicine are safe (72%).

More also say the federal government is doing a good rather than a bad job protecting the environment (59% vs. 38%), ensuring access to health care (56% vs. 40%), maintaining roads, bridges and other infrastructure (52% vs. 46%) and ensuring access to high quality education (52% vs. 44%).

On the economy, evaluations are mixed: Slightly more say the federal government is doing a good (51%) than a bad (47%) job strengthening the economy. However, more emphatic ratings of government performance tilt negative: 22% say the federal government is doing a very bad job strengthening the economy, compared with just 9% who say they are doing a very good job.

The federal government receives low marks for its performance in two other key areas: managing the nation’s immigration system and helping people get out of poverty. Overall, 68% say that the government is doing either a very bad (38%) or somewhat bad (30%) job managing the nation’s immigration system; just 28% say it is doing a good job.

Ratings are nearly as negative when it comes to the job the government is doing to help people get out of poverty: 61% say the government is doing a bad job, compared with far fewer (36%) who say it is doing a good job.

Role and performance - 2

The survey also asks people about the role the federal government should play in these 13 areas. Overwhelming majorities say the government should have a role – either major or minor – in all 13. But there are clear differences in opinions about the extent of government involvement across these issues.

Americans are nearly unanimous in favoring a role for the federal government in keeping the country safe from terrorism: 94% say it should play a major role, while 5% say it should play a minor role.

Overwhelming majorities of more than 90% also say the federal government should play a major or minor role in other areas, including responding to natural disasters (98%), protecting the environment (96%), managing the immigration system (96%) and strengthening the economy (95%). For each of these areas, seven-in-ten or more say the federal government should play a “major” role, with far fewer saying it should play a “minor” role.

Yet there is less support for the federal government to have a large role in other areas – notably ensuring access to health care, helping people get out of poverty and advancing space exploration. About six-in-ten (61%) say the government should have a major role in ensuring access to health care; 38% say it should have a minor role and 10% want it to have no role at all.

Fewer (55%) want the government to have a major role in helping ameliorate poverty, and only about half (47%) want the government to play a major role in advancing space exploration. About one-in-ten (9%) say the government should have no role in advancing space exploration.

Role and performance - 3

On several issues, relatively high performance ratings correspond with broad majorities who say the government should play a major role in that same area. For example, 79% say the government is doing a good job responding to natural disasters and 88% say it should play a major role in this area. Keeping the country safe from terrorism and ensuring that food and medicine are safe are two other areas where large majorities say the government is doing well and should play a major role.

For most measures, however, performance ratings lag the share saying the government should play a major role. Majorities of about seven-in-ten or more want the government to have a major role in maintaining infrastructure (76%), protecting the environment (75%), strengthening the economy (74%), ensuring access to quality education (70%) and ensuring a basic income for those 65 and older (69%).

However, no more than about six-in-ten rate government performance positively in any of these areas (59% for protecting the environment). Only about half say the government is doing well in the other areas: infrastructure (52%), economy (51%), education (52%) and ensuring a basic income for older adults (48%).

The widest gap between public assessments of the federal government’s performance and role is seen on the issue of immigration. Just 28% say the federal government is doing a good job in managing the immigration system – more than twice as many (68%) say it is doing a bad job. Government involvement in immigration is widely seen as necessary. An 81% majority says the federal government should play a major role managing the nation’s immigration system.

Partisan gaps on performance and role of federal government

Role and performance - 4

There are significant differences in how Republicans and Republican leaners and Democrats and Democratic leaners rate the performance and role of the federal government. On some key issues, Republicans offer more negative performance ratings and see less of a role for government than Democrats. But these differences do not extend across all issues, and there are notable areas of partisan consensus.

When it comes to the performance of the federal government, partisans hold opposing views of how the government is doing in strengthening the economy and ensuring access to health care.

Nearly three-quarters of Democrats (74%) say the government is doing a very or somewhat good job ensuring access to health care. By contrast, Republicans are much more negative: Just 40% say the government is doing a good job.

A similar pattern is seen on the economy. Most Democrats and Democratic leaners say the federal government is doing a good job strengthening the economy (68%), but just 34% of Republicans and Republican leaners agree.

On the issue of defense from terrorism, there is a 25-percentage-point gap between the performance ratings Republicans and Democrats give the government. Nevertheless, majorities in both parties say the government is doing a good job: Among Democrats and Democratic leaners, 85% say the government is doing a good job keeping the country safe from terrorism, compared with a smaller 60%-majority of Republicans and Republican leaners.

Though Republicans hold particularly negative views, neither party thinks the government is doing a good job managing the nation’s immigration system. Just 15% of Republicans and leaners say the federal government is doing a very or somewhat good job managing the immigration system, compared with 40% of Democrats and leaners.

On other issue areas, there are only modest differences between how Democrats and Republicans rate federal government performance. For example, Republicans and Democrats are about equally likely to say the federal government is doing a good job ensuring that food and medicine are safe (73% each), setting fair and safe workplace standards (77% of Republicans vs. 79% of Democrats) and responding to natural disasters (78% vs. 82%).

There also are modest differences on performance ratings for some issues areas where partisans likely hold different policy preferences. For example, similar percentages of Republicans and Republican leaners and Democrats and Democratic leaners say the government is doing a good job protecting the environment (62% of Republicans vs. 58% of Democrats) and ensuring access to quality education (54% vs.52%).

Role and performance - 5

When it comes to the role of the federal government, there are large partisan differences in the share who think the federal government should play a “major role” across several high-profile issue areas, with Republicans more likely to see a limited role for government than Democrats. However, for all 13 areas tested, three-quarters or more of Republicans and Republican leaners say the federal government should have at least a minor role, with no more than 20% saying the federal government should play no role at all on any single issue.

Ensuring access to health care is the issue area with the largest partisan divide in the share saying the government should play a major role. Republicans and Republican leaners (34%) are 49 points less likely than Democrats and Democratic leaners (83%) to say the federal government should play a major role in this area. While just 34% of Republicans want government to play a major role, 45% say it should play a minor role; just 20% say it should play no role at all.

Helping people get out of poverty is another area where fewer than half of Republicans and leaners (36%) say the government should play a major role, compared with a far larger majority of Democrats and leaners (72%).

There are other large partisan differences over where the government should play a major role, on issues such as protecting the environment (31 points), ensuring access to quality education (29 points) and strengthening the economy (20 points); but on these issues, majorities of Republicans and Democrats alike see a major role for government, with the opinion gap reflecting how broadly the view is shared among the two groups.

There are several areas where Republicans and Democrats are unified in seeing a major role for the federal government. There is little to no disagreement between partisans that the federal government should play a major role keeping the country safe from terrorism, managing the immigration system and responding to natural disasters. Partisan opinion gaps also are relatively modest when it comes to the view that the government should play a major role keeping food and medicine safe and maintaining roads, bridges and other infrastructure.

Republicans’ views of government role and performance

Role and performance - 6

The widest gap among Republicans and Republican leaners in their views of government performance and role is seen on immigration. Just 15% of Republicans say the federal government is doing a good job managing the nation’s immigration system. Fully 85% say the government should play a major role in managing the nation’s immigration system.

A similar pattern is seen when it comes to keeping the country safe from terrorism, strengthening the economy and maintaining the country’s infrastructure. In all three areas, a sizable majority of Republicans say the government should play a major role, but far fewer say the government is currently doing a good job. For example, while 64% say the government should play a major role in strengthening the economy, just 34% give it good marks in this area.

The pattern is much different when it comes to the federal government helping people get out of poverty and ensuring access to health care. On these issues, low performance ratings correspond with small percentages of Republicans seeing a major role for the federal government. For example, just 30% of Republicans and leaners think the government is doing a good job helping people get out of poverty and a similarly small share (36%) think the government should play a major role in this area. In only one area, setting workplace standards, do a greater share of Republicans rate the government’s performance highly (77%) than say it should play a major role (54%).

Democratic views of government role and performance

Role and performance - 7

As with Republicans, Democratic views of government role and performance differ the most over the issue of immigration. Just four-in-ten Democrats and leaners say the federal government is doing a good job managing the nation’s immigration system, among the lowest performance ratings Democrats give the federal government in a policy area. Yet a wide 80% majority sees a major role for government in this area.

This pattern generally holds across the issues where Democratic ratings of government performance are relatively low or mixed. For example, fewer than half (42%) say the government is doing a good job helping people get out of poverty, but 72% say the government should play a major role in this area. Ensuring access to quality education and maintaining infrastructure are two other areas where Democratic evaluations of government performance are tepid but support for government playing a major role remains high.

Among Democrats, advancing space exploration stands out as the one issue for which there is not majority support for a major government role. Democratic performance ratings on this issue fall roughly in the middle of the 13 areas tested (58% say the federal government doing a good job); nonetheless, 50% say the government should play a major role, 22 points less than say the same about any other issue, and on par with Republican views.

Republican ideological divides on government role and performance

Among Republicans and Republican leaners, those who describe themselves as conservative are more critical of government performance than those who describe their political views as moderate or liberal.

Role and performance - 8

The largest ideological gap among Republicans is over the job the government is doing strengthening the economy. Overall, 46% of moderate and liberal Republicans and Republican leaners say the government is doing a good job strengthening the economy. By contrast, conservative Republicans and leaners are 20 points less likely to hold this view (26%).

Conservative Republicans are less likely than moderates to say the government is doing a good job on a range of other issues, including keeping the country safe from terrorism (15 points), helping people get out of poverty (9 points) and managing the nation’s immigration system (8 points). But on poverty and immigration, fewer than half of both groups say the government is doing a good job.

There are no issues for which moderate and liberal Republicans are more critical of government performance than conservatives. However, there are several issues for which there are hardly any ideological gaps among Republicans, including protecting the environment and ensuring safe food and medicine.

Role and performance - 9

With regard to views of the federal government’s role, across many issues, conservatives are less likely than moderates and liberals to say the government should play a major role. Though these ideological gaps over the government’s role do not always correspond to the differences in performance ratings

Nearly three-quarters (74%) of moderate and liberal Republicans say the federal government should play a major role protecting the environment, compared with about half (48%) of conservative Republicans and leaners. This 26-point gap is the widest seen across issues among Republicans, despite the absence of an ideological gap within the GOP over the government’s performance on the issue.

Ensuring access to quality education is another area where most moderate and liberal Republicans say the government should play a major role (66%), but no more than about half (49%) of conservatives say the same.

Conservative Republicans are at least 10 points less likely than liberals and moderates to see a major role for government helping people get out of poverty (31% vs. 45% among liberals, moderates) and ensuring access to health care (29% vs. 42%).

Managing the nation’s immigration system is the one issue for which a somewhat larger share of conservative Republicans and leaners (88%) than of moderates and liberals (81%) say the government should play a major – though this view is widely held among both groups.

Democratic ideological divides on government role and performance

Role and performance - 10

Among Democrats and Democratic leaners, liberals are more critical of government performance than moderates and conservatives on some issues central to the party, such as protecting the environment, ensuring access to education and helping people get out of poverty. On other key issues, such as strengthening the economy and managing immigration, there are no significant divides between the two groups.

Half of liberal Democrats and leaners (50%) say the federal government is doing a good job protecting the environment, compared with a majority (63%) of conservative and moderates who say the government is doing a good job.

Similarly, 46% of liberals rate the government positively for the job it is doing ensuring access to quality education, compared with a larger share of conservatives and moderates (56%) who think the government is doing a good job.

Among Democrats and leaners, neither group thinks the federal government is doing a particularly good job helping people get out of poverty, but liberals are somewhat more negative (36% good job) than are conservatives and moderates (45% good job).

Role and performance - 11

Seeing a major role for government across most issue areas is a defining view among Democrats and one that is held widely both by liberals and by conservatives and moderates in the party.

On ensuring access to health care and helping people get out of poverty, liberal Democrats and leaners (93%) are more likely than moderates and conservatives (77%) to say the federal government should play a major role; however, large majorities of both groups want major government involvement in these areas.

Across most other issues included in the survey, similar majorities of both liberal Democrats and conservatives and moderates say the federal government should play a major role. For example, 91% of liberals and 87% of conservatives and moderates say the federal government should play a major role in protecting the environment.

Advancing space exploration is one area where smaller shares of Democrats and leaners say the government should play a major role: 54% of liberals say this, as do 48% of conservatives and moderates.

4. Ratings of federal agencies, Congress and the Supreme Court

As in the past, the public expresses favorable opinions of a wide range of federal agencies and departments, but there are some notable exceptions. Currently, majorities give favorable assessments of 13 of the 17 agencies and departments tested; by contrast, fewer than half express favorable opinions of the Justice Department, the Department of Education, the IRS and the Department of Veterans Affairs (VA).

Congress remains very unpopular with the public: Just 27% of the public views Congress favorably, while 69% have an unfavorable opinion. Favorable opinions of Congress have not surpassed 30% in more than four years.

Opinions of the Supreme Court have changed little since July, when negative opinions of the court reached a 30-year high. Currently, 50% view the court favorably, while 42% express an unfavorable opinion.

Among the government agencies and departments included in the survey, the U.S. Postal Service is viewed most favorably; fully 84% have a favorable opinion of the Postal Service, while just 14% have an unfavorable view.

Two-thirds or more also have favorable impressions of the National Park Service (75%), the Centers for Disease Control and Prevention, or CDC (71%), NASA (70%) and the FBI (68%). No more than about one-in-five express negative views of any of these agencies.

By about two-to-one, the public also has favorable views of the Department of Homeland Security (64% vs. 30% unfavorable), the Defense Department (63% vs. 29%) and the CIA (57% vs. 27%). The National Security Agency is viewed less positively – about half (52%) have a favorable impression of the NSA, while 31% view it unfavorably.

Of the 17 agencies and departments in the survey, the Department of Justice (46%), the Department of Education (44%), the IRS (42%) and the VA (39%) receive among the lowest favorability ratings. Roughly half have unfavorable impressions of all four organizations.

Agencies - 2

In general, the federal government continues to be viewed less favorably than state and local governments. Currently 32% say they have a favorable impression of the federal government, while nearly twice as many (63%) view it unfavorably. By contrast, majorities say they have favorable opinions of their own state government (56%) and their local government (65%). These attitudes have changed little in recent years. The last time the federal government was viewed as favorably as state and local governments was in the period after the 9/11 terrorist attacks and during the early phase of the Iraq War.

As with other attitudes toward the federal government, there continue to be deep partisan differences in favorability: 45% of Democrats and Democratic leaners have a favorable view of the federal government, compared with 18% of Republicans and Republican leaners.

But there are virtually no partisan differences in the public’s assessments of local and state governments. More than half of Republicans and Republican leaners (57%) and Democrats and Democratic leaners (59%) say they view their state governments favorably, while even larger majorities of both partisan groups say they view their local governments favorably (64% among Republicans and Republican leaners, 69% among Democrats and Democratic leaners).

VA’s problems take a toll on its image

Agencies - 3

Favorable ratings for the IRS have changed little in recent years. But the VA’s favorability has plummeted over the past two years, while several other agencies – including the Justice Department, Food and Drug Administration (FDA), Environmental Protection Agency (EPA), Defense Department and Department of Education – also are viewed less positively.

Currently, just 39% view the VA favorably – a decline of 29 percentage points since October 2013, during the partial government shutdown. The VA has faced intense criticism over problems with its health care services for veterans, and last year Gen. Eric Shinseki, the agency’s embattled secretary, resigned under pressure.

The Justice Department is viewed less favorably than it was during the 2013 government shutdown: 64% now view the department favorably, down 15 points from two years ago. However, the current measure is comparable to the department’s favorable rating in 2010 (51%). Favorable ratings for the FDA (down 14 points), EPA (10 points), Defense Department and Department of Education (9 points each) also have declined significantly since October 2013.

Partisan differences in views of federal departments and agencies

Agencies - 4

There are substantial partisan gaps in the views of several federal departments and agencies. Roughly two-thirds of Democrats and Democratic leaners have favorable impressions of the Department of Health and Human Services, or HHS (68%), and the EPA (67%). Only about four-in-ten Republicans and Republican leaners view these agencies favorably (both 39%).

And more than twice as many Democrats (58%) as Republicans (24%) have a favorable opinion of the IRS.

Democrats also view several other departments and agencies more favorably – including the Department of Education (51% of Democrats vs. 36% of Republicans), the FDA (59% vs. 46%), the Social Security Administration (62% vs. 50%) and the Department of Homeland Security (70% vs. 59%).

Members of both parties view the Justice Department less favorably than in 2013: 36% of Republicans and Republican leaners currently view the department favorably, down from 50% two years ago. Among Democrats and Democratic leaners, the decline has been comparable (to 58% from 71%).

Agencies - 5

The shift in Republicans’ views has come almost entirely among conservative Republicans. Just 28% now view the Justice Department favorably, down 21 percentage points from October 2013. By contrast, about half of moderate and liberal Republicans (52%) have a favorable impression of the department, about the same as did so two years ago (54%). Among Democrats, the decline in favorable opinions has come among both liberals (14 points) and the party’s conservatives and moderates (9 points).

Notably, the steep decline in the VA’s favorability ratings has come across the partisan and ideological spectrum. Today, just 41% of Democrats and 34% of Republicans view the VA favorably, down 29 points and 34 points, respectively, since October 2013.

Views of Congress and the Supreme Court

Agencies - 6
Agencies - 7

Opinions about Congress remain overwhelmingly negative. Just 27% have a favorable opinion of Congress, while 69% have an unfavorable view. Views of Congress have changed little over the past four years. (This question was asked in late September, as John Boehner announced he was resigning as House speaker. Rep. Paul Ryan was elected speaker Oct. 29.)

Despite Republicans controlling both the House of Representatives and Senate, just 23% of Republicans and Republican leaners view Congress favorably, compared with 31% of Democrats and Democratic leaners.  This marks the first time – in data reaching back about two decades – that members of the party with a majority in both houses of Congress have expressed less favorable views of the institution than members of the minority party.

Agencies - 8
Agencies - 9


In July, unfavorable opinions of the Supreme Court reached a 30-year high of 43%, following the court’s contentious, end of-term rulings on the Affordable Care Act and same-sex marriage. Since then, opinions about the court are largely unchanged: 50% view the court favorably, while 42% view it unfavorably.

Just 38% of Republicans and Republican leaners view the Supreme Court favorably, up slightly from an all-time low of 33% in July. By contrast, 64% of Democrats and Democratic leaners have a favorable impression of the high court, little changed from July (61%).

5. Political engagement and views of government

As has been the case throughout the Obama presidency, Republicans hold considerably more critical views of government than Democrats across multiple measures. Today, 32% of Republicans and Republican leaners say they are angry with government; just 12% of Democrats and Democratic leaners say the same. And while three-quarters (75%) of Republicans say the federal government needs major reform, a much smaller share (44%) of Democrats say this.

Similarly, on a core question about government performance, a 57% majority of Democrats say “government often does a better job than people give it credit for,” while 40% say it is “almost always wasteful and inefficient.” In contrast, Republicans say the government is wasteful by about three-to-one (75% vs. 22%).

Partisan divides over government more pronounced among politically engaged

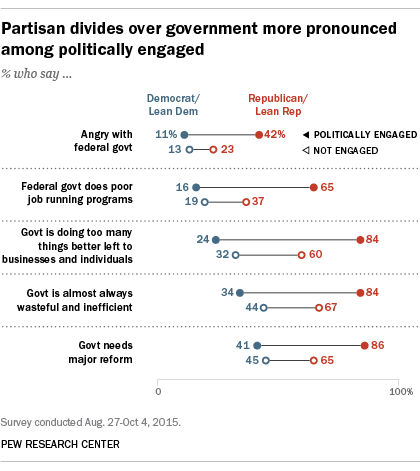
But these partisan divides over government, already wide, are particularly stark among those who are most politically engaged.

Across the board, politically engaged Republicans and Republican leaners – the nearly half (48%) of Republicans who are registered to vote, do so regularly and say they follow politics most of the time — are far more critical of the government than are less politically engaged Republicans.

The differences between politically engaged Democrats and those who are less engaged are not as pronounced. However, in several cases politically engaged Democrats and leaners (who make up 34% of all Democrats and Democratic leaners) are more positive about government than others in their party.

Fully 42% of politically engaged Republicans say they are angry with government (compared with 23% of the less engaged). And though about two-thirds (65%) of engaged Republicans say the government does a poor job running its programs, only about half as many (37%) less-engaged Republicans say this (a 46% plurality of the less-engaged rate the government’s performance as “only fair”).

Similarly, though majorities of both engaged and less-engaged Republicans say the government is wasteful and inefficient (84% and 67%, respectively) and that it does “too many things better left to businesses and individuals” (84% and 60%, respectively), these views are more widely held among politically engaged Republicans than less-engaged Republicans

By contrast, while only 24% of politically engaged Democrats say government is “doing too many things better left to businesses and individuals,” a slightly larger minority (32%) of less-engaged Democrats say this. But on many measures there are, at most, modest differences between these two groups. For instance, just 11% of engaged Democrats, along with 13% of less-engaged Democrats, say they are angry with government.

The end result is that partisan cleavages over government are even more pronounced among those who are the most likely to participate in the political process, echoing a growing link between engagement and broader ideological polarization. 

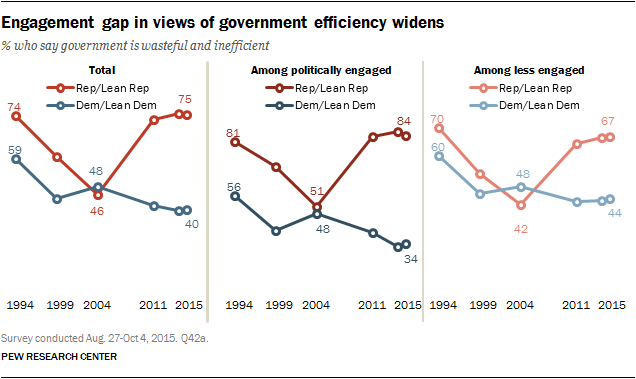
Engagement gap in views of government efficiency widens

This dynamic is not new – engaged Republicans have consistently been more critical of government than other Republicans – but it is as pronounced as ever. On the question of whether government is wasteful and inefficient or does a better job than people give it credit for, there is now a 50-percentage-point partisan gap among engaged partisans, compared with a 23-point gap between less-engaged Democrats and Republicans.

Politically engaged also divided over role and performance of government

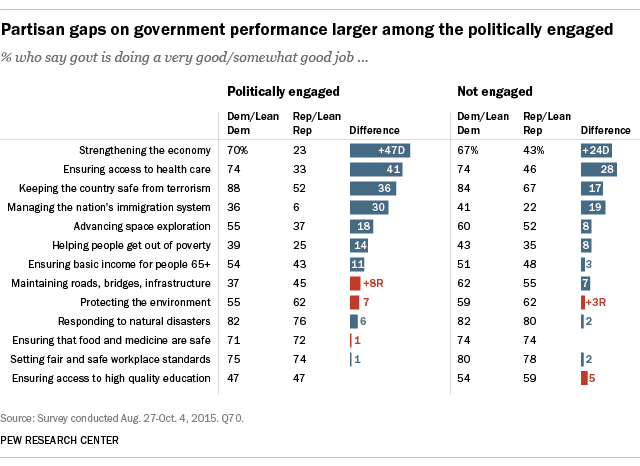
In several opinions about the role and performance of government, the divisions between politically engaged Republicans and Democrats are substantial – and dwarf the differences among less-engaged partisans. In most cases, this larger gap is the result of far more negative evaluations of government’s performance among engaged Republicans than less-engaged Republicans, with little difference in ratings between engaged Democrats and less-engaged Democrats.

For example, while 70% of politically engaged Democrats say the government is doing a good job strengthening the economy, just 23% of engaged Republicans say this, a 47-point gap. Among those who are less engaged, that gap narrows to 24 points, largely the result of more positive assessments of government performance on this dimension among less-engaged Republicans.

Partisan gaps on government performance larger among the politically engaged

Similar patterns are at work when it comes to government’s performance on health care and terrorism. This is also seen, to a lesser extent, on views of the government’s handling of immigration, space exploration, poverty and ensuring a basic income for older Americans.

Notably, ratings of the government’s performance maintaining roads, bridges and other infrastructure follows a very different pattern, a result of much lower ratings of government performance among the politically engaged in both parties – particularly Democrats.

But the extent to which engaged partisans are more divided than those who are less engaged is even more apparent when it comes to the role the government should play in each of these 13 areas. In five of the 13 areas asked about in the survey, there are gaps of 40 percentage points or more between engaged Democrats and engaged Republicans.

By comparison, the largest gap between less-engaged partisans is a 32-point gap over ensuring access to health care (79% of less-engaged Democrats say the government should play a major role, while 47% of less-engaged Republicans say this). On this same issue, there is a 69-point partisan gap among the politically engaged: 90% of engaged Democrats vs. just 21% of engaged Republicans see a major role for government in health care.

Partisan gaps on the role of government larger among the politically engaged

Education, the environment and workplace standards also stand out as areas on which majorities of both Democrats and Republicans generally see a major role for government, but this is not the case among politically engaged partisans. For example, just 38% of engaged Republicans say government should play a major role in ensuring access to high-quality education (in contrast to 68% of less-engaged Republicans and more than 80% of both engaged and less-engaged Democrats). Similarly, 68% of less-engaged Republicans say government should play a major role in protecting the environment, compared with 47% among politically engaged Republicans.

However, on several key areas of government activity, there is broad agreement even among engaged partisans that government should play a major role: Two-thirds or more of Republicans and Democrats, engaged and less-engaged alike, say government should play a major role in keeping the country safe from terrorism, managing the immigration system, responding to natural disasters, ensuring the safety of food and medicine and maintaining the nation’s infrastructure.

6. Perceptions of elected officials and the role of money in politics

A major factor in the public’s negative attitudes about the federal government is its deep skepticism of elected officials. Unlike opinions about government performance and power, Republicans and Democrats generally concur in their criticisms of elected officials.

Asked to name the biggest problem with government today, many cite Congress, politics, or a sense of corruption or undue outside influence. At the same time, large majorities of the public view elected officials as out of touch, self-interested, dishonest and selfish. And a 55% majority now say that ordinary Americans would do a better job at solving the nation’s problems than their elected representatives.

The 2016 campaign is on pace to break records for campaign spending. A large majority of Americans (76%) – including identical shares of Republicans and Democrats – say money has a greater role on politics than in the past. Moreover, large majorities of both Democrats (84%) and Republicans (72%) favor limiting the amount of money individuals and organizations can spend on campaigns and issues.

Few say elected officials put the country’s interests before their own

Just 19% say elected officials in Washington try hard to stay in touch with voters back home; 77% say elected officials lose touch with the people quickly.

A similar 74% say most elected officials “don’t care what people like me think”; just 23% say elected officials care what they think.

Elected officials widely viewed as out-of-touch, self-interested

The public also casts doubt on the commitment of elected officials to put the country’s interests ahead of their own. Roughly three-quarters (74%) say elected officials put their own interests ahead of the country’s, while just 22% say elected officials put the interests of the country first.

These views are widely held across the political spectrum, though conservative Republicans and Republican leaners are particularly likely to say elected officials are self-interested: 82% say this, compared with 71% of moderate and liberal Republicans, and similar proportions of conservative and moderate (69%) and liberal (73%) Democrats.

Growing share say elected officials don't care about people like them

Negative views of politicians on these measures are nothing new, though the sense that politicians don’t care what people think is more widely held in recent years: Today, 74% say this, up from 69% in 2011, 62% in 2003, and a narrower 55% majority in 2000.

Majorities across party lines say politicians don’t care much about what they think, though as has been the case since 2011, more Republicans than Democrats currently say this (78% vs. 69%). In 2004, when both the presidency and Congress were held by the GOP, Democrats (71%) were more likely than Republicans (54%) to say elected officials in Washington didn’t care much about them. Throughout much of the late 1990s, there were no significant partisan differences in these views.

Top problems of elected officials

What is the biggest problem with elected officials in Washington?

When asked to name in their own words the biggest problem they see with elected officials in Washington, many Americans volunteer issues with their integrity and honesty, or mention concerns about how they represent their constituents.

The influence of special interest money on elected officials tops the list of named problems; 16% say this. Another 11% see elected officials as dishonest or as liars. These concerns are named by similar proportions of Republicans and Democrats.

One-in-ten respondents (10%) say elected officials are out of touch with Americans, and another 10% say they only care about their political careers. Republicans and Republican-leaning independents are slightly more likely than Democrats to name these as problems.

In contrast, Democrats are twice as likely as Republicans to volunteer that the biggest problem with elected officials is that they are not willing to compromise (14% vs. 7%).

Elected officials seen as ‘intelligent,’ not ‘honest’

To the general public, elected officials in Washington are not much different from the typical American when it comes to their intelligence or their work ethic, but they are viewed as considerably less honest, somewhat less patriotic and somewhat more selfish.

Elected officials viewed as less honest, more selfish than typical American or business leaders

Two-thirds (67%) say that “intelligent” describes elected officials at least fairly well, the same share that says this about the typical American. Business leaders, by comparison, are seen as more intelligent (83% say this describes them at least fairly well).

About half of Americans say elected officials (48%) and average Americans (50%) are lazy; just 29% say this about business leaders.

But assessments of elected officials’ honesty are far more negative. Just 29% say that “honest” describes elected officials at least fairly well, while 69% say “honest” does not describe elected officials well. Business leaders are viewed more positively: 45% say they are honest. And nearly seven-in-ten (69%) consider the typical American honest.

About six-in-ten (63%) view elected officials as patriotic, a larger share than says this about business leaders (55%). Still, far more (79%) view ordinary Americans as patriotic than say this about elected officials.

And the public overwhelmingly thinks of elected officials as selfish: 72% say this describes them at least fairly well, including 41% who say this trait describes them “very well.” Though similar shares say the term “selfish” applies at least fairly well to both business leaders (67%) and the typical American (68%), fewer say it describes those groups very well.

Majorities of Republicans and Republican-leaning independents, and Democrats and Democratic-leaning independents, see elected officials as intelligent, patriotic and selfish, though there are modest differences in the ratings of elected officials across party lines.

Only about a third of Democrats (34%) and even fewer Republicans (25%) say “honest” describes elected officials. Similarly modest gaps are seen on other traits, with Democrats consistently viewing elected officials more positively (and less negatively) than Republicans.

Modest partisan differences in views of elected officials

There are few differences between Democrats and Republicans on views of the typical American. Majorities in both parties rate the typical American as intelligent, honest and patriotic, albeit selfish.

Republicans express more positive views of business leaders than do Democrats. More Republicans than Democrats say “patriotic” describes business leaders very or fairly well (66% vs. 48%). And while Democrats rate elected officials and business leaders similarly on honesty (respectively, 34% and 39% say each is honest), Republicans are twice as likely to call business leaders honest than to say this about elected officials (55% vs. 25%).

Views of elected officials and views of government

Strong link between trust in government and views of elected officials

Just 12% of Americans have attitudes across a variety of measures that suggest they view elected officials positively (tending to rate elected officials as honest, intelligent, in touch with and concerned about average Americans, and putting the country’s interest above their own self-interest), while 57% largely view elected officials negatively (tending to take the opposing view on these measures); about three-in-ten (31%) hold about an equal mix of positive and negative views of politicians.

These views of elected officials are strongly correlated with overall attitudes about government. Among those with positive views of politicians, 53% say they trust government all or most of the time; among those with negative views, just 7% do. And while 42% of those with positive views say they are “basically content” with the federal government and just 4% express anger, just 9% of those with negative views of elected officials say they are content and fully 29% express anger.

Compromising with the other party

The public is also divided over the extent to which elected officials should make compromises with people with whom they disagree. While 49% of the public say they like elected officials who compromise, 47% say they prefer those who stick to their positions.

Republicans, Democrats continue to differ over political compromise

Among partisans and leaning independents, though, there is a clearer preference. Nearly six-in-ten Republicans and Republican leaners (59%) like elected officials who stick to their positions. The preference is especially strong among conservative Republicans, 65% of whom say this.

In contrast, 60% of Democrats and Democratic leaners prefer elected officials who make compromises over those who stick to their positions. Two-thirds of liberal Democrats (67%) agree. This ideological divide over compromise in principle is little different today from in recent years.

More people blame lawmakers than the political system

Most say political system works fine, members of Congress are the problem

As was the case five years ago, more Americans blame problems with Congress on the members themselves, not a broken political system. Overall, 53% say the political system works just fine, and that elected officials are the root of the problems in Congress; 37% say most members of Congress have good intentions, and it’s the political system that is broken (37%).

There are only modest partisan or demographic differences on this question, though moderate and liberal Republicans and leaners are somewhat more likely than other partisan and ideological groups to say problems are systemic (47% say this, compared with no more than 38% of those in other ideological groups).

Views of the role of money in politics

The vast sums of money flowing into the 2016 presidential election have once again brought attention to the issue of campaign finance.

This issue resonates broadly with the public: 77% of Americans say there should be limits on the amount of money individuals and organizations can spend on political campaigns and issues. Just 20% say that individuals and organizations should be able to spend freely on campaigns.

Broad support for limits on campaign spending

The perception that the influence of money on politics is greater today than in the past is also widely shared. Roughly three-quarters of the public (76%) believe this is the case, while about a quarter (22%) says that money’s influence on politics and elected officials is little different today than in the past.

And as the presidential campaign continues, nearly two-thirds of Americans (64%) say that the high cost of running a presidential campaign discourages many good candidates from running. Only about three-in-ten (31%) are confident that good candidates can raise whatever money they need.

Broad concerns about money in politics – and the specific worry that costly campaigns discourage worthy candidates – are not new. In a January 1988 face-to-face survey, 64% said the high cost of campaigns acts as a barrier to many good candidates.

Most Americans, including majorities in both parties, believe that new laws would be effective in reducing the role of money in politics. Roughly six-in-ten overall (62%) say that new laws would be effective in limiting the role of money in politics; 35% say new laws would not be effective in achieving this goal.

Bipartisan support for limiting campaign spending

Opinions on campaign finance and its effects on the political system are widely shared; majorities across demographic and partisan groups say there should be limits on campaign spending, that money’s impact on politics has increased and that the high cost of campaigns is driving away good candidates.

Concern about money's influence on politics crosses partisan lines

Partisan differences on all three measures are modest. Republicans and Republican-leaning independents (72%) are less likely than Democrats and Democratic-leaning independents (84%) to say that there should be limits on campaign spending. However, support for spending limits is high even among conservative Republicans and leaners –roughly two-thirds (68%) think there should be limits on how much individuals and organizations can spend.

Democrats and leaners are somewhat more likely to say that the high cost of campaigns today discourages good candidates: 68% say this compared with 62% of Republicans and leaners.

Widespread belief that new laws would curb role of money in politics

While most Americans believe that new laws would be effective in reducing the role of money in politics, there are educational and partisan differences in how widely these views are held.

Fully three-quarters of those with post-graduate degrees say new laws would be effective in this regard, compared with 57% of those with no more than a high school education.

More Democrats and leaners (71%) than Republicans and leaners (58%) say that new laws would be effective in limiting the influence of money in politics. Nonetheless, majorities across all educational and partisan categories say that new laws could be written that would effectively reduce the role of money in politics.

7. Views of the political parties and how they manage government

The public continues to view the Democratic Party more favorably than the Republican Party. But neither party has a significant advantage when it comes to opinions about which could better manage the federal government.

Democratic Party viewed more favorably than GOP

In addition, both parties are criticized for how they deal with the size and scope of government. Nearly six-in-ten (59%) say the Republican Party is too willing to cut government programs even when they work. An identical percentage says the Democratic Party too often sees government as the only way to solve problems.

The favorable rating for the Democratic Party has changed little since the start of the year: Currently, 45% view the Democratic Party favorably, while 50% view it unfavorably. Meanwhile, the GOP’s image has improved somewhat since July, when just 32% viewed the party favorably – among the lowest favorability ratings in two decades of polling. Still, in the current survey, just 37% view the Republican Party favorably, while 58% view it unfavorably. 

Growing share has unfavorable view of both parties

The percentage saying they have unfavorable views of both parties has been growing in recent years. Fully 24% now say they have unfavorable views of both parties, up from 12% in 2008 and just 6% in 2002.

Most of the growth in unfavorable opinions of both parties has come among Republicans and Republican-leaning independents, and among the 13% of the public that does not lean to either political party.

More non-leaning independents view both parties unfavorably

About a quarter of Republicans and Republican leaners (27%) say they have an unfavorable opinion of both parties. That is down slightly from July (32%) but one of the highest percentages since 1992. By comparison, just 16% of Democrats and Democratic leaners have a negative opinion of both parties.

Independents without partisan leanings are the group most likely to have negative views of both parties. Close to half (46%) of non-leaning independents now say they have an unfavorable view of both the Republican and Democratic parties. That is almost double the percentage who said this in 2008 (25%).

Republicans and Republican leaners make up biggest share of those who view both parties unfavorably

Nonetheless, Republicans and Republican leaners make up the largest share of those who view both parties unfavorably. Close to half (45%) of those who have unfavorable views of both parties are Republicans or Republican leaners; 30% are Democrats or Democratic leaners, while 25% are independents who do not lean toward either party.

Predictably, those who have a favorable view of one party and an unfavorable one of the other are overwhelmingly partisans and partisan leaners. Among the small share of the public (11%) that sees both parties favorably, Democrats make up the largest share (48%).

Views of the parties’ approaches to government

The public has similar views of each party’s ability to manage the federal government. About half (52%) say the Democratic Party can do a good job managing the federal government, while 44% say it cannot. A comparable percentage (49%) says the Republican Party can do a good job of managing the government, while 45% disagree.  

Both parties receive criticism for approaches to government

As in the past, more Americans view the Republican Party as “too extreme” (54%) than say that description applies to the Democratic Party (39%).

The survey also asks about specific criticisms of the parties’ approaches to governing. A majority (59%) says that the Democratic Party “too often sees government as the only way to solve problems,” while an identical percentage says that the Republican Party “is too willing to cut government programs, even when they work.”

As might be expected, Republicans and Democrats in large numbers give their own party positive ratings for dealing with the federal government.

Partisans rate their own party - and the opposition - on managing the government

Most Democrats and Democratic leaners (83%) say the Democratic Party can do a good job managing the government, compared with just 30% who say the Republican Party could do a good job. Among Republicans, 75% say their own party could manage the government effectively, while just 18% say the same about the Democratic Party.

However, Republicans are more likely to view the GOP as “too extreme” than Democrats are to say the same about their own party. A quarter of Republicans say the GOP is too extreme; 14% of Democrats say the same of their party.

When asked if the Democratic Party too often sees government as the solution to problems, 43% of Democrats and Democratic leaners say this is the case. When asked to judge whether the GOP is too quick to cut working programs, a somewhat smaller share of Republicans and Republican leaners (34%) say this is true of their party.

To be sure, much larger proportions of Republicans and Democrats are critical of the other party in assessing these characteristics. About seven-in-ten Republicans (69%) say that the Democratic Party is too extreme and an overwhelming majority of Democrats say that the GOP is too extreme (81%). Similarly, about eight-in-ten Republicans (79%) say that the Democratic Party too often relies on government solutions, while 82% of Democrats say that the Republican Party is too quick to cut effective programs.

For their part, independents who do not lean to either party offer similar assessments of the Republican and Democratic parties on all of the items tested. On the critiques of each party’s approach to government, for instance, non-leaning independents are as likely to say that the GOP is too quick to cut effective government programs as they are to say that the Democratic Party is too reliant on government to solve problems (51% each).

Among the 22% of the public that is angry with the federal government – a largely Republican group – 44% say, in effect, that only the GOP can do well in managing the government; they say the Republicans can do well and the Democrats cannot. Yet nearly a third of those angry at government (31%) say neither party can do well in managing the federal government. Relatively few say the Democratic Party, but not the Republican Party, can do a good job managing the government (16%).

Who can govern well? Those angry at government prefer the Republican Party, but many say 'neither'

Among the majority of the public (57%) that is frustrated with government, there is no clear preference about which party can do better in management. Among those who are “basically content” with the government (18% of the public), 44% say the Democratic Party, but not the Republicans, can do well in managing the government, while 36% say both parties can do a good job and just 11% say the Republican Party, but not the Democratic Party, can do a good job running the government.

Differences between the two major parties

Growing number sees 'great deal' of difference between the political parties

The share of Americans who say there are major differences between the political parties, while little changed from early last year, remains as high as it has ever been.

Currently, 45% say there is “a great deal” of difference in what the parties stand for; 32% say there is a “fair amount” of difference and 19% say there is “hardly any difference” between the Republican and Democratic parties. The share saying there are wide differences between the parties is as high as it has been in the past three decades.

More liberal Dems, conservative Reps see big differences between the parties

Conservative Republicans and Republican leaners (51%) are more likely than the party’s moderates and liberals (40%) to see a great deal of difference between the parties. Among Democrats and Democratic leaners, 52% of liberals say there are big differences between the parties, compared with 44% of moderate and conservative Democrats.

Among independents who do not lean to a party, just 31% say there are big differences between the parties; nearly as many (33%) say there are hardly any differences.

Overall, a majority (56%) of politically engaged adults say there are substantial differences between the parties, compared with 38% of those who are less politically engaged.


Most see a politically divided nation

An overwhelming majority of Americans say that the country is now more politically divided than in the past – and few expect these divisions to go away anytime soon.

Public sees wider political divisions, most expect rift to continue

Currently, 79% view the country as more politically divided, little different from surveys in 2013 (81%) and 2012 (80%), but as high as at any point since the question was first asked more than 10 years ago. In January 2009, shortly before Barack Obama took office, just 46% said the country was more politically divided than it had been in the past.

When asked to look five years ahead, 78% say that either the country will be just as politically divided as it is now (42%), or more divided (36%).

There is broad agreement across partisan and demographic groups that the country is more politically divided, and that these divisions will persist – or deepen – over the next five years.

Comparable percentages of Republicans and Republican leaners (82%) and Democrats and Democratic leaners (78%) say that the country is more politically divided than in the past. A slightly smaller share of those who do not lean toward either party (72%) say the same.

8. Perceptions of the public’s voice in government and politics

Though the public is unhappy with government generally, Americans are largely divided on key measures of their ability to influence how it runs, including the impact of voting on government and the ability of motivated individuals to influence the way government works.

Views on the impact of voting and people's ability to influence the government

When asked which statement comes closer to their own views, most Americans (58%) say that “voting gives people like me some say about how government runs things,” while fewer (39%) say “voting by people like me doesn’t really affect how government runs things.”

The public is somewhat more skeptical when it comes to the ability of ordinary citizens to influence the government in Washington. Half (50%) say ordinary citizens can do a lot to influence the government in Washington, if they are willing to make the effort, while about as many (47%) say there’s not much ordinary citizens can do to influence the government.

Can ordinary people have an impact?

Majorities of Democrats and Democratic leaners as well as of Republicans and Republican leaners say that voting gives people some say in government, though this view is somewhat more widely held among Democrats (63%) than Republicans (56%).

Those with more education are more likely to say voting gives them a voice in government

Democrats are similarly more likely than Republicans to say ordinary citizens can influence the government in Washington: 55% of Democrats say ordinary citizens can make an impact, while 42% say there is not much ordinary people can do. About as many Republicans and leaners say ordinary citizens can influence the government in Washington (47%) as say there’s not much ordinary citizens can do (51%).

Among the 13% of the public that does not identify or lean toward either party – a group that is far less likely to be registered to vote – just 44% say voting gives people some say in how government runs things, while 49% say it doesn’t really affect how government runs things.

Seven-in-ten of those with a post-graduate degree (70%) and 65% of those with a college degree say voting gives people some say in government; somewhat smaller shares of those with only some college experience (58%) or those with no more than a high school diploma (51%) say the same.

Unlike views on voting, there are no educational differences in the shares saying ordinary people can influence government if they make the effort.

Scale of political efficacy

Blacks (58%) and Hispanics (57%) are more likely than whites (47%) to say that ordinary citizens can influence the government in Washington, if they’re willing to make the effort. There are no racial differences in views of the impact of voting.

These two measures of opinion on the impact of voting and on ordinary citizens’ ability to influence the government in Washington can be combined to create a scale of political efficacy. Those who rank “high” on the scale say both that voting gives people some say in how government runs things and that ordinary citizens can do a lot to influence the government in Washington, if they are willing to make the effort. “Medium” political efficacy includes those who hold only one of the two views, while “low” political efficacy describes those who do not hold either view.

Overall, 39% of the public falls into the high political efficacy category, while 33% have medium political efficacy and 28% have low political efficacy.

Political efficacy is higher among those with more education. For example, 47% of those with a post-graduate degree rank high on the scale of political efficacy, compared with 33% of those with no more than a high school diploma.

Across political groups, Democrats and leaners are somewhat more likely to have high political efficacy (44%) than Republicans and Republican leaners (36%)

And high political efficacy is somewhat more widespread among the politically engaged (registered voters who vote regularly and follow news about government) than among the less engaged (43% vs. 36%).

Having high political efficacy – the feeling that voting and individuals can influence government – is associated with more positive views of government across realms.

While trust in government is low across all groups, those with high political efficacy (27%) are more likely than those with medium (17%) or low (10%) levels of efficacy to say they trust the government to do what’s right always or most of the time.

Similarly, just 16% of those with high political efficacy are angry with government, compared with 22% of those with medium political efficacy and 30% of those with low levels of efficacy.

On other overall assessments of government, those with high political efficacy stand out for holding the least negative views. For example, among those with high political efficacy, as many say the government often does a better job than people give it credit for (48%) as say it is almost always wasteful and inefficient (48%). Among those with lower levels of political efficacy, more describe the government as almost always wasteful and inefficient (60% of those with medium political efficacy and 67% of those with low efficacy).

When it comes to the amount of reform the federal government needs, those with high levels of political efficacy (48%) are much less likely than those with medium (59%) or low (74%) efficacy to say the government is in need of very major reform. As many as 48% of those with high political efficacy say the federal government is basically sound and needs only some reform.

Levels of political efficacy also are tied to views of elected officials. While the public is broadly critical of elected officials on several key character traits, those with high levels of political efficacy hold the least-negative views. For example, those with high political efficacy are 19 percentage points more likely than those with low political efficacy to say that elected officials are honest; nonetheless, just 36% of those with high political efficacy say the term honest describes elected officials.

A similar pattern is evident within partisan groups: Among Republicans and Republican leaners, as well as Democrats and Democratic leaners, those with a higher sense of political efficacy tend to be less critical of government and elected officials, though in many cases views remain quite negative.

Those with higher levels of political efficacy hold more positive views of govt

Public’s assessment of country’s problems, own ability to address them

Amid high frustration with the government, most Americans see the challenges facing the country as difficult to solve, but most also say that ordinary Americans would do a better job solving the country’s problems than elected officials.

How difficult are the problems facing the country today and could public do better job than elected officials?

Overall, 56% say that most big issues facing the country today do not have clear solutions; 41% say there are clear solutions to most big issues facing the country today.

At the same time, 55% think that ordinary Americans would do a better job solving the country’s problems than elected officials, while 39% say they would do no better than those currently in elected office.

The public’s view that ordinary Americans would do a better job than elected officials likely reflects the low regard in which officials are held and is not entirely an endorsement of the public’s competency. A separate measure included in the survey finds that just 34% say they have either a very great deal or good deal of confidence in the wisdom of the American people when it comes to making political decisions, significantly lower than in 2007 (57%) and 1997 (64%).

Among the 41% of the public who say there are clear solutions to the big issues facing the country, fully 63% say they think ordinary Americans would do a better job than elected officials solving the country’s problems. By comparison, about half (49%) of those who say there are not clear solutions to the county’s problems think regular Americans could do a better job than elected officials.

Across most demographic and political groups, majorities reject the view that the country’s problems have easy solutions.

Majority says solutions to major problems facing U.S. are not clear

Just 38% of Democrats and leaners say there are clear solutions to most big issues; 60% say there are not. Republicans and leaners are somewhat more likely to see clear solutions (46% say there are, 52% say there are not).

Politically engaged Republicans are one of the few groups in which a majority says the country’s problems have clear solutions (56% vs. 43%). As a result, the partisan difference on this question is significantly larger among the politically engaged public (17 points, compared with 8 points overall).

By a 60%-36% margin, women say most big issues facing the country today do not have clear solutions. Among men, opinions are more divided: 51% say most issues do not have clear solutions, while 47% say they do.

There are only modest differences on this question across levels of educational attainment, with narrow majorities of all groups saying there are not clear solutions to the country’s top problems.

By nearly two-to-one, more Republicans and GOP leaners say that ordinary Americans would do a better job than elected officials solving the country’s problems (62%) than say ordinary people would not do a better job (32%). Democrats have less confidence that the public would have more success than politicians: 49% of Democrats and leaners say ordinary Americans would do better, while nearly as many (45%) say they would not.

The view that ordinary people could do a better job is particularly prevalent among politically engaged Republicans: Nearly seven-in-ten (68%) say this. Views among engaged Democrats and leaners on this question (48% better job) are little different from those of less-engaged Democrats.

Most Republicans think ordinary people would do better than politicians

Those with higher levels of education are more skeptical that ordinary Americans would do a better job solving the country’s problems than elected officials: Among those with a post-graduate degree, 45% say the public would do better than politicians, while 49% say they would not. Those with a college degree are slightly more likely to say ordinary Americans would do better than elected officials (50% vs. 44%). Clear majorities of those with only some college experience (55%-38%) and those with no more than a high school diploma (58%-36%) say ordinary Americans would do a better job solving the country’s problems than elected officials.

Among adults under age 30, about as many say ordinary Americans would do a better job than elected officials (49%) as say they would not (47%). Among those in older age cohorts, larger percentages say the public would do a better job solving problems than elected officials. For example, 62% of those ages 50-64 say this, compared with just 32% who say the public would not do better than elected officials.

Trust in public political wisdom declines

While most think ordinary Americans would do a better job than elected officials, independent assessments of the public’s political wisdom are relatively negative, and have fallen in recent years.

Overall, just 34% say they generally have a very great deal or a good deal of confidence in the wisdom of the American people when it comes to making political decisions; a far greater share (63%) say they have not very much confidence or none at all. Confidence in the public’s political wisdom is down 23 points from 2007, when it stood at 57%. In 1997, nearly two-thirds (64%) said they had confidence in the public’s political wisdom.

Both parties have lost confidence and trust in public's political wisdom

There is no difference in views of the public’s political wisdom across party lines: Just 37% of Democrats and leaners and 36% of Republicans and leaners express at least a good deal of confidence. Similarly, the decline in confidence in the public’s ability to make political decisions over the past 18 years has occurred about equally among Republicans and Democrats.


On important political issues, most see their side as ‘losing’

For many Americans, generally negative feelings toward government are accompanied by the view that on the important issues of the day their side has been losing more often than winning.

Across most groups, majorities say their side is losing on important issues

Overall, 64% say that on the issues that matter to them in politics today, their side has been losing more often than it’s been winning. Only a quarter (25%) say they feel their side has been winning more often than losing; 11% volunteer that their side has been winning as often as losing, that they don’t think about politics in this way, or that they don’t know.

The feeling that one’s side has been losing on the issues is widespread across demographic and political groups. In fact, clear majorities of nearly all groups – with the exception of liberal Democrats and leaners – say they feel like their side has been losing more than winning.

About eight-in-ten Republicans and Republican leaners (79%) say they feel their side has been losing on the important political issues, while just 14% feel they’ve been winning. Comparably large majorities of conservative (81%) and moderate and liberal (75%) Republicans feel their side has been losing more than winning.

Among all Democrats and Democratic leaners, views are more mixed: 52% say their side has been losing more than winning on important political issues, while 40% say they’ve been winning more often. Among Democrats, there is a significant divide in views across ideological lines. By a 58%-35% margin, more conservative and moderate Democrats say their side has been losing more than winning on the issues that matter to them. Liberal Democrats are as likely to say their side has been winning (46%) as losing (44%) more often. This mixed rating among liberal Democrats is the most positive view of any group in the survey.

Across levels of educational attainment, the view that one’s side has been losing more often than winning is particularly widespread among those with no more than a high school diploma (67%) and those with only some college experience (66%). Somewhat smaller majorities of college graduates (59%) and post graduates (56%) also say their side has been losing more often than winning on important issues.

Those who say their side has been losing more are angrier at government

Views on winning and losing in politics are tied to overall feelings toward government. Among the share who say their side has been winning on issues more often than losing, more say they are content with the federal government (34%) than say they are angry (9%), while 55% say they are frustrated. Among those who say their side has been losing more often than winning, a greater share is angry with government (27%) than content (9%), while 61% say they are frustrated.

Most say politics not a struggle between right and wrong

Although there has been a marked rise in partisan antipathy – the dislike of the opposing party – in recent years, most Americans do not go so far as to say they view politics as a struggle between right and wrong.

Most do not think of politics as a struggle between right and wrong

Overall, while 44% say they think about politics as a struggle between right and wrong, 54% say they do not see politics this way.

The view that politics is a struggle between right and wrong is more common among blacks (57%) than among Hispanics (47%) or whites (40%).

Those with higher levels of educational attainment are particularly unlikely to see politics in these stark terms: Just 30% of those with post-graduate degrees and 34% of those with college degrees, say politics is a struggle between right and wrong. By comparison, 51% of those with no more than a high school diploma and 44% of those with some college experience say this.

Conservative Republicans and leaners are more likely than those in other partisan groups to say they view politics as a struggle between right and wrong: 53% say this, compared with just 38% of moderate and liberal Republicans, 45% of conservative and moderate Democrats, and 37% of liberal Democrats.

9. Views of the nation, how it’s changing and confidence in the future

The public continues to express mixed opinions about the United States’ standing in the world. About half (52%) say the U.S. is “one of” the world’s greatest nations, while 32% say it “stands above” all others. Relatively few (15%) say there are countries that are better than the United States.

Views of U.S. global standing and confidence in the nation's future

Most Americans are not highly confident in the nation’s future. Fewer than half (45%) express quite a lot of confidence in the future of the U.S. Overall confidence in the future of the U.S. is at about the same level as it was 20 years ago, but is substantially lower than during the 1970s.

Opinion about the United States and its future prospects are associated with other attitudes about government. The small minority of Americans who have little or no confidence in the nation’s future (15% of the public) are more likely to feel angry with the federal government than are those who feel more optimistic about the future of the U.S.

As recent Pew Research Center surveys have found, more Americans say immigrants strengthen the country (53%) than say they are a burden on the United States (38%). And most (57%) say the country’s increasing ethnic diversity makes it a better place to live. Attitudes about immigrants and growing ethnic diversity also are linked to views about government: Anger with the federal government is more widespread among those with negative views of immigrants and increased diversity than among those with more positive attitudes.

U.S. standing in the world, confidence in the future of the country

As in the past, there are wide age and ideological differences in views of the United States’ world standing.

Wide age and partisan differences in views of U.S. standing in the world

While roughly half or more across age categories take a middle-ground view – that the U.S. is one of the greatest countries – older adults are more likely than younger people to say that the U.S. stands above all other nations.

Among those 65 and older, 45% say the U.S. stands above other nations, the highest share of any age group. Just 19% of those under 30 say the same. By contrast, young people are much more likely than those 65 and older to say there are other nations better than the United States (25% vs. 6%).

Nearly half of conservative Republicans and Republican leaners (48%) say the U.S. stands above all other nations – by far the highest share among ideological groups. No more than about a third of those in any other group (32% of moderate and liberal Republicans) view the United States’ global standing so positively.

Just 17% of liberal Democrats say the United States stands above all other nations, the lowest percentage among ideological groups. Most liberal Democrats (60%) say the U.S. is among the world’s greatest nations, while 22% say other nations are better than the United States.

Young adults less likely to have 'quite a lot' of confidence in U.S. future

Confidence in the future of the U.S. is lower today than it was in the mid-1970s. For example, a 1975 survey by Gallup found that 60% had quite a lot of confidence in the future of the U.S. The share expressing a lot of confidence in the future of the U.S. fell to 48% in 1994 and is at about the same level today (45%).

More Republicans than Democrats view the United States as “exceptional” – standing above all other nations – but fewer Republicans express strong confidence in the nation’s future.

Half of Democrats and leaners say they have quite a lot of confidence in the nation’s future, compared with 40% of Republicans and leaners.

Young adults – who have a less positive view of the U.S.’s global standing than do older adults – are also less likely to have a high degree of confidence in the nation’s future. Just 38% of those younger than 30 have quite a lot of confidence in the future of the U.S., the lowest of any age group. Among those 50 and older, about half have a lot of confidence in the nation’s future.

Feelings of political efficacy and confidence in the nation’s future

Overall, people who feel like they can influence politics and government express greater confidence in the nation’s future than do those who say they have less ability to influence government.

Among people with a relatively high degree of “political efficacy” – those who say their vote matters and that ordinary citizens have the capacity to affect government – 57% have quite a lot of confidence in the future of the U.S.

How feelings of political efficacy are linked to confidence in nation's future

Among those who respond affirmatively to only one of the political efficacy questions – that is, they say either that voting matters or that citizens can influence government, but not both – 40% have a high degree of confidence in the nation’s future. And among those with low efficacy (those who respond negatively to both questions), just 32% have quite a lot of confidence.

This pattern holds within both parties. Republicans and Republican leaners with high political efficacy are more likely to have quite a lot of confidence in the country’s future (52%) than are those with medium (35%) or low (29%) levels of political efficacy.

Similarly, 62% of Democrats and Democratic leaners with high political efficacy have a lot of confidence in the country’s future compared with 46% of those with medium levels of efficacy and 35% of those with low political efficacy.

Views of the nation’s future and opinions about government

People who are most confident about the nation’s future have much less animosity toward the federal government than do those who are less confident.

Frustration is the public’s dominant feeling toward government, irrespective of people’s confidence about the nation’s future.

Those less confident in U.S. future far more likely to express anger toward federal government

Nonetheless, among those highly confident in the future of the U.S., 29% are “basically content” with the federal government, while only about half as many feel “angry” (15%).

The most intensely negative feelings toward government are seen among those with little or no confidence in the country’s future (15% of the public): Just 6% in this group say they are content with the federal government, while 39% say they are angry. This level of anger is more than twice the level seen among those who have a lot of confidence in the country’s future (15%).

Views of the roots of the country’s success

There are substantial differences of opinion about the factors behind the nation’s success. About half say the U.S. has been successful more because of its ability to change, while 43% attribute the success of the United States more to its adherence to long-standing principles.

Country's success based on ability to change or reliance on principles?

There are wide partisan differences on this question. Six-in-ten Republicans and Republican leaners (60%) say the country’s success has more to do with its reliance on principles than its ability to change (including 70% of conservative Republicans and leaners). By contrast, a 66% majority of Democrats and Democratic leaners say the country has been successful more because of its ability to change; this view is even more widely held among liberal Democrats and leaners (74%).

These attitudes also differ sizably by age. By nearly two-to-one (65% to 33%), those younger than 30 say the U.S. has been successful more because of its ability to change. Those 50 and older are divided: 48% attribute the country’s success more to its reliance on principles, while 44% link it more to its ability to change.

Views on the reasons for the country’s success are tied to a range of opinions toward the federal government. In general, those who see the country’s ability to change as the bigger reason for its success are more likely to hold positive views of government than those who say reliance on principles is the bigger reason why the U.S. has been successful.

Among those who say the country has been successful because of its ability to change, more say they are basically content with government (26%) than say they are angry (15%); 57% say they are frustrated. By contrast, among those who say the country has been successful because of its reliance on principles, more express anger toward the federal government (30%) than say they are basically content (14%), while 54% say they are frustrated.

Views on reasons for U.S. success tied to attitudes toward government

Half of those who cite change as the bigger reason for the country’s success say the government often does a better job than people give it credit for, while 47% say it is almost always wasteful and inefficient. Views are much more negative among those who cite reliance on principles as the bigger reason for the country’s success: Fully 71% in this group say the government is almost always wasteful and inefficient, and just 28% say government does a better job than it gets credit for.

A similar pattern is seen on a general question about the scope of government. Most (59%) of those who credit the ability to change for the country’s success say government should do more to solve problems. Those who say reliance on principles is the main reason the country has been successful take the opposite view: About two-thirds (65%) say government is doing too many things better left to businesses and individuals.

The relationship between views of the country’s success and views of government are statistically significant within both political parties.

Views of diversity, immigrants and government

On balance, the public takes a positive view on immigrants and increasing diversity in the United States.

Overall, 57% say having an increasing number of people of many different races, ethnic groups and nationalities makes the United States a better place to live, compared with just 8% who say it makes the country a worse place to live and 34% who say it doesn’t make much difference either way.

Most say racial, ethnic diversity makes U.S. a better place to live

About two-thirds of Democrats and Democratic leaners (65%) say diversity makes the U.S. a better place to live, while 30% say it doesn’t make much difference and just 5% say it makes the country a worse place to live. Republicans and Republican leaners are less positive: Most (52%) say diversity makes the country a better place to live, compared with 35% who say it doesn’t make much difference and 10% who say it makes the U.S. a worse place to live.

Across demographic groups, those with a post-graduate degree (76%), college graduates (72%), Hispanics (63%) and younger adults under age 50 (61%) are among the most likely to say diversity makes the U.S. a better place to live.

Views also tilt positive when it comes to overall assessments of immigrants’ impact on the country today. Overall, 53% say that immigrants today strengthen the country because of their hard work and talents, while fewer (38%) say that immigrants today are a burden on the country because they take jobs, housing and health care.

There are wide differences on this question across partisan and ideological lines. Nearly eight-in-ten (79%) liberal Democrats and leaners and 63% of conservative and moderate Democrats and leaners say that immigrants strengthen the country through their hard work and talents, rather than burdening the country.

More see immigrants as a strength rather than a burden for the country

Among conservative Republicans and Republican leaners, more say that immigrants today are a burden on the country (57%) than say they strengthen it (31%). Moderate and liberal Republicans and leaners are divided: 45% say they think immigrants today are a burden, while about as many (44%) say they strengthen the country.

There also are wide differences across age groups. Those ages 18-29 are more likely to say immigrants strengthen rather than burden the country by a 69%-26% margin. Among those 65 and older, slightly more view immigrants as a burden (47%) than say they strengthen the country (42%).

Hispanics hold highly positive views of immigrants. About eight-in-ten Hispanics (81%) say they think of immigrants as strengthening the country, while just 14% say they are a burden. Views of immigrants are much more mixed among blacks (52% strengthen vs. 40% burden) and whites (46% vs. 44%).

These overall assessments on how diversity and immigrants impact the country are connected to feelings toward government.

Those who view the impact of diversity and immigrants on the country negatively are more likely to express anger toward the federal government.

Among those who say immigrants strengthen the country, just 13% say they are angry with government. Anger is more than twice as high among those who view immigrants as a burden on the country: 34% say they are angry with the federal government.

Anger at government higher among those who view immigrants as a burden

A similar pattern is seen in views of diversity. Among those who say diversity makes the country a better place to live, just 17% say they are angry with the federal government. This percentage rises to 24% among those who say diversity doesn’t make much difference in the country either way and reaches 42% among those who say an increasing number of people of many different races, ethnic groups and nationalities make the U.S. a worse place to live.

10. Government and taxes

While the public expresses a range of negative assessments of the government generally, there continues to be limited public outcry over personal tax burdens. At the same time, a majority say that most Americans want more from the government than they are willing to pay for in taxes.

Paying their ‘fair share’

Slightly more than half (54%) say they think they pay about the right amount in taxes, considering what they get from the federal government; 40% say they pay more than their fair share, while just 4% say they pay less than their fair share.

Republicans are more likely to say they pay 'more than fair share in taxes'

There are significant demographic and political differences when it comes to assessments of individual tax burdens.

Among Republicans and Republican-leaning independents, as many say they pay more than their fair share in taxes as say they pay about the right amount (both 48%), with no significant differences in views between conservatives and moderates and liberals.

Among Democrats and Democratic-leaning independents, 60% say that they pay about the right amount in taxes, considering what they get from the federal government, while only about half as many say they pay more than their fair share (33%).

Across age groups, the oldest and youngest adults are more likely than others to say they pay about the right amount of taxes. Two-thirds of those 65 and older (66%) and 58% of those ages 18-29 say they pay about the right amount of taxes. By contrast, fewer of those ages 30-49 (50%) or 50-64 (47%) say they pay the right amount.

Those with greater family incomes are somewhat more likely than others to say they pay more than their fair share. About half (51%) of those with annual family incomes of $100,000 or more and 48% of those with incomes between $75,000 and $99,999 say this, compared with 40% of those with incomes between $30,000 and $74,999 and just 34% of those with lower incomes. Similarly, those with post-graduate (45%) or college degrees (44%) are more likely than those who have not attended college (36%) to say they pay more than their fair share.

High-income earners more likely to say they pay 'more than fair share' in taxes

Among blacks, 49% say they pay more than their fair share, while about the same proportion (46%) say they pay about the right amount. Both Hispanics and whites are more likely to say they pay about the right amount than to say they pay more than their fair share.

Those who say they pay more than their fair share in taxes are somewhat more angry with government, and less trusting, than those who say they pay about the right amount or less than their share in taxes. Wider attitudinal differences emerge between the two groups over general assessments of government performance and impressions of government waste.

Among those who say they pay more than their fair share of taxes, considering what they get from the federal government, more say they are angry with government (31%) than content (13%), while 54% say they are frustrated. Views are less intensely negative among those who say they pay about the right amount or less than their share in taxes: just 17% of this group says they are angry with government compared with 25% who are content and 57% who are frustrated.

Similarly, the percentage who volunteer that they never trust the government to do what’s right is somewhat higher among those who think they pay more than their share in taxes (21%) than among those who say they pay the right amount or too little (9%).

Views of personal tax burden and attitudes toward government

When it comes to an overall assessment of how well the federal government runs its programs, nearly half of those who say they pay more than their share of taxes (48%) say the government does a poor job running its programs, while 39% say they do an only fair job and just 12% say they do an excellent or good job. By contrast, 47% of those who say they pay about the right amount or less than their share in taxes say the government does an only fair job running programs; about as many say they do an excellent or good job (26%) as a poor job (25%).

Nearly seven-in-ten (69%) of those who say they pay more than their share in taxes view the government as almost always wasteful and inefficient, while just 28% say government often does a better job than people give it credit for. Views are much less negative among those who say they pay about the right amount or less than their fair share in taxes: 50% say the government is almost always wasteful and inefficient, while 47% say it often does a better job than people give it credit for.

Among both Republicans and Republican leaners and Democrats and Democratic leaners, the patterns on these questions are significant: Those who feel they pay more than their fair share in taxes are more critical of government than those who do not.

Does public demand more from government than it is willing to pay for?

When it comes to taxes and government services, many say Americans aren’t willing to pay for all the things they want government to do.

Many say public wants more from government than it is willing to pay for

Overall, 52% say that most Americans demand more from the government than they are willing to pay taxes for, while somewhat fewer (44%) say most Americans are willing to pay the taxes needed to fund the services they expect government to provide.

There is general partisan agreement on this question: Most Republicans and leaners (54%) and Democrats and leaners (52%) say the public demands more from government than they are willing to pay for, with only modest differences across ideological lines within each party.

There are wider differences in these views by education, income, and race and ethnicity. In general, those with higher levels of education or higher incomes are among the most likely to say the public expects more from government than they are willing to pay for, while those with lower levels of education and income are more divided. For example, among those with family incomes of $100,000 a year or more, 61% say most Americans demand more from the government than they are willing to pay taxes for, while just 37% say most Americans are willing to pay taxes for the services they expect. By contrast, those earning less than $30,000 a year are divided, with about as many (49%) as not (47%) saying the public is willing to pay taxes to fund the services they expect.

Across racial and ethnic groups, whites (54%) and Hispanics (52%) are somewhat more likely than blacks (44%) to say the public is not willing to pay for the government services they demand.

A majority (57%) of those under age 50 say the public demands more from government than they are willing to pay for; views are mixed among those ages 50-64 (49% demands more, 47% is willing to pay for what it expects), and those 65 and older are slightly more likely (50%) than not (42%) to say the public is willing to pay for the services it expects from government.

Public’s top economic concerns

Overall, 31% say the federal budget deficit is the national economic issue that worries them most, while an equal share says the job situation is their top economic worry. Fewer consider rising prices (20%) or the condition of the financial and housing markets (13%) to be their top economic concern.

Partisans have differing perspectives on the most important national economic issue. A 44% plurality of Republicans and leaners say the budget deficit is their top economic worry, while 26% cite the job situation; relatively few say prices (16%) or the financial and housing markets (9%) are their top concern.

Partisan differences in top economic worry

Democrats and leaners are far less likely than Republicans to name the job deficit as their biggest worry: Just 22% say this, about as many say rising prices are their top economic worry (23%). The job situation is cited more frequently (named by 35%), while 18% say the condition of the financial and housing markets is their top economic concern.

Those who say the budget deficit is their top national economic worry are less likely to say the government should do more to solve problems and offer more negative views of the social safety net than those who cite other economic concerns.

Those most concerned about deficit take a more limited view of government, aid to poor and needy

Those most concerned with the deficit are about twice as likely to see government as doing too much that is better left to businesses and individuals (65%) as to say government should do more to solve problems (32%). By contrast, a 55% majority of those who more concerned about other economic worries say the government should do more to solve problems, while 42% say it is doing too much.

When it comes to how much government should do for needy Americans, those whose top economic concern is the deficit are far more likely to say the government can’t afford to do much more to help the needy (65%) than to say it should do more to help even if it means going deeper into debt (29%). By contrast, 55% of those who name issues other than the deficit as their top economic worry say the government should do more to help needy Americans, even if it means going deeper into debt, while 40% say government can’t afford to do much more.

Those most worried about the deficit are more likely to say “poor people have it easy because they can get government benefits without doing anything in return” (57%) than to say “poor people have hard lives because government benefits don’t go far enough to help them live decently” (33%). The balance of opinion is roughly the reverse among those who cite other issues as their top economic worry: 55% of this group says poor people have hard lives because government benefits don’t go far enough to help them live decently, while fewer (36%) say poor people have it easy because they can get government benefits without doing anything in return.

While those who cite the budget deficit as their top economic worry are more Republican than the public overall – and those who cite other economic issues are more Democratic – the relationships between these views persist among both Republicans and Democrats.

Those most concerned about the deficit are modestly more likely to express anger at government. While 22% of the public overall is angry with government, that rises to 28% of those who say the deficit is their top economic worry (compared with 20% of those who name a different top worry). This is also the case among Republicans: 37% of those most concerned about the deficit express anger at government, compared with 31% of Republicans who name another top concern.

11. How government compares with other national institutions

The public expresses mixed opinions about the effect of several major nongovernmental institutions on the country. But in nearly all cases, the influence of these institutions is viewed more positively than that of the federal government – and especially Congress.

Views of how the government, other major institutions affect the country

Of 10 nongovernmental institutions included in the survey, majorities say four are having a positive effect on the way things are going in the country: small businesses (82% positive), technology companies (71%), colleges and universities (63%) and churches and other religious institutions (61%).

The public is more divided over the impact of three other institutions – the energy industry (48% positive), labor unions (45%) and banks and financial institutions (40%).

And three others are viewed as having decidedly negative influence on the country. Just 33% say large corporations have a positive impact, 32% say that about the entertainment industry, and just 25% say the national news media has a positive effect. Majorities say all three have a negative effect on the way things are going in the U.S.

By comparison, 41% view the impact of the Obama administration positively and only a quarter (25%) say the federal government has a positive effect. Just 14% say Congress has a positive effect on the way things are going in the country, while 75% say its impact is negative.

In some cases, opinions about national institutions have become more positive since the previous study of attitudes toward government in March 2010, conducted when economic conditions were much worse than they are today.

Public views impact of banks, labor unions more positively than in 2010

The share of Americans who say banks and financial institutions have a positive impact, which stood at 22% in 2010 (and 2012), has increased to 40%. The percentage saying labor unions have a positive effect on the country has risen 13 points (from 32% to 45%). And small businesses, whose impact was already viewed very positively in 2010, is viewed even more positively today (82% positive, up from 71%).

Opinions about the impact of other nongovernmental institutions have shown less change. There also has been no change in assessments of the federal government’s impact. Meanwhile, views of Congress’s effect on the country have become less positive: Just 14% say it has a positive effect on the country, which is little changed from 2012 (15%), but down 10 percentage points from 2010 (24%).

Partisan differences in views of impact of institutions

Democrats and Democratic leaners are far more likely than Republicans and Republican leaners to say labor unions have a positive impact on the country, and these differences have widened since 2010.

Wide partisan gaps over impact of unions, churches, colleges, media

Currently, 59% of Democrats and just 28% of Republicans say unions have a positive impact. The share of Democrats who view unions’ impact in positive terms has increased 16 percentage points since 2010 (from 43%). Republicans’ views have shown less change (22% then, 28% now).

As in the past, higher percentages of Democrats (70%) than Republicans (54%) say colleges and universities have a positive impact. The partisan differences over the effect of the national news media and the entertainment industry are comparable – though majorities in both parties say these institutions have a negative effect on the country.

Republicans are more likely than Democrats to say that churches positively impact the country (72% vs. 54%). And while 41% of Republicans view the impact of large corporations positively, just 27% of Democrats agree.

Ideological divide over impact of churches, colleges

Among ideological groups, the impact of churches and religious organizations is viewed positively, except among liberal Democrats.

Just 41% of liberal Democrats say churches have a positive effect on the country; that compares with 64% of moderate and conservative Democrats, 69% of moderate and liberal Republicans and 75% of conservative Republicans.

Large differences between liberal Democrats and conservative Republicans over churches, colleges

Conservative Republicans are more skeptical of the influence of colleges and universities. Only about half (48%) say they have a positive impact on the country; majorities in other ideological groups view their impact positively.

Majorities of adults, regardless of partisan and ideological affiliation, say the national news media is having a negative effect on how things are going in the country today. However, conservative Republicans and Republican leaners are particularly critical: 82% say the national news media has a negative impact, while just 14% say it has a positive impact.

Republicans are also more critical of the entertainment industry than are Democrats: Majorities of moderate and liberal Republicans and Republican leaners (60%) and their conservative counterparts (65%) say that the entertainment industry has a negative effect on the United States. Half of conservative and moderate Democrats and 44% of the party’s liberals view its impact negatively.

Democrats critical of large corporations, conservative Republicans view unions' impact negatively

Majorities of both conservative and moderate Democrats (59%) and liberal Democrats (75%) say large corporations have a negative impact. Among Republicans, 47% of conservatives and 44% of moderates and liberals say they affect the country negatively.

Conservative Republicans are the only ideological group in which a majority (63%) says that labor unions have a negative effect on the country. Moderate and liberal Republicans express more mixed views (36% positive, 45% negative), while majorities of both Democratic groups say unions have a positive impact.

Democrats are ideologically divided over the impact of the energy industry, as well as of banks and other financial institutions.

Democrats ideologically divided over impact of the energy industry, banks and financial institutions

Liberal Democrats are much more likely than the party’s conservatives and moderates to view the effect of the energy industry negatively (58% vs. 38%).

And while 57% of liberal Democrats say banks have a negative effect on the country, a smaller share (43%) of conservative and moderate Democrats agree. Republicans express similar views of the impact of the energy industry and banks, regardless of ideology.

While there are partisan and ideological differences in views of the impact of most institutions, there is broad agreement that technology companies and small businesses have a positive effect on the way things are going in the country.

Feelings toward government and views of impact of institutions

Feelings about the federal government - and views of other institutions

People who say they are “basically content” with the federal government – 18% of the overall public – have a more positive view of nongovernmental institutions than do those who feel “frustrated” or “angry” with government.

Those who are content with government are mostly made up of Democrats and Democratic leaners. Nonetheless, the “content” group is positive toward nearly all institutions – even some, such as banks and financial organizations – that are viewed negatively by all Democrats.

In contrast, people who are angry at government (22% of the public) are more critical of some institutions than are those who express frustration or are content with government. For instance, just 41% of the “angry” group – who are largely Republicans and Republican leaners – say that colleges and universities have a positive impact; overall, Republicans (54%) view their impact positively.

Methodology

Survey conducted August 27-October 4, 2015

Most of the analysis in this report is based on telephone interviews conducted August 27-October 4, 2015 among a national sample of 6,004 adults, 18 years of age or older, living in all 50 U.S. states and the District of Columbia (2,113 respondents were interviewed on a landline, and 3,891 were interviewed on a cellphone, including 2,227 who had no landline telephone). The survey was conducted under the direction of Abt SRBI. A combination of landline and cellphone random digit dial samples were used; both samples were provided by Survey Sampling International. Interviews were conducted in English and Spanish. Respondents in the landline sample were selected by randomly asking for the youngest adult male or female who is now at home. Interviews in the cell sample were conducted with the person who answered the phone, if that person was an adult 18 years of age or older. For detailed information about our survey methodology, see https://alpha.pewresearch.org/pewresearch-org/methodology/u-s-survey-research/

Data collection was divided equally into two phases (A and B) with independent samples, non-overlapping interview dates and separate weighting. The questionnaire for each phase contained a core set of measures of political attitudes and values, political engagement and demographic characteristics.

The combined landline and cell phone sample are weighted using an iterative technique that matches gender, age, education, race, Hispanic origin and nativity and region to parameters from the 2013 Census Bureau’s American Community Survey and population density to parameters from the Decennial Census. The sample also is weighted to match current patterns of telephone status (landline only, cell phone only, or both landline and cell phone), based on extrapolations from the 2014 National Health Interview Survey. The weighting procedure also accounts for the fact that respondents with both landline and cell phones have a greater probability of being included in the combined sample and adjusts for household size among respondents with a landline phone. The margins of error reported and statistical tests of significance are adjusted to account for the survey’s design effect, a measure of how much efficiency is lost from the weighting procedures.

The following table shows the unweighted sample sizes and the error attributable to sampling that would be expected at the 95% level of confidence for different groups in the survey:

Methodology - 1

Survey conducted September 22-27, 2015

Some of the analysis in this report is also based on telephone interviews conducted September 22-27, 2015 among a national sample of 1,502 adults, 18 years of age or older, living in all 50 U.S. states and the District of Columbia (525 respondents were interviewed on a landline telephone, and 977 were interviewed on a cell phone, including 560 who had no landline telephone). The survey was conducted by interviewers at Princeton Data Source under the direction of Princeton Survey Research Associates International. A combination of landline and cell phone random digit dial samples were used; both samples were provided by Survey Sampling International. Interviews were conducted in English and Spanish. Respondents in the landline sample were selected by randomly asking for the youngest adult male or female who is now at home. Interviews in the cell sample were conducted with the person who answered the phone, if that person was an adult 18 years of age or older.

The combined landline and cell phone sample are weighted using an iterative technique that matches gender, age, education, race, Hispanic origin and nativity and region to parameters from the 2013 Census Bureau’s American Community Survey and population density to parameters from the Decennial Census. The sample also is weighted to match current patterns of telephone status (landline only, cell phone only, or both landline and cell phone), based on extrapolations from the 2014 National Health Interview Survey. The weighting procedure also accounts for the fact that respondents with both landline and cell phones have a greater probability of being included in the combined sample and adjusts for household size among respondents with a landline phone. The margins of error reported and statistical tests of significance are adjusted to account for the survey’s design effect, a measure of how much efficiency is lost from the weighting procedures. The following table shows the unweighted sample sizes and the error attributable to sampling that would be expected at the 95% level of confidence for different groups in the survey:
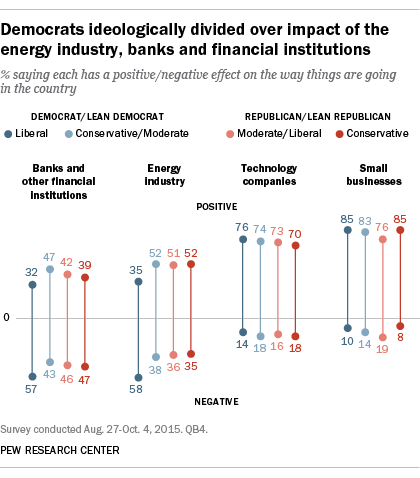
Methodology - 2

Survey conducted October 16-20, 2015

Additionally, some of the analysis in this report is based on telephone interviews conducted October 16-20, 2015  among a national sample of 1,018 adults, 18 years of age or older, living in the continental United States (510 respondents were interviewed on a landline telephone, and 508 were interviewed on a cell phone, including 329 who had no landline telephone). The survey was conducted under the direction of Social Science Research Solutions (SSRS). A combination of landline and cell phone random digit dial samples were used; both samples were provided by Marketing Systems Group. Interviews were conducted in English and Spanish.

The combined landline and cell phone sample are weighted using an iterative technique that matches gender by age, education, race, Hispanic origin and nativity, marital status and region by gender to parameters from the March 2014 supplement of the U.S. Census Bureau’s Current Population Survey and population density to parameters from the Decennial Census. The sample also is weighted to match current patterns of telephone status (landline only, cell phone only, or both landline and cell phone), based on the 2014 National Health Interview Survey. The weighting procedure also accounts for the fact that respondents with both landline and cell phones have a greater probability of being included in the combined sample, adjusts for the number of landlines and cellphones the respondent answers and adjusts for household size among respondents with a landline phone. The margins of error reported and statistical tests of significance are adjusted to account for the survey’s design effect, a measure of how much efficiency is lost from the weighting procedures.

The following table shows the unweighted sample sizes and the error attributable to sampling that would be expected at the 95% level of confidence for different groups in the survey:

Methodology - 3

Sample sizes and sampling errors for other subgroups are available upon request.

In addition to sampling error, one should bear in mind that question wording and practical difficulties in conducting surveys can introduce error or bias into the findings of opinion polls.

Pew Research Center is a nonprofit, tax-exempt 501(c)(3) organization and a subsidiary of The Pew Charitable Trusts, its primary funder.

Appendix A: Why partisans include ‘leaners’

Discussions of partisans throughout this report combine both those who identify with a party and those who lean toward one of the two major parties. Though Americans increasingly say they are politically independent, most of those who do not affiliate with a party lean Republican or Democratic. These partisan “leaners” tend to have attitudes and behaviors that are very similar to those of partisans, a dynamic long observed by political scientists and other political observers, as well as in prior Pew Research Center studies (see Appendix B of Pew Research Center’s 2014 study of Political Polarization in the American Public for more examples). In many cases, the attitudes of “all independents” can be misleading, since this tends to obscure real partisan differences within the group.

This is the case when it comes to attitudes about the federal government, evaluations of the government’s job and views of the role government should play in key areas.

On many evaluations of government, independents who lean to the Democratic Party differ greatly from those who lean to the Republican Party; moreover, leaners have very similar views as partisans of their party.

Appendix A - 1

For example, at least six-in-ten Democratic identifiers (69%) and leaners (62%) say the government should do more to solve problems, compared with no more than a third of Republican leaners (31%) and identifiers (23%).

A similar pattern exists when it comes to overall evaluations of government performance: 33% of Democratic identifiers, along with 26% of leaners rate the government’s job of running its programs as excellent or good, while just one-in-ten Republican leaners (11%) and identifiers (10%) say the same.

And on evaluations of the performance and role of the federal government in specific areas, the views of leaners closely map those of partisans, and are distinctly different from those who lean toward the other party. For instance, about four-in-ten of both Republican leaners (42%) and identifiers (39%) say the government is doing a good job ensuring access to health care; by comparison, 75% of Democratic identifiers and 72% of Democratic leaners say this. And while roughly a third of Republicans (32%) and GOP leaners (36%) say the government should play a major role in health care, among Democrats (85%) and Democratic leaners (79%) those proportions rise to around eight-in-ten.

Appendix A - 2

Though Democratic leaners are somewhat less likely than identifiers to evaluate the government positively when it comes to the economy, the 9-percentage-point difference in these views (61% vs. 72%, respectively) is far more modest than the 27-point difference between Republican leaners and Democratic leaners.

In each of these cases, reporting on a single “independent” category would have provided a contrast with Republicans and Democrats (those data points are plotted in the middle of the above graphics). But, since more than three-quarters of independents lean toward a party (to date in 2015, 37% lean to the GOP, 41% lean Democratic and 22% do not lean to either party), reporting on an independent group that is primarily the combination of these two dramatically different groups would be misleading; these are two groups that have little in common with each other, and far more in common with self-identified partisans.

In some cases throughout this report, those who lean neither to the Republican Party nor to the Democratic Party are discussed when they differ markedly from other groups.