
What the Public Knows — In Pictures, Words, Maps and Graphs
Pew Research Center News IQ Quiz
Survey Report
Before you read the report, test your own News IQ by taking the interactive knowledge quiz. The short quiz tests your knowledge of questions recently asked in a national poll. After completing the quiz, you can compare your score with the general public and with people like yourself.
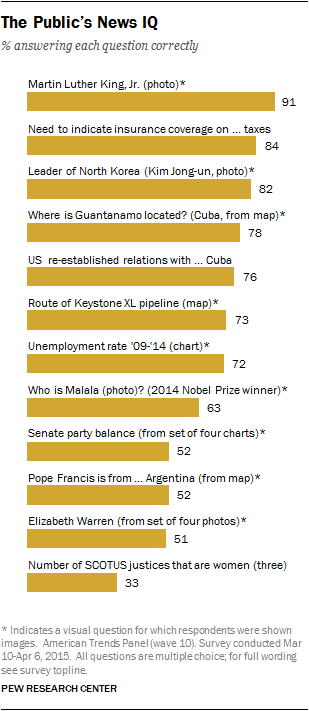
The latest Pew Research Center News IQ survey finds that, nearly half a century after the death of Martin Luther King Jr., an overwhelming majority of Americans (91%) are able to identify the civil rights leader from his picture.
Fully 96% of Millennials (ages 18 to 34), who were born decades after King’s assassination, could identify King, as could 89% among older generations. Respondents were shown a photograph of King and asked to identify him from a list of names that included Malcolm X, Jesse Jackson and Thurgood Marshall.
The survey, conducted March 10-April 6 among 3,147 adults who are part of the Pew Research Center’s American Trends Panel, also finds a large majority are able to associate a photograph of Kim Jong-un with the country he leads. Shown a picture of Kim Jong-un, 82% say he leads North Korea (from a list that includes South Korea, China and Malaysia).
The survey was conducted in the weeks leading up to the April 15 tax deadline: 84% know that in order to comply with the health care law, they must indicate on their taxes that they have health insurance coverage. The other choices given for demonstrating health coverage were when people vote, change their address, or get a driver’s license.
The public did well on several questions that included photographs and images. For instance, when shown a photo of Malala Yousafzai, the Pakistani advocate for girls’ education, 63% identify her as the winner of the 2014 Nobel Peace Prize (other choices: first Muslim elected to U.S. Congress, an Academy Award-winning director, Pakistan’s ambassador to the U.S.)
But questions about U.S. politics, even those that include images, proved challenging. About half (51%) could identify Elizabeth Warren from an array of four photographs of women lawmakers (other choices: Nancy Pelosi, Deb Fischer and Tammy Baldwin). In January 2013, fewer (43%) could identify Warren from the same set of photographs. (A Pew Research Center survey released April 2 found that 38% of registered voters had not heard of Elizabeth Warren).
And 52% know the correct partisan balance of the Senate (54 Republicans, 44 Democrats, two independents) from images showing various partisan configurations. About one-in-five (21%) say the GOP has an even larger Senate majority (61 seats), while 10% say Democrats hold the majority and 6% think the balance is 50-50.
As previous News IQ surveys have shown, the public is not very knowledgeable about the Supreme Court. Just a third of Americans (33%) know that of the nine Supreme Court justices, three are women. More (39%) say that there are two women on the high court, while 14% say there is one woman on the court and 4% say there are four.
The public’s lack of awareness about the court is not new: Three years ago, just 34% could identify John Roberts as the Supreme Court’s chief justice. In 1986, 43% identified William Rehnquist as chief justice, shortly after his confirmation (29% said it was Warren Burger, who had recently stepped down.)
Generations and News Knowledge

On half of the 12 questions in the news IQ quiz, there are no significant differences in knowledge across generations. And Millennials are somewhat more likely than the Silent Generation (ages 70-87), as well as Baby Boomers (50-69) and Gen X (35-49), to identify King’s photograph.
But Millennials are less likely than members of the Silent Generation to answer several questions correctly, many of them about politics.
Majorities across age cohorts correctly name Cuba as the country with which the U.S. recently re-established relations. A higher share of the Silent Generation (86%) than Millennials (69%) know this.
Similarly, more members of the Silent Generation (83%) than Millennials (67%) could identify the route of the proposed Keystone XL pipeline from a map.
Nearly six-in-ten Silents (58%) and 46% of Millennials could identify Pope Francis’ native country as Argentina, from a map that includes Italy, Spain and Mexico.
And Millennials are less likely than Silents to know the partisan composition of the Senate (47% of Millennials vs. 58% of Silents) and correctly identify Elizabeth Warren from a set of four photos (45% of Millennials vs. 59% of Silents).
Across most measures, older Millennials are better informed than younger Millennials, with some of the widest gaps on questions about Pope Francis, Elizabeth Warren and the composition of the Senate. Just 33% of younger Millennials (ages 18-24) could identify Pope Francis’ native country of Argentina from a map; 59% of older Millennials (ages 25-34) answered this correctly. About four-in-ten younger Millennials (39%) and 53% of older Millennials identified the correct partisan balance of the Senate. And about half of older Millennials (51%) and 38% of younger Millennials could identify Warren.
Educational Differences in Knowledge Persist
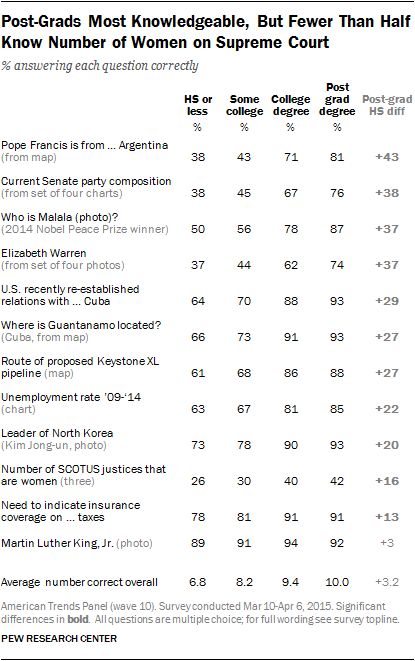
As in the past, there are substantial differences in news awareness by levels of education. Still, half or more of those with no more than a high school education answered eight of 12 questions correctly.
The education gap is particularly wide in the question about Pope Francis’ native country. Large majorities of both post-graduates (81%) and college graduates (71%) are able to correctly identify Argentina as the pope’s home country, while only about four-in-ten of those with some college experience (43%) and a high school degree or less (38%) can do so.
By contrast, roughly nine-in-ten across educational categories are able to identify Martin Luther King Jr. It is the only question on which there are no significant differences by education.
Among college graduates and those with post-graduate degrees, majorities answered 11 of 12 correctly. The only exception is the question about the number of women on the Supreme Court. Just 42% of those with a post-graduate degree and 40% of college graduates know there are three women on the high court. Even smaller shares of those with less education – 30% of those with some college experience but no degree and 26% of those with a high school degree or less – answered this correctly.

Partisan Differences in Knowledge
On average, Republicans, Democrats and independents each answer about eight of twelve knowledge questions correctly. More Republicans than Democrats could identify the route of the proposed Keystone XL pipeline from a map (79% vs. 66%) and locate the U.S. military prison at Guantanamo on a map (84% of Republicans and 72% of Democrats select Cuba).
And six-in-ten Republicans know the partisan composition of the Senate, while only about half of independents (51%) and Democrats (49%) correctly identify the party balance from a set of four charts depicting it.
Majorities across parties could identify the photographs of Malala and King, but Democrats are more likely than Republicans to answer these questions correctly (by six points and seven points, respectively).

Politically Engaged More Likely to Know Senate Composition
People who are politically engaged are more likely to know the party balance in the Senate than the less engaged; 56% of those who say they are registered to vote know the composition of the Senate, compared with 30% of those who are not registered to vote. And nearly two-thirds (64%) of those who report having voted in the 2014 midterms know the Senate’s partisan balance; 38% of adults who did not vote in the midterm elections this past November know this.
In addition, those at either end of the ideological spectrum are more aware of the Senate’s partisan composition, compared with those closer to middle ideologically. About six-in-ten (63%) conservative Republicans could identify the correct partisan balance of the Senate, compared with 54% of moderate and liberal Republicans. Liberal Democrats are 25 points more likely than conservative and moderate Democrats to know this (64% vs. 39%).
