
Mixed Views of Impact of Long-Term Decline in Union Membership
Public Says Workers in Many Sectors Should Be Able to Unionize
Survey Report

Over the past three decades, the share of wage and salary workers in the United States who belong to labor unions has fallen by about half. The public expresses mixed views of the impact of the long-term decline in union membership on the country: 45% say this has been mostly a bad thing, while 43% see it as mostly a good thing.
However, the effects of the decline in union membership on working people is seen in more negative terms: 52% say the reduction in union representation has been mostly bad for working people, compared with fewer (40%) who say it has been mostly good. The balance of opinion on this question is about the same as it was in a 1994 NBC/Wall Street Journal survey that asked about the previous 20 years.
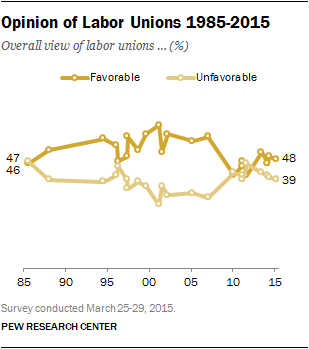
The latest national survey by the Pew Research Center, conducted March 25-29 among 1,500 adults, finds little recent change in overall favorability of labor unions: 48% hold a favorable view of unions, while somewhat fewer (39%) say they have an unfavorable view. Opinions of unions have recovered from lows reached in 2010 and 2011.
Public views of business corporations have followed a similar trajectory. Currently, 48% have a favorable impression of business corporations, compared with 43% who have an unfavorable opinion.
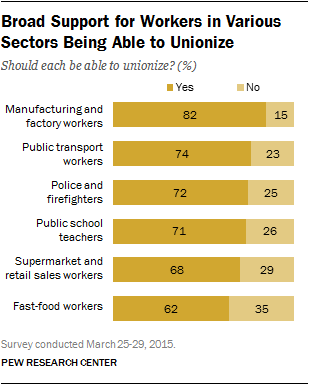
While the public expresses mixed views of unions overall, majorities of Americans say many different types of employees in specific sectors should be able to unionize.
Among the six sectors tested in the survey, support for workers’ ability to form a union is highest for factory and manufacturing workers: 82% say these workers should be able to unionize, while just 15% say they should not be able
Support for the ability of employees to unionize spans both public and private sectors: Seven-in-ten or more say public transportation workers (74%), police and firefighters (72%), and public school teachers (71%) should be able to unionize. For private sector workers in supermarkets and retail sales, a comparable 68% say these workers should be able to unionize.
A somewhat smaller majority (62%) says fast-food workers should be able to unionize, while 35% say they should not be able to. Fast-food restaurants have been the subject of recent protests around the country in support of higher wages. The percentage saying fast-food workers should be able to unionize is the lowest of the six types of employees included in the survey.

There are sharp partisan differences in views of labor unions, including in opinions about workers being able to unionize. Among Democrats, support for the ability to form a union ranges from 77% for fast-food workers to 92% for manufacturing and factory workers.
Republicans are less likely than Democrats to say each group of employees should be able to form a union. Still, a large majority of Republicans (71%) say factory and manufacturing workers should be able to unionize, and more than half say police and firefighters (59%), public transportation workers (58%) and public school teachers (54%) should be able to unionize.
However, just 42% of Republicans favor allowing fast-food workers to form unions; 54% say they should not able to unionize.
Democrats See Decline in Unionization as Bad for Country, Workers

Majorities of Democrats say the decline in union representation over the past two decades is mostly bad for the country (59%) and for working people (62%).
Republicans, by about two-to-one (62% to 29%), say the long-term reduction in union representation has been mostly good for the country.
Republicans have more mixed views of the decline’s impact on working people: about half (51%) say the reduction in union representation has been mostly good for workers, compared with 39% who say it has been mostly bad.
Demographic Differences in Views of Labor Unions

Across demographic groups, there are wide differences in overall favorability ratings of labor unions. Among blacks, who are more likely than other racial and ethnic groups to be union members, 60% hold a favorable view of unions; by comparison, 49% of Hispanics and 45% of whites view unions favorably.
Across age groups, views of unions are most positive among young adults: 55% of those ages 18-29 view unions favorably, while just 29% view them unfavorably. Among older adults, favorability ratings of unions are mixed with about as many holding favorable as unfavorable views.
Favorable views of unions are higher among lower-income households earning less than $30,000 a year (54%), than among those earning $30,000-$74,999 (44%) or $75,000 or more (45%).
By region, those living in the South are less likely than those living elsewhere in the country to hold favorable views of unions: 41% of Southerners view labor unions favorably, while 42% hold an unfavorable view. In the three other regions of the country, more hold favorable than unfavorable views of unions.
In households with at least one current union member, 64% view labor unions favorably, compared with 34% who hold unfavorable views. In households with former – but no current –union members, views of labor unions are not much different than the public overall (49% favorable, 42% unfavorable).
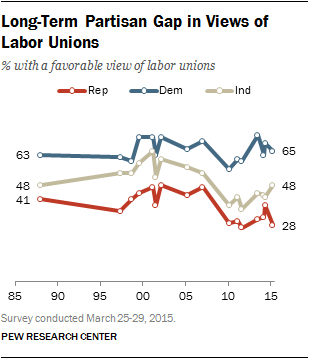
By about two-to-one (65%-23%) more Democrats view unions favorably than unfavorably. By contrast, Republicans view unions unfavorably by a comparably wide 60%-28% margin. Conservative Republicans are especially likely to hold unfavorable views of unions (66%), compared with 50% of moderate and liberal Republicans.
Divides Within GOP on Labor Unions
While Republicans hold much more negative views of labor unions than Democrats and independents, there also are differences in views of unions within the GOP.

Among Republicans and Republican-leaning independents ages 18-34, about as many say they have a favorable (45%) as unfavorable (44%) view of labor unions. By contrast, older Republicans are much more negative. For example, two-thirds (66%) of Republicans age 50 and older have an unfavorable view of unions, while just 24% hold a favorable view.
Republicans and Republican leaners with no more than a high school education are about twice as likely as those with a college degree to view unions favorably (41% vs. 19%). A similar pattern is seen among Republicans across incomes levels, with those earning less expressing mixed views and higher earners holding unfavorable views of unions.
Among Democrats and Democratic-leaning independents, there are only modest differences in views of unions. There are no significant differences among Democrats by age; across education and income, Democrats with higher levels express the most favorable views of unions, but majorities of those with lower incomes and less education also view unions favorably.
Favorability of Business Corporations
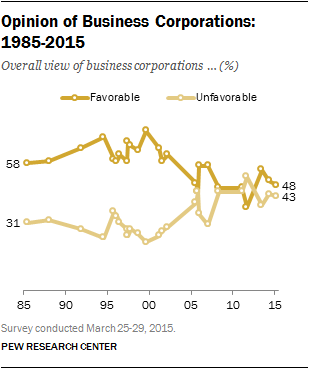
Overall favorability ratings for business corporations are very similar to those of labor unions: 48% hold a favorable view of business corporations, compared with 43% who hold an unfavorable view.
Ratings of business corporations have tracked closely with those of labor unions in recent years. As with unions, ratings of business corporations have recovered from lows reached in 2011, but remain well below previous highs in favorability.

Overall, Republicans express positive views of business corporations: 60% view them favorably, compared with just 31% who view them unfavorably. Conservative Republicans (67% favorable, 24% unfavorable) are more likely than moderate and liberal Republicans (50% favorable, 41% unfavorable) to take a positive view of business corporations.
Among Democrats, ratings of business corporations are mixed: 51% hold an unfavorable view, while 44% view them favorably. There are differences in views between liberal and moderate and conservative Democrats. By a 62%-35% margin, most liberal Democrats hold an unfavorable view of business corporations. Conservative and moderate Democrats, by contrast, are about as likely to hold favorable (50%) as unfavorable (44%) views of business corporations.
Across income levels, those with family incomes of $75,000 a year or more view business corporations favorably by a 57%-39% margin. Views are less positive among those earning less than $75,000, with about as many rating business corporations favorably as unfavorably.
