
Obama’s Second-Term Slide Continues
65% Disapprove of His Handling of Economy
Survey Report
Barack Obama has had a difficult year since his reelection victory. His overall job rating stands at 41%, down 14 points since last December. A majority (53%) now disapproves of the way he is handling his job as president.
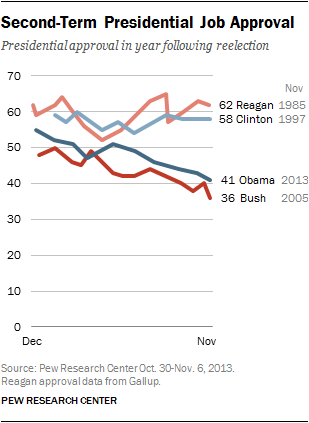
The latest national poll by the Pew Research Center, conducted Oct. 30-Nov. 6 among 2,003 adults, finds that Obama’s second-term job ratings have followed a similar downward trajectory as those of his predecessor, George W. Bush. A year after his reelection, 36% approved of Bush’s job performance, down from 48% in December 2004.
In contrast, the two prior presidents who won reelection – Bill Clinton and Ronald Reagan – enjoyed positive ratings over the course of the next year. At comparable points in their fifth year in office, 58% approved of Clinton’s job performance while Reagan’s job rating stood at 62%.
The new survey finds that majorities disapprove of the way Obama is handling four of five issues tested, with terrorism the lone exception (51% approve, 44% disapprove). For every issue, including terrorism, his ratings are lower than they were earlier this year.
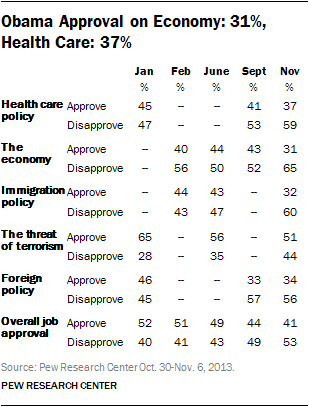
Obama’s job ratings on the economy have been more negative than positive for more than four years, but the current measure is the worst of his presidency. Just 31% approve of the way Obama is handling the economy, while 65% disapprove.
Only about one-in-five independents (21%) give Obama positive marks on the economy, while 75% disapprove. About a third of Democrats (34%) disapprove of the way Obama is handling the economy (64% approve).
Obama also gets negative ratings on health care policy (37% approve, 59% disapprove). In January, views of Obama’s handling of health care policy were mixed (45% approved, 47% disapproved).
The administration has come under intense criticism for the flawed roll-out of the Affordable Care Act. In a recent interview with NBC News, Obama apologized to those who have lost their health insurance under the law, despite his assurances that they would be able to stay on their plans.
Only about a third of the public (32%) approves of the job Obama is doing on immigration policy; 60% disapprove. Obama’s ratings for this issue among Democrats are mixed: About half (53%) approve of his handling of the issue while 42% disapprove.
Obama Job Ratings: 2009-2013
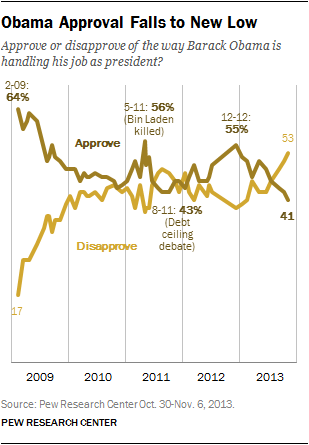
Obama’s approval ratings fluctuated during the early part of this year. But since May, when 51% approved of his job performance, his ratings have moved steadily downward – to 46% in July, 43% in October and 41% this month. (For a breakdown of Obama’s job approval ratings, see detailed tables).
While Obama’s overall marks have changed little over the past month, the 12-point difference between disapproval (53%) and approval (41%) is the largest of his presidency.
Since Obama’s first year in office, his job rating has been above 50% on only a handful of occasions. His rating last December (55% approve, 39% disapprove) was his highest since September 2009 (55% approve, 33% disapprove), with the exception of a brief spike after the killing of Osama bin Laden in May 2011 (56% approve, 38% disapprove).
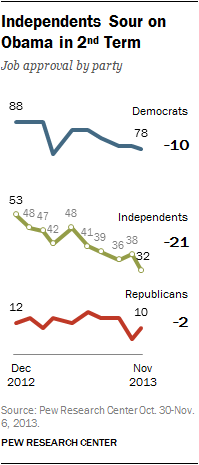
Since December 2012, Obama has lost the most ground among independents: Currently, only 32% of independents approve of his job performance while 61% disapprove. In December, 53% approved and 39% disapproved.
Obama’s current rating among independents is only slightly higher than Bush’s in November 2005 (29% approved). Like Bush, Obama retains broad support among members of his own party, though the share of Democrats who give him a positive jobs rating has fallen 10 points over the past year (from 88% to 78%). Obama’s job rating among Republicans, extremely low last December (12%), has changed little since then.
