
Pew Research Center

FOR RELEASE SEPTEMBER 18, 2013

Republicans Sour on Ben Bernanke

Survey Report As Ben Bernanke prepares to step down as chairman of the Federal Reserve in January, the public views him somewhat more favorably (38%) than unfavorably (31%), with 32% unable to offer a rating. Bernanke is better known now than he was in March 2008, when 55% could not rate him; at that time, […]

FOR MEDIA OR OTHER INQUIRIES:

Communications Department
202.419.4372
www.pewresearch.org

RECOMMENDED CITATION

Pew Research Center, September 2013, "Republicans Sour on Ben Bernanke"

About Pew Research Center

Pew Research Center is a nonpartisan, nonadvocacy fact tank that informs the public about the issues, attitudes and trends shaping the world. It does not take policy positions. The Center conducts public opinion polling, demographic research, computational social science research and other data-driven research. It studies politics and policy; news habits and media; the internet and technology; religion; race and ethnicity; international affairs; social, demographic and economic trends; science; research methodology and data science; and immigration and migration. Pew Research Center is a subsidiary of The Pew Charitable Trusts, its primary funder.

© Pew Research Center 2026

Table of contents

  • About Pew Research Center
  • Republicans Sour on Ben Bernanke
  • About the Survey

Republicans Sour on Ben Bernanke

Survey Report As Ben Bernanke prepares to step down as chairman of the Federal Reserve in January, the public views him somewhat more favorably (38%) than unfavorably (31%), with 32% unable to offer a rating. Bernanke is better known now than he was in March 2008, when 55% could not rate him; at that time, […]

Survey Report

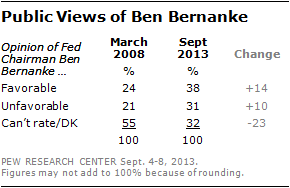
As Ben Bernanke prepares to step down as chairman of the Federal Reserve in January, the public views him somewhat more favorably (38%) than unfavorably (31%), with 32% unable to offer a rating.
Public Views of Ben Bernanke

Bernanke is better known now than he was in March 2008, when 55% could not rate him; at that time, 24% viewed him favorably and 21% held an unfavorable view.

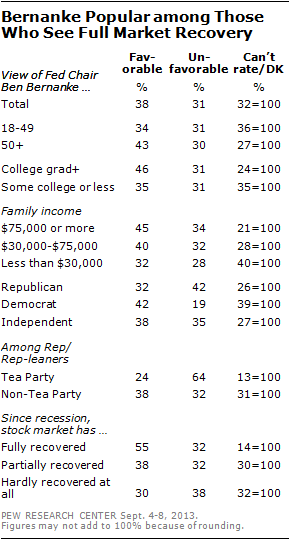
The national survey by the Pew Research Center, conducted Sept. 4-8 among 1,506 adults, finds that Republicans view Bernanke less favorably than they did five years ago. Currently, more Republicans have an unfavorable (42%) than favorable (32%) view of Bernanke.

Shifting Partisan Opinions of Departing Fed Chairman

In March 2008, three years after George W. Bush nominated him as Fed chair, Republicans viewed Bernanke favorably by three-to-one (36%-12%).

Tea Party Republicans, in particular, have a highly negative view of the outgoing Fed chair. Fully 64% of Republicans and Republican leaners who agree with the Tea Party have an unfavorable impression of Bernanke. That compares with just 32% of non-Tea Party Republicans.

By contrast, Bernanke’s image among Democrats is more positive than it was in 2008. In the current survey, Democrats view Bernanke favorably by a 42%-19% margin. Democrats had mixed views of Bernanke in 2008 (22% favorable, 25% unfavorable). Independents continue to express mixed views of the Fed chair.
Bernanke Popular among Those Who See Full Market Recovery

Bernanke is better known – and better liked – among college graduates than those with less education. About three-quarters of college graduates (76%) are able to offer a rating of Bernanke and they view him more favorably than unfavorably by a 46%-31% margin. Among those who have not completed college, fewer have an impression of Bernanke (65%) and opinions are more mixed (35% favorable vs. 31% unfavorable).

Views of Bernanke are closely tied to impressions of the stock market recovery. Among the roughly one-in-five Americans (21%) who say the stock market has fully recovered from the recession: 55% view Bernanke favorably compared with 32% who view him unfavorably (14% have no opinion). Bernanke is not as well known, and is viewed less favorably, among those who say the market has partially recovered (53% of the public) or has hardly recovered at all (18%) from the recession. (For more, see “Five Years after Market Crash, U.S. Economy Seen as ‘No More Secure’,” Sept. 12, 2013.)

About the Survey

The analysis in this report is based on telephone interviews conducted September 4-8, 2013 among a national sample of 1,506 adults, 18 years of age or older, living in all 50 U.S. states and the District of Columbia (751 respondents were interviewed on a landline telephone, and 755 were interviewed on a cell phone, including 401 who had no landline telephone). The survey was conducted by interviewers at Princeton Data Source under the direction of Princeton Survey Research Associates International. A combination of landline and cell phone random digit dial samples were used; both samples were provided by Survey Sampling International. Interviews were conducted in English and Spanish. Respondents in the landline sample were selected by randomly asking for the youngest adult male or female who is now at home. Interviews in the cell sample were conducted with the person who answered the phone, if that person was an adult 18 years of age or older. For detailed information about our survey methodology, see http://pewresearch.org/pewresearch-org/politics/methodology/

The combined landline and cell phone sample are weighted using an iterative technique that matches gender, age, education, race, Hispanic origin and nativity and region to parameters from the 2011 Census Bureau’s American Community Survey and population density to parameters from the Decennial Census. The sample also is weighted to match current patterns of telephone status and relative usage of landline and cell phones (for those with both), based on extrapolations from the 2012 National Health Interview Survey. The weighting procedure also accounts for the fact that respondents with both landline and cell phones have a greater probability of being included in the combined sample and adjusts for household size among respondents with a landline phone. Sampling errors and statistical tests of significance take into account the effect of weighting. The following table shows the unweighted sample sizes and the error attributable to sampling that would be expected at the 95% level of confidence for different groups in the survey:

9-18 Margins of Error

Sample sizes and sampling errors for other subgroups are available upon request.

In addition to sampling error, one should bear in mind that question wording and practical difficulties in conducting surveys can introduce error or bias into the findings of opinion polls.