Obama Job Approval Slips as Economic Pessimism Rises
Positive Signs on Stocks, Housing Have Little Impact
About Pew Research Center
Pew Research Center is a nonpartisan, nonadvocacy fact tank that informs the public about the issues, attitudes and trends shaping the world. It does not take policy positions. The Center conducts public opinion polling, demographic research, computational social science research and other data-driven research. It studies politics and policy; news habits and media; the internet and technology; religion; race and ethnicity; international affairs; social, demographic and economic trends; science; research methodology and data science; and immigration and migration. Pew Research Center is a subsidiary of The Pew Charitable Trusts, its primary funder.
Obama Job Approval Slips as Economic Pessimism Rises
Positive Signs on Stocks, Housing Have Little Impact
Overview
Barack Obama’s job approval rating has tumbled since shortly after his re-election, as the public’s economic expectations for the coming year have soured. Despite substantial public awareness of recent gains in the stock market and rebounding real-estate values, the percentage saying economic conditions will get worse over the next year has risen to its highest point in nearly eight years.
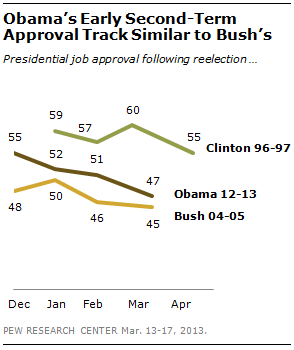
Obama’s job approval measure has fallen eight points since December, from 55% to 47%. His rating is comparable to George W. Bush’s (45%) at the same point early in his second term and is much lower than Bill Clinton’s 60% rating in February 1997.
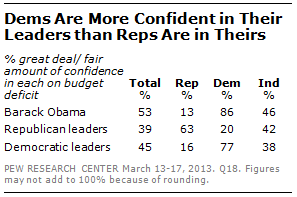
The latest national survey by the Pew Research Center, conducted March 13-17 among 1,501 adults, finds that despite Obama’s lower job rating, he retains greater public confidence than congressional Republicans in dealing with the budget deficit: 53% express at least a fair amount of confidence in him to handle the budget, compared with 39% who express the same confidence in GOP leaders.
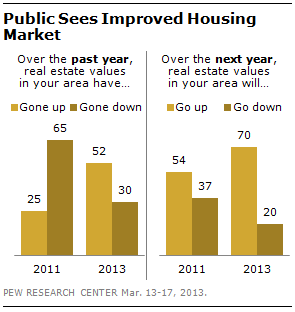
The decline in Obama’s approval rating comes at a time when the number of Americans saying that real estate prices have gone up has jumped from 25% in 2011 to 52% currently, and 71% of investors say the value of their portfolios have increased.
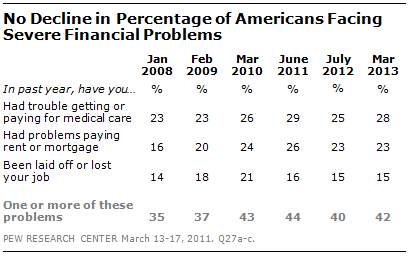
Yet the survey also finds that large percentages of Americans – particularly those with lower family incomes – continue to face severe economic and job-related problems. Nearly three-in-ten (28%) say they have had trouble getting or paying for medical care in the last year, while nearly as many (23%) report problems with paying their rent or mortgage. And 15% say they have been laid off or lost their job in the past year.
The share experiencing one or more of these problems is as high today as it was during the recession: Currently, 42% say they have encountered at least one of these problems, including 60% among those with annual family incomes of $30,000 or less.
When it comes to views of the national economy, most Americans do not think a recovery has taken hold. Just 27% say that the economy is recovering, while 31% say it will recover soon and 40% say it will be a long time before the economy recovers. These views have changed little over the past year.
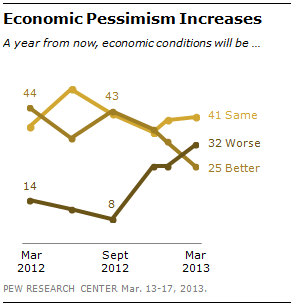
Looking ahead, the public’s forecast for the national economy has deteriorated. A year ago, nearly three times as many Americans expected the economy to be better as worse in the next year (44% vs. 14%). Today, just a quarter (25%) expect economic conditions to be better a year from now, while nearly a third (32%) say conditions will be worse.
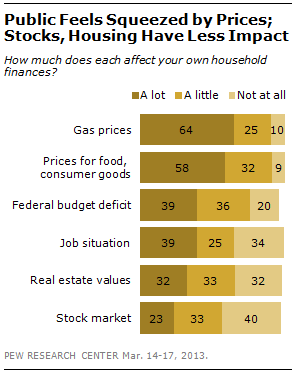
The market turnarounds are having a limited effect on the public’s economic outlook because they are not what affect people’s personal financial situation. When people are asked to consider the personal impact of different economic factors, just 32% say their household finances are affected a lot by real estate values, while even fewer (23%) say that the stock market has a major effect.
Instead, far more Americans say their households are affected by prices – both gas prices (64% a lot) and prices for food and consumer goods (58%). Prices are not only viewed as more important than real estate or the stock market but also the federal budget deficit and even the availability of jobs (39% each). And the news about prices is decidedly bad. The March update of the Pew Research Center’s track of what people are hearing about the economy found 74% saying the news about gas prices was mostly bad, and 52% saying the same about consumer prices.
Rising prices also now rank near the top of the public’s economic worries. Currently, 32% say the job situation is the national economic issue that worries them most, while 29% cite rising prices and 27% the federal budget deficit. Just three months ago, jobs far surpassed all other economic worries – 40% cited the job situation, 25% said the budget deficit and just 22% rising prices.
Section 1: Obama Job Approval, Confidence on Budget Deficit
Since December, Obama’s job approval has declined among Democrats and independents. His job approval among Republicans, already low in December (12% approve), remains about that low today (14%).
About three-quarters of Democrats (76%) approve of Obama’s job performance, down 12 points since December. His job approval has declined 13 points among conservative and moderate Democrats (from 83% to 70%) and eight points among liberal Democrats (from 95% to 87%).
Just 42% of independents approve of the way Obama is handling his job as president. In December, 53% approved of his job performance. The shift since then has come largely among Democratic-leaning independents: 71% approve today, down from 82% in December. There has been less change among Republican-leaning independents; just 15% currently say they approve of Obama’s job performance.
Confidence in Obama, Congressional Leaders on Budget Deficit
Despite his lower approval rating, Obama continues to engender more confidence on the federal budget deficit than
either GOP leaders in Congress or Democratic congressional leaders.
A majority (53%) says they have a great deal (22%) or a fair amount (31%) of confidence in Obama when it comes to dealing with the federal budget deficit. By contrast, 39% have at least a fair amount of confidence in congressional Republican leaders on the deficit and just 8% have a great deal of confidence. Democratic congressional leaders fair only slightly better: 45% have at least a fair amount of confidence in Democratic leaders; 11% have a great deal of confidence.
These views have changed little since September 2011, shortly after the contentious negotiations over raising the nation’s debt ceiling. At that time, 52% had a great deal or a fair amount of confidence in Obama on the deficit, 35% expressed that degree of confidence in GOP leaders and 43% had confidence in Democratic leaders.
Democrats express more confidence in Obama and Democratic leaders to deal with the budget deficit than Republicans express in GOP leaders. Fully 86% of Democrats have at least a fair amount of confidence in Obama, while 77% have that level of confidence in Democratic leaders. By contrast, 63% of Republicans have a great deal or a fair amount of confidence in GOP leaders to deal with the deficit.
Independents are divided when it comes to confidence in Obama’s handling of the deficit: 46% say they have at least a fair amount of confidence, while 52% have little or no confidence. About four-in-ten independents (42%) say they have at least a fair amount of confidence in GOP congressional leaders while 55% have little or no confidence.
Public Still Unwilling to Cut Entitlement Benefits to Reduce Deficit
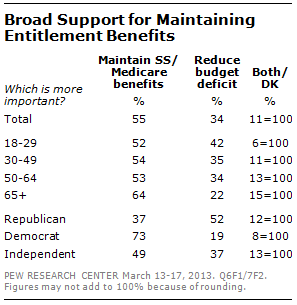
As Washington debates competing deficit reduction plans, the public continues to say it is more important to keep Social Security and Medicare benefits as they are than to take steps to reduce the budget deficit. There has been little change in these opinions over the past two years.
Majorities across all age groups say it is more important to maintain Social Security and Medicare benefits as they are than it is to take steps to reduce the budget deficit.
Nonetheless, those 65 and older are more likely than younger people to express this view.
By about four-to-one (73% to 19%), Democrats prioritize keeping Social Security and Medicare benefits as they are over taking steps to reduce the deficit. Independents, by 49% to 37%, also say it is more important to keep Social Security and Medicare benefits are they are. By contrast, Republicans give higher priority to deficit reduction: 52% say it is more important to take steps to cut the deficit, while 37% say it is more important to keep Social Security and Medicare benefits as they are.
Section 2: National Economy, Personal Finances
The public’s views of current economic conditions remain largely negative. And an increasing percentage thinks that the economy will be worse a year from now than it is today.
Overall, 43% rate current economic conditions in this country today as only fair, while nearly as many (40%) say they are poor. Very few describe economic conditions as excellent or good (16%).
Opinions about the national economy vary only modestly by family income: No more than about one-in-five in any income category rates the economy positively. There continue be partisan differences in views of economic conditions – Republicans (53%) and independents (42%) are more likely than Democrats (27%) to rate current economic conditions as poor.
Consistent with the negative economic ratings, only 27% say the economy is currently recovering. About three-in-ten (31%) say the economy is not yet recovering but will recover soon. A 40% plurality says it will be a long time before the economy recovers. These opinions have changed little since last October.
College graduates are more likely than those with lower levels of education to say the economy is currently recovering. Four-in-ten (40%) college graduates say the economy is recovering, compared with just 22% of those without a college degree.
Democrats mostly say the recovery is already underway (43%) or will occur soon (35%); just 20% say it will be a long time before the economy recovers. Nearly two-thirds of Republicans (65%) say it will be a long time before the economy recovers.
Declining Economic Optimism
For the first time in Obama’s presidency, more say they expect economic conditions to be worse a year from now (32%) than better (25%); 41% expect conditions to be about the same as now. In January, opinion was flipped, with somewhat more expecting the economy to be better in a year (33%) than worse (25%). Last March, 44% expected that economic conditions would be better in a year, while just 14% said they would be worse.
A year ago, about four-in-ten in all family income groups said they expected the economy to improve over the next year. Today, just 23% of those with incomes of $75,000 or more expect economic conditions to be better a year from now, as do 21% of those with incomes of between $30,000 and $75,000 and 31% of those with family incomes of less than $30,000.
As in recent years, Democrats have a more positive economic outlook than do independents or Republicans. But among all three groups, economic optimism has declined since last year. Currently, 40% of Democrats say they expect economic conditions to be better a year from now; 62% expressed that view last March. Among independents and Republicans, economic optimism also has declined since last March (by 18 points and 14 points, respectively).
Prices Surge as Top Economic Worry
In the current survey, 32% say the job situation is the national economic issue that most worries them. But nearly as
many (29%) cite rising prices, while 27% say that the federal budget deficit is their biggest economic worry. Just 9% say problems in the housing and financial markets are their top economic worry.
In December, 40% said jobs were the issue that most worried them, while 25% said the budget deficit and just 22% named rising prices; 10% said problems in the markets.
Rising prices are of particular concern to those with lower family incomes. For example, 33% of those earning less than $30,000 a year cite rising prices as their top economic worry, about the same percentage as cites the job situation (34%). By contrast, those with family incomes over $75,000 express more concern over the federal budget deficit (42%) and the job situation (27%) than over rising prices (19%).
Gas, Food Prices Seen as Having Biggest Impact on Finances
Nearly two-thirds (64%) say gas prices affect their household’s financial situation a lot, and 58% say prices for food and consumer goods affect them a lot. About four-in-ten say the federal budget deficit (39%) and the job situation (39%) affect their household finances a lot. Just 32% say real estate values in their area affect them a lot and even fewer (23%) say how
the stock market is doing affects their household financial situation a lot. Views of household financial pressures are little changed from when the question was last asked in April 2011.
Gas prices are an especially pressing concern for those with family incomes below $75,000 a year. Nearly seven-in-ten (68%) of those earning less than $75,000 a year say gas prices affect their household’s financial situation a lot, compared with 57% of those earning $75,000 or more. People with incomes of less than $75,000 also are more likely than those with higher incomes to say that their household finances are affected a lot by the availability of jobs in their area.
The performance of the stock market has much more of an impact on those earning $75,000 or more (37% say this affects their household a lot) than on those earning $30,000-$74,999 (19% a lot) and those earning under $30,000 (16% a lot). Still, even for those with higher incomes, more say gas and food prices impact their finances than the stock market.
Many Still Facing Financial Stress
More than four years after the start of the recession, most Americans with low family incomes are experiencing financial problems. Overall, 42% of the public say they have faced one or more of the following in the past year: difficulty obtaining or paying for medical care; problems paying their rent or mortgage; or losing a job.
Among those with family incomes of less than $30,000 a year, 60% have faced one or more of these problems in the past year. By comparison, only about a quarter (24%) of those with incomes of $75,000 or more report encountering at least one of these problems.
Blacks continue to be much more likely than whites to face these financial problems. About half of blacks (54%) say they have either had problems getting or paying for medical care, trouble affording their rent or mortgage or been laid off. By comparison, 38% of whites have faced one or more of these problems.
When it comes to overall assessments of their personal finances, impressions have changed little in recent years. Nearly four-in-ten (38%) say their finances are in excellent or good shape, while 41% say their finances are only fair and 21% say their finances are poor. While a majority (63%) of those with family incomes of at least $75,000 rate their finances positively, just 19% of those with incomes below $30,000 do the same.
Despite the gloomy outlook for the national economy, most people (60%) continue to say that their own finances will improve at least some over the course of the next year. While views of personal finances vary little across age groups, financial optimism continues to be more widespread among younger people: 77% of those younger than 30 expect their finances to improve, as do 70% of those 30 to 49; fewer than half (44%) of those 50 and older expect their finances to improve.
Investors See Market Gains, Remain Bullish
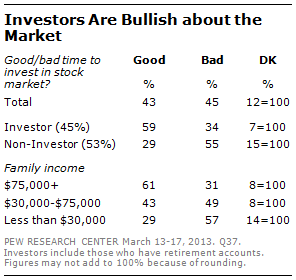
Americans who have money in the stock market (45% of the public) say they have reaped benefits from the market’s gains. Most of those with money invested in the market say their investments have gone up a little (58%) or a lot (13%) over the past year. Just 22% of investors say their portfolio has lost value over the past year.
Most investors say it is still a good time to invest in the market. Overall, the public is divided – 43% see this as a good time to invest while 45% say it is a bad time. Among investors, who are largely those with higher incomes, 59% see this as a good time to invest in the stock market while 34% say it is bad time. Among those with no money in the market, a majority (55%) says this is a bad time to invest in the market.
Lower-income Americans are generally unable to set aside savings for the future, whether they invest that money in the market or not. Overall, just 41% of Americans say they have been able to save money for the future while 58% say they have not. There are wide socio-economic divides in the percentages saying they have saved for the future: 63% of those with family incomes of $75,000 or more say they have saved for the future, compared with 24% of those with incomes below $30,000.
A related Pew Research Center report, published last October, found that Americans are more worried about their retirement finances today than they were at the end of the recession in 2009. (See “More Americans Worry about Financing Retirement,” Oct. 22, 2012.)
On the Job, Some Say the Workload is Rising
The percentage of Americans who say they have gotten a better job, or received a raise at their current job, has remained steady in recent years. About three-in-ten people (28%) –
including 44% of those working full or part-time – say they have gotten a better job or gotten a raise in the past year.
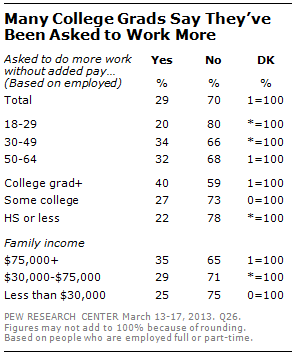
Some working people, especially those with more education, say that in the past year they have been asked to do more work or work additional hours without more pay. Overall, 29% of working people say they have been asked to do more work without additional pay in the past year. Among college graduates, including those with post-graduate degrees, 40% report being asked to work extra hours or do more work without more pay. That compares with 22% of those with no more than a high school education.
About the Surveys
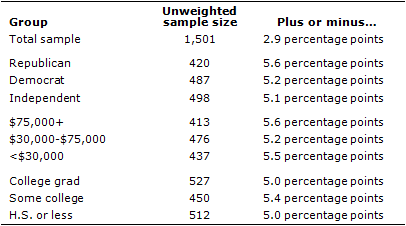
Most of the analysis in this report is based on telephone interviews conducted March 13-17, 2013, among a national sample of 1,501 adults, 18 years of age or older, living in all 50 U.S. states and the District of Columbia (750 respondents were interviewed on a landline telephone, and 751 were interviewed on a cell phone, including 385 who had no landline telephone). The survey was conducted by Abt SRBI. A combination of landline and cell phone random digit dial samples were used; both samples were provided by Survey Sampling International. Interviews were conducted in English and Spanish. Respondents in the landline sample were selected by randomly asking for the youngest adult male or female who is now at home. Interviews in the cell sample were conducted with the person who answered the phone, if that person was an adult 18 years of age or older. For detailed information about our survey methodology, see https://alpha.pewresearch.org/pewresearch-org/politics/methodology/.
The combined landline and cell phone sample are weighted using an iterative technique that matches gender, age, education, race, Hispanic origin and nativity and region to parameters from the 2011 Census Bureau’s American Community Survey and population density to parameters from the Decennial Census. The sample also is weighted to match current patterns of telephone status and relative usage of landline and cell phones (for those with both), based on extrapolations from the 2012 National Health Interview Survey. The weighting procedure also accounts for the fact that respondents with both landline and cell phones have a greater probability of being included in the combined sample and adjusts for household size among respondents with a landline phone. Sampling errors and statistical tests of significance take into account the effect of weighting. The following table shows the unweighted sample sizes and the error attributable to sampling that would be expected at the 95% level of confidence for different groups in the survey:
Sample sizes and sampling errors for other subgroups are available upon request.
Some of the analysis in this report is based on telephone interviews conducted March 14-17, 2013, among a national sample of 924 adults 18 years of age or older living in the continental United States (512 respondents were interviewed on a landline telephone, and 412 were interviewed on a cell phone, including 197 who had no landline telephone). The survey was conducted by interviewers at Princeton Data Source and Universal Survey under the direction of Princeton Survey Research Associates International. A combination of landline and cell phone random digit dial samples were used; both samples were provided by Survey Sampling International. Interviews were conducted in English. Respondents in the landline sample were selected by randomly asking for the youngest adult male or female who is now at home. Interviews in the cell sample were conducted with the person who answered the phone, if that person was an adult 18 years of age or older. For detailed information about our survey methodology, see: https://alpha.pewresearch.org/pewresearch-org/politics/methodology/.
The combined landline and cell phone sample are weighted using an iterative technique that matches gender, age, education, race, Hispanic origin and region to parameters from the 2011 Census Bureau’s American Community Survey and population density to parameters from the Decennial Census. The sample also is weighted to match current patterns of telephone status, based on extrapolations from the 2012 National Health Interview Survey. The weighting procedure also accounts for the fact that respondents with both landline and cell phones have a greater probability of being included in the combined sample and adjusts for household size among respondents with a landline phone. Sampling errors and statistical tests of significance take into account the effect of weighting. The following table shows the unweighted sample sizes and the error attributable to sampling that would be expected at the 95% level of confidence for different groups in the survey:
Sample sizes and sampling errors for other subgroups are available upon request.
In addition to sampling error, one should bear in mind that question wording and practical difficulties in conducting surveys can introduce error or bias into the findings of opinion polls.