Pew Research Center

FOR RELEASE JANUARY 17, 2013

Obama in Strong Position at Start of Second Term

Support for Compromise Rises, Except Among Republicans

FOR MEDIA OR OTHER INQUIRIES:

Communications Department
202.419.4372
www.pewresearch.org

RECOMMENDED CITATION

Pew Research Center, January 2013, "Obama in Strong Position at Start of Second Term"

About Pew Research Center

Pew Research Center is a nonpartisan, nonadvocacy fact tank that informs the public about the issues, attitudes and trends shaping the world. It does not take policy positions. The Center conducts public opinion polling, demographic research, computational social science research and other data-driven research. It studies politics and policy; news habits and media; the internet and technology; religion; race and ethnicity; international affairs; social, demographic and economic trends; science; research methodology and data science; and immigration and migration. Pew Research Center is a subsidiary of The Pew Charitable Trusts, its primary funder.

© Pew Research Center 2026

Table of contents

  • About Pew Research Center
  • Obama in Strong Position at Start of Second Term
  • Section 1: Obama Job Rating, Personal Traits; Views of Michelle Obama
  • Section 2: Views of Congress and the Parties
  • Section 3: Opinions of Biden, Kerry, Hagel, Christie and Bloomberg
  • About the Survey

Obama in Strong Position at Start of Second Term

Support for Compromise Rises, Except Among Republicans

Overview
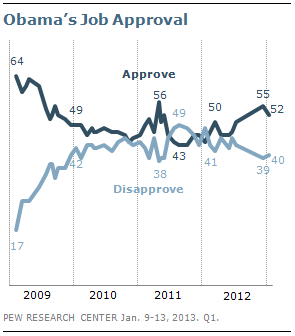
As he prepares for his second inauguration, Barack Obama is in a stronger position with the public than he was over much of his first term. At 52%, his job approval rating is among the highest since the early months of his presidency. His personal favorability, currently 59%, has rebounded from a low of 50% in the fall campaign. And increasing percentages describe him as a strong leader, able to get things done and as someone who stands up for his beliefs.

Obama’s political advantage is enhanced by the poor standing of his Republican counterparts. The latest national survey by the Pew Research Center for the People & the Press, conducted Jan. 9-13 among 1,502 adults finds that both House Speaker John Boehner and
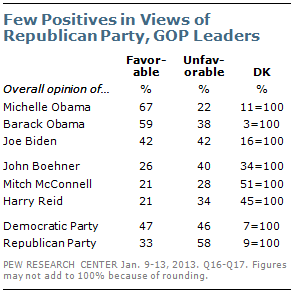
Senate Minority Leader Mitch McConnell are viewed more unfavorably than favorably.

The Republican Party’s image, which reached a recent high of 42% favorable following the GOP convention this past summer, has fallen once again to a low of just 33%. Much of this decline has come among Republicans themselves. Favorable opinions of the GOP among Republicans have fallen 20 points since September (from 89% to 69%) and are now as low as at any point during the past 20 years.
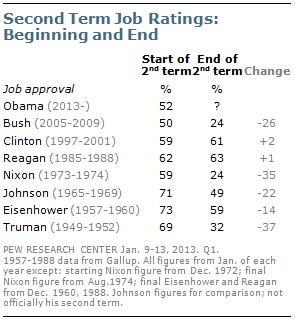
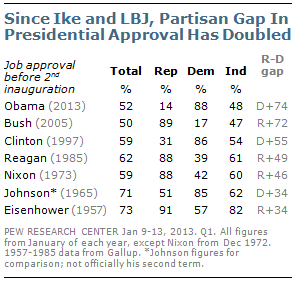
While his personal image is strong, Obama’s current j0b rating is not high compared with other two-term presidents since World War II. Among presidents dating back to Harry S. Truman, only George W. Bush began his second term with a rating about as low as Obama’s (50% approval in January 2005). To a degree, this reflects the partisan polarization in opinions about both Obama and Bush; Obama’s current rating among Republicans (14% approve) is about the same as Bush’s among Democrats eight years ago (17%).

Among recent two-term presidents, none has had a significantly better job approval mark at the end of his presidency than at the start of his second term.
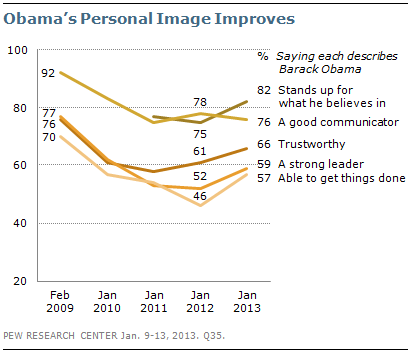
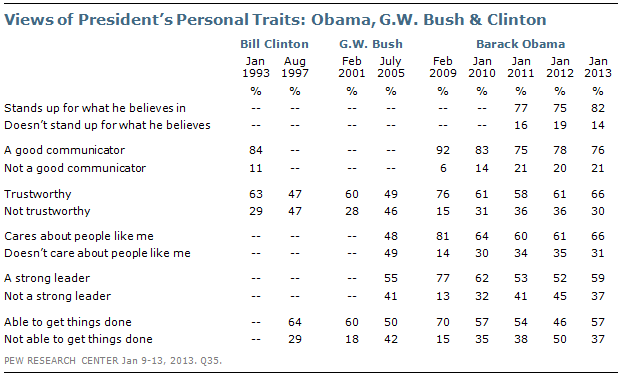
Since Obama entered the White House four years ago, his strongest ratings have typically been on his personal traits, and he has improved his standing on these measures over the past year.

Fully 82% say that Obama stands up for what he believes in; 75% said this a year ago. Nearly six-in-ten (57%) say Obama is able to get things done, up 11 points from a year ago, and 59% say he is a strong leader, up seven points since then.

Nonetheless, these personal ratings are all far lower than they were shortly after he took office four years ago. A few weeks after his inauguration, 70% said he was able to get things done and even higher percentages gave him positive ratings for other attributes.
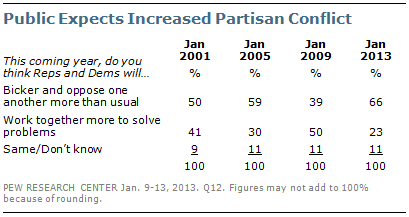
Obama also faces a far more skeptical and frustrated public today than he did four years ago. Just 33% expect economic conditions to get better over the coming year – that figure was 43% in December 2008. And the public is pessimistic about the prospects for bipartisan cooperation in Washington. Just 23% expect Republicans and Democrats will work together more in the coming year, less than half the percentage that expressed that view in January 2009 (50%).

After a series of bruising political battles over the
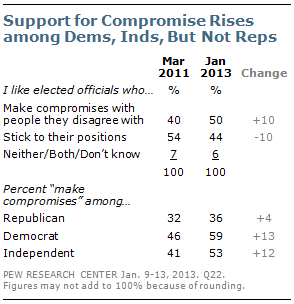
past few years, the public’s desire for political compromise in Washington has increased notably. In March 2011, soon after Republicans gained a majority in the House, 54% said they liked elected officials who stuck to their positions, while 40% liked politicians who made compromises with people they disagreed with. Today, 50% say they like leaders who compromise, and 44% like those who stick to their positions.

The percentages of Democrats and independents saying they prefer politicians who compromise has increased over the past two years. Currently, 59% of Democrats say they like elected officials who make compromises, up from 46% in March 2011. Similarly, there has been a 12-point increase in the percentage of independents expressing a preference for politicians who compromise (from 41% to 53%).

By contrast, Republicans’ opinions are largely unchanged from two years ago. Currently, 55% say they like elected officials who stick to their positions compared with 36% who like elected officials who make compromises. Among conservative Republicans, about twice as many prefer politicians who stick to their positions than those who compromise (60% vs. 31%).

Other Important Findings

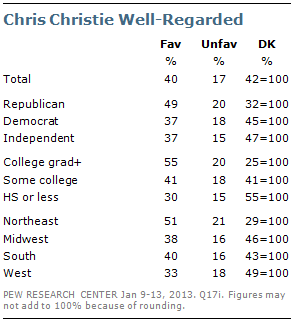
Christie’s Crossover Appeal. Favorable opinions of the New Jersey governor outnumber unfavorable views by two-to-one – among Democrats. He is even more highly regarded among Republicans.

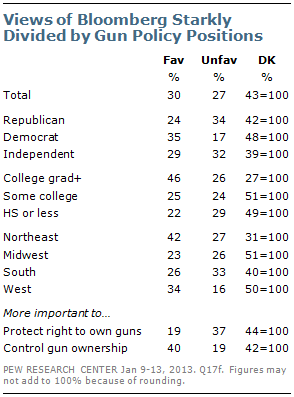
Mixed Views of Bloomberg. Impressions of New York Mayor Michael Bloomberg are more evenly divided. Notably, those who favor gun control view Bloomberg much more favorably than do supporters of gun rights.

Obama’s Legacy – TBD. A third of Americans (33%) say that in the long run Obama will be a successful president, while 26% say he will be unsuccessful. But a plurality (39%) says it is too soon to tell. Views about Bush were similar at the start of his second term.

Michelle’s Strong Image. While Barack Obama’s favorability rating has improved, the first lady is still more popular than her husband. Currently, 67% view Michelle Obama favorably, while just 22% have an unfavorable opinion of her.
Section 1: Obama Job Rating, Personal Traits; Views of Michelle Obama

Barack Obama is in a relatively strong position heading into his second term. His job approval now stands at 52% – among the highest since his first year in office. A year ago, 44% said they approved of the way Obama was handling his job as president.

Both Democrats and independents offer more positive assessments than they did a year ago. Fully 88% of Democrats approve of the job he is doing, up nine points from January 2012. Nearly half of independents (48%) now approve of the way the president is handling his job. In January 2012, just 37% of independents approved while 56% disapproved.

Obama’s personal favorability rating also has improved from 51% a year ago to 59% today. And more see the president as a strong leader and able to get things done. A 59% majority say Obama is a strong leader, up from 52% a year ago. And 57% say the president is able to get things done, up 11 points from January 2012.

While Republicans have changed little in their views of Obama from a year ago, more Democrats say he is a strong leader (up nine points to 89%) and is able to get things done (up 16 points to 85%). Independents also offer more positive assessments of Obama; 55% say he is a strong leader, an 11-point increase from last year. About half (51%) of independents say he is able to get things done, up from 41% a year ago.

At the same time, Obama’s job approval is lower than other presidents at the start of their second terms dating back to Dwight Eisenhower, with the exception of George W. Bush. Obama’s 52% job approval is about the same as Bush’s was in January 2005 (50%).

To a large extent, Obama’s and Bush’s lower approval ratings reflect the increased polarization during their presidencies (for more see, Partisan Polarization Surges in Bush, Obama Years). Just 14% of Republicans approve of the way Obama is handling his job as president. That is similar to the 17% of Democrats who approved of Bush’s job performance in January 2005, but both are far lower than the ratings their predecessors received from members of the opposite party. In addition, independents rate Obama and Bush lower than most other presidents at their start of their second term.

Even in this hyper-partisan environment, however, Republicans do give some positive assessments of the president. Fully 64% of Republicans say the president stands up for his beliefs and 59% say he is a good communicator. Republicans are more critical when it comes to other traits. Only about a third say Obama is trustworthy or cares about people like them (32% each) and just 25% say he is a strong leader.

Democrats offer very positive ratings of Obama on all of these traits. Nearly all say he stands up for what he believes in (96%), is trustworthy (95%) and that he cares about people like them (95%). Nine-in-ten (90%) say he is a good communicator, and nearly as many say he is a strong leader (89%) and able to get things done (85%).

The views of independents largely mirror the public overall. Most say he stands up for what he believes in (83%) and that the president is a good communicator (75%). Majorities also say he cares about people like them (65%) and is trustworthy (63%).

In historical context, these are relatively good measures for Obama when compared with other recent presidents early in their second terms. About six-months into their second term, only about half said that Bill Clinton (47%) and Bush (49%) were trustworthy, compared with 66% who say this about Obama. In 1997, a majority (64%) said that Clinton was able to get things done. Today, slightly fewer (57%) say this about Obama. The public was more divided about Bush’s effectiveness in July 2005: 50% said he was able to get things done while 42% thought he was not able to get things done.

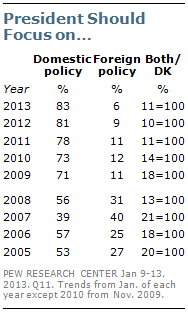
One area where there is overwhelming partisan agreement is on whether the president should focus on domestic or foreign policy right now. Overall, 83% say the president should focus his energies on domestic issues; just 6% say foreign policy should be the president’s focus right now. These numbers are largely unchanged from a year ago. Nearly nine-in-ten (88%) Democrats and about eight-in-ten Republicans (81%) and independents (83%) say that domestic policy is most important at this time.

During George W. Bush’s tenure, far more said foreign policy should be the priority than do so now. But even at the start of his second term, 53% said he should focus on domestic policy while 27% said foreign policy should be the priority.

Favorability of the Obamas

Barack Obama is viewed more favorably at the start of his second term than he was during the 2012 campaign. By a 59% to 38% margin more now view the president favorably than unfavorably. However, views of the president are more negative than they were just before taking office in January 2009 when 79% had a favorable view of the incoming president.

Michelle Obama continues to be viewed more positively than her husband. Two-thirds (67%) of Americans say they have a favorable opinion of the first lady, while just 22% have an unfavorable opinion. These views have changed little over the past year and are comparable to the ratings she received four years ago.

The president’s favorability ratings are particularly high among blacks (90% favorable), Hispanics (85% favorable) and young people (74% favorable). Fully 93% of Democrats view Obama favorably, compared with just 21% of Republicans. Among independents, more view him favorably than unfavorably by a 55% to 40% margin.

Impressions of the first lady are quite positive among most groups. About nine-in-ten Democrats (91%), as well as 65% of independents view her favorably. Republicans are more divided: 42% have a favorable impression of Michelle Obama while 45% have an unfavorable view.

Among Republicans there are differences in opinion by ideology. About half (52%) of moderate and liberal Republicans view the first lady favorably compared with just 38% of conservative Republicans.

Section 2: Views of Congress and the Parties

As the 113th Congress gets underway, the favorable ratings for the legislative branch match lows from more than two decades of Pew Research Center surveys. Just 23% of Americans say they have a favorable opinion of Congress. Nearly seven-in-ten (68%) have an unfavorable view.

Four years ago, as Obama came into office, 40% said they had a favorable opinion of Congress, while about half (52%) had an unfavorable one. Opinion improved somewhat in the spring of 2009 – 50% offered a favorable view of Congress that April – but has hovered near long-time lows for much of the past two years. The ratings have fluctuated only slightly in recent months, despite the prolonged standoff over the fiscal cliff.

Democrats, Republicans and independents all hold broadly negative views of Congress: 61% of Democrats say they have an unfavorable view of Congress, compared with 72% of Republicans and 73% of independents.

The favorability ratings for three top congressional leaders – John Boehner, Harry Reid and Mitch McConnell –also are on balance, negative. Opinions of these three leaders, like views of Obama and Joe Biden, are little changed following passage of legislation to avert the fiscal cliff.

About a quarter (26%) have a favorable impression of House Speaker John Boehner, 40% offered an unfavorable view and 34% do not give a rating. About two-in-ten (21%) say they have a favorable view of Senate Majority Leader Harry Reid; 34% express an unfavorable view and 45% offer no opinion. The numbers are similar for Senate Minority Leader Mitch McConnell: 21% have a favorable view, 28% unfavorable and 52% offer no opinion.

Republicans, on balance, offer more favorable than unfavorable impressions of Boehner (45% vs. 30%), though 25% offer no opinion. Opinion among Republicans about McConnell is more evenly divided: 25% favorable vs. 25% unfavorable. About half (49%) offer no opinion.

Democrats also offer divided impressions of Reid; 29% have a favorable opinion of the majority leader and 20% have an unfavorable one. About half (51%) offer no opinion.

GOP Image Woes Persist

Just a third of Americans (33%) say they have a favorable opinion of the Republican Party, about the same as the lows recorded in August 2011 (34%). Nearly six-in-ten (58%) say they have an unfavorable view of the GOP. Four years ago, opinion was only slightly better. In January 2009, as Obama started his first term, 40% had a favorable opinion of the Republican Party, while 55% held an unfavorable one.

Currently, the public is divided in views of the Democratic Party: 47% have a favorable opinion, while 46% have an unfavorable one. Impressions of the Democrats were much more positive in early 2009. That January, 62% said they had a favorable view of the party, while 32% reported an unfavorable view.

The public’s views of the parties’ ideologies have changed little since the summer of 2011. Currently, 23% see the Republican Party as very conservative, while 32% see it as conservative. About two-in-ten (22%) describe the Republican Party as moderate, 8% say liberal and 6% say very liberal. The percentage that sees the GOP as very conservative, while little changed since August 2011, is up from 17% in June 2010.

Views of the Democratic Party’s ideology also have remained fairly stable; 22% see it as very liberal, 31% say liberal and 27% say moderate. One-in-ten (11%) say it is conservative, while 2% say it is very conservative.

Shifting Views of Political Compromise

When Americans are asked whether they prefer elected officials who stick to their positions or those willing to compromise, the balance of opinion has shifted since early 2011. Currently, 50% say they like elected officials who make compromises with people they disagree with rather than elected officials who stick to their positions (44%). In March 2011, 54% said they preferred those who stick to their positions and 40% preferred those who compromise.

While a majority of Republicans say they prefer elected officials who stick to their positions (55% vs. 36%), the balance is flipped among Democrats and independents. About six-in-ten Democrat (59%) now say they like elected officials who compromise with people they disagree with, while 37% prefer officials who stick to their positions. Among independents, 53% like those who compromise, while 42% prefer those who stick to their positions.

By a wide margin (69% to 27%), liberal Democrats prefer politicians who make compromises with those whom they disagree. By contrast, 60% of conservative Republicans like elected officials who stick to their positions, while just 31% like those who compromise.

Among independents, there are wide differences tied to party leaning. About six-in-ten independents who lean Democratic (61%) say they like those who compromise, compared with 46% of those who lean Republican.

Public Sees More Partisan Conflict Ahead

Just 23% of Americans say they expect Republicans and Democrats to work together to solve problems this year. That’s about half the number that said this as Obama took office in January 2009 (50%) and down 7 points since the start of 2011.

Two-thirds (66%) say Republicans and Democrats in Washington are likely to bicker and oppose one another more than usual. Just 39% said this in January 2009. Still, that number has changed little in the past two years. It stood at 63% in January 2011.

Among partisans, 73% of Republicans expect the parties to fight more than usual, compared with 59% of Democrats and 68% of independents. Just 17% of Republicans say the parties will work together more. That is down from 30% in early 2011 and 40% in early 2009. A third of Democrats (33%) agree, little changed from early 2011 (28%), but down sharply from early 2009 (59%). Among independents, 20% say the parties will work together more; nearly half (49%) said that in early 2009.

Views of Parties on Issues

Democrats hold an edge when the public is asked which party can do a better job dealing with social welfare programs such as Social Security and Medicare. The parties run about even on which would do a better job dealing with the deficit and which would better represent their views when it comes to government spending.

More than four-in-ten (44%) say the Democratic Party can do a better job dealing with Medicare, while 36% choose the Republican Party. The Democratic advantage is down slightly from December.

On the other issues tested, changes were modest. Democrats maintain a nine-point edge on dealing with Social Security (45% vs. 36%). On taxes, 44% say the Democrats can do a better job, while 38% say Republicans can.

When it comes to dealing with the deficit, the parties run about even: 40% say the Republicans can do the better job, while 39% say the Democrats can. And when asked which party better represents your views on government spending, the public is about evenly divided: 42% say the Republicans and 36% say the Democrats.

Section 3: Opinions of Biden, Kerry, Hagel, Christie and Bloomberg

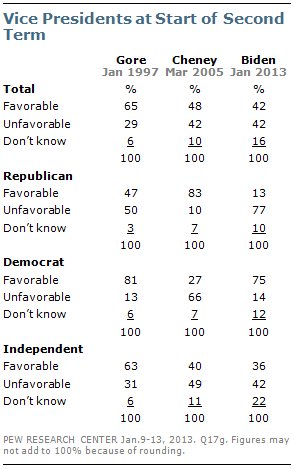
As he heads into his second term as vice president, the public’s impression of Joe Biden is mixed: 42% have a favorable opinion, while the same percentage views him unfavorably. Opinions of Biden are little changed over the past year.

Biden’s current rating is somewhat less favorable than the rating for his predecessor, Dick Cheney, early in the Bush administration’s second term: In March 2005, 48% of the public had a

favorable opinion of Cheney. Al Gore’s favorability rating on the eve of his second term as Bill Clinton’s vice president was far more positive than either Biden’s or Cheney’s: in January 1997, 65% viewed Gore favorably while just 29% viewed him unfavorably.

Opinions of Biden are starkly divided along partisan lines. Views among the opposition party have become more negative with each successive vice president. Today, just 13% of Republicans view Biden favorably. That compares to 27% of Democrats who had a favorable opinion of Cheney in 2005, although Cheney’s favorable rating among Democrats would drop to 12% by the spring of 2006. In 1997, nearly half (47%) of Republicans viewed Gore positively; his rating among the GOP also dropped, to a low of 22% in September 1997.

Biden fares about as well among independents as Cheney did eight years ago, with opinions divided. Three-quarters of Democrats (75%) view Biden favorably today, comparable to Democrats’ ratings of Gore at this point in his term. Cheney performed somewhat better among Republicans in 2005.

Mixed Assessments of John Kerry, Chuck Hagel

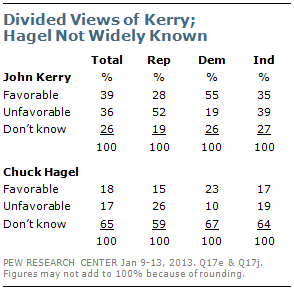
Barack Obama’s nominees for secretary of state and secretary of defense both receive mixed ratings from the public. John Kerry, the better known of the two, is viewed favorably by 39% of the public, while a comparable number (36%) view him unfavorably. Just 35% of the public offers an opinion of Chuck Hagel, Obama’s nominee to head the Department of Defense. Those that do rate Hagel are about equally likely to view him favorably (18%) as unfavorably (17%).

Partisans hold differing opinions of the two nominees. While a majority of Democrats (55%) have a favorable impression of Kerry and just 19% say they have an unfavorable view, Republicans see the potential secretary of state more negatively: 52% have an unfavorable opinion of Kerry and just 28% have a favorable impression. Independents are divided in their assessments of Kerry (35% favorable, 39% unfavorable).

Despite his lower profile, the pattern of partisan opinion is similar for Hagel. By about two-to-one (23% vs. 10%), Democrats view Hagel favorably. Among Republicans, the balance of opinion about Hagel is negative (26% unfavorable, 15% favorable). Hagel receives mixed ratings from independents (17% favorable, 19% unfavorable).

Both Kerry and Hagel elicit particularly negative reactions from Republicans and Republican-leaning independents who agree with the Tea Party. Fully 70% of Tea Party Republicans have an unfavorable opinion of Kerry; that compares with 46% of Republicans and GOP leaners who either disagree with the Tea Party or have no opinion of it.

Tea Party Republicans are more familiar with Hagel than are non-Tea Party Republicans and have a much more negative opinion of him. Nearly half of Tea Party Republicans (47%) view him unfavorably, while just 6% view him favorably. Among non-Tea Party Republicans, opinions are divided (20% favorable, 19% unfavorable).

Positive Ratings for Chris Christie Cross Partisan Lines

Chris Christie garners positive ratings from the American public. By about two-to-one, more have a favorable impression (40%) than an unfavorable impression (17%) of the Republican

New Jersey governor, although about four-in-ten (42%) do not offer a rating.

While Christie’s ratings are highest in the northeast, where about half (51%) rate him favorably, this is largely due to his higher profile in his home region (northeasterners are more likely than others to offer a rating). The balance of opinion about Christie is consistently positive across regions, as well as most other demographic groups.

And Christie is an increasingly rare political figure today: He is viewed positively by both Republicans and Democrats. Although more Republicans than Democrats or independents offer a rating for Christie, among those who do, Christie’s ratings are comparably positive across all three groups.

Michael Bloomberg Fares Well among College Grads, Democrats

New York City Mayor Michael Bloomberg gets mixed ratings from the public: 30% have a favorable impression of him, 27% have an unfavorable impression. About four-in-ten (43%) do not offer an opinion.

Despite his past Republican party affiliation and current independent status, Bloomberg is viewed positively among Democrats. By roughly two-to-one, more Democrats offer a favorable than unfavorable rating of Bloomberg (35% vs. 17%). Both Republicans and independents are more divided in their ratings.

Bloomberg’s ratings also vary by region and education. Bloomberg fares best in the Northeast, where he is best known, and the West. Midwesterners and Southerners are more divided in their assessments. College graduates rate Bloomberg positively (46% favorable vs. 26% unfavorable), while those with less education are less likely to provide a rating and more divided in their assessments.

Perhaps reflecting Bloomberg’s outspoken positions in favor of increasing gun controls, 37% of those who prioritize protecting Americans’ right to own guns over controlling gun ownership view him unfavorably while just 19% view him favorably. Among those who prioritize gun control, opinions are reversed (40% favorable, 19% unfavorable).

About the Survey

The analysis in this report is based on telephone interviews conducted January 9-13, 2013 among a national sample of 1,502 adults, 18 years of age or older, living in all 50 U.S. states and the District of Columbia (752 respondents were interviewed on a landline telephone, and 750 were interviewed on a cell phone, including 369 who had no landline telephone). The survey was conducted by interviewers at Princeton Data Source under the direction of Princeton Survey Research Associates International. A combination of landline and cell phone random digit dial samples were used; both samples were provided by Survey Sampling International. Interviews were conducted in English and Spanish. Respondents in the landline sample were selected by randomly asking for the youngest adult male or female who is now at home. Interviews in the cell sample were conducted with the person who answered the phone, if that person was an adult 18 years of age or older.

The combined landline and cell phone sample are weighted using an iterative technique that matches gender, age, education, race, Hispanic origin and nativity and region to parameters from the 2011 Census Bureau’s American Community Survey and population density to parameters from the Decennial Census. The sample also is weighted to match current patterns of telephone status and relative usage of landline and cell phones (for those with both), based on extrapolations from the 2012 National Health Interview Survey. The weighting procedure also accounts for the fact that respondents with both landline and cell phones have a greater probability of being included in the combined sample and adjusts for household size among respondents with a landline phone. Sampling errors and statistical tests of significance take into account the effect of weighting. The following table shows the sample sizes and the error attributable to sampling that would be expected at the 95% level of confidence for different groups in the survey:

Sample sizes and sampling errors for other subgroups are available upon request.

In addition to sampling error, one should bear in mind that question wording and practical difficulties in conducting surveys can introduce error or bias into the findings of opinion polls.