
Pew Research Center

FOR RELEASE OCTOBER 10, 2012

Biden Viewed Unfavorably, Divided Opinions about Ryan

No Clear Winner Expected in VP Debate

FOR MEDIA OR OTHER INQUIRIES:

Communications Department
202.419.4372
www.pewresearch.org

RECOMMENDED CITATION

Pew Research Center, October 2012, "Biden Viewed Unfavorably, Divided Opinions about Ryan"

About Pew Research Center

Pew Research Center is a nonpartisan, nonadvocacy fact tank that informs the public about the issues, attitudes and trends shaping the world. It does not take policy positions. The Center conducts public opinion polling, demographic research, computational social science research and other data-driven research. It studies politics and policy; news habits and media; the internet and technology; religion; race and ethnicity; international affairs; social, demographic and economic trends; science; research methodology and data science; and immigration and migration. Pew Research Center is a subsidiary of The Pew Charitable Trusts, its primary funder.

© Pew Research Center 2026

Table of contents

  • About Pew Research Center
  • Biden Viewed Unfavorably, Divided Opinions about Ryan
  • About the Surveys

Biden Viewed Unfavorably, Divided Opinions about Ryan

No Clear Winner Expected in VP Debate

Overview

Ahead of Thursday’s vice presidential debate, more voters view Joe Biden unfavorably than favorably, while opinions about Paul Ryan are more evenly divided. Biden’s image is far less
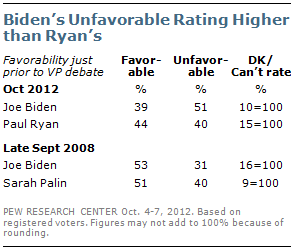
positive than it was shortly before his 2008 debate with Sarah Palin; Ryan is viewed less favorably than Palin was just prior to the last vice-presidential debate.

The national survey by the Pew Research Center for the People & the Press, conducted Oct. 4-7 among 1,511 adults, including 1,201 registered voters, finds that 39% of voters view Biden favorably, while 51% offer an unfavorable impression of the vice president. Just more than four-in-ten (44%) view Ryan favorably, while about as many (40%) have an unfavorable view.

A separate survey, also conducted Oct. 4-7, among 1,006 adults and 812 registered voters, finds that voters are divided over who will do better in Thursday’s vice presidential debate. Four-in-ten (40%) say Ryan will do a better job while 34% expect Biden to do better.

Biden’s image is little changed since September, but he is viewed less favorably than before his faceoff against Palin four years ago. In late September 2008, 53% of voters viewed Biden favorably and just 31% expressed an unfavorable opinion. At the time, Palin’s favorable rating was higher than Ryan’s is today (51% vs. 44%).

Surveys conducted by the Pew Research Center and the Washington Post before the party conventions this summer found that people

have very different one-word impressions of the vice presidential candidates. More people used negative words than positive ones to describe Biden, while one-word impressions of Ryan were mixed.

The current survey finds that just 35% of independent voters have a favorable opinion of Biden, while 52% view him unfavorably. As many independent voters view Ryan favorably (42%) as unfavorably (42%).
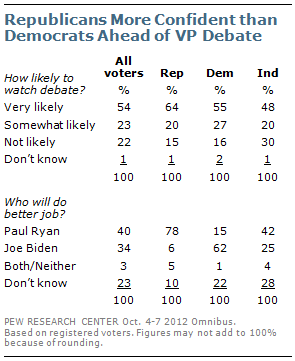
The separate survey on expectations for Thursday’s debate finds that 54% of voters say they are very likely to watch the debate. Interest in the upcoming debate is far lower than it was for the Biden-Palin debate four years ago (69% very likely to watch), though higher than for the debate between Dick Cheney and John Edwards in 2oo4 (41% very likely).

By a 42% to 25% margin, more independents expect Ryan to do better than Biden in the debate. Most members of both parties predict victory for their party’s candidate, but Republicans are more confident than Democrats. Nearly eight-in-ten (78%) Republican voters say Ryan will do the better job in the debate. Fewer Democrats (62%) expect Biden to do better.
About the Surveys

Some of the analysis in this report is based on telephone interviews conducted October 4-7, 2012, among a national sample of 1,511 adults, 18 years of age or older, living in all 50 U.S. states and the District of Columbia (906 respondents were interviewed on a landline telephone, and 605 were interviewed on a cell phone, including 291 who had no landline telephone). Data collection was managed by Princeton Survey Research Associates International and conducted by interviewers at Princeton Data Source. A combination of landline and cell phone random digit dial samples were used; both samples were provided by Survey Sampling International. Interviews were conducted in English and Spanish. Respondents in the landline sample were selected by randomly asking for the youngest adult male or female who is now at home. Interviews in the cell sample were conducted with the person who answered the phone, if that person was an adult 18 years of age or older. For detailed information about our survey methodology, see https://alpha.pewresearch.org/pewresearch-org/politics/methodology/

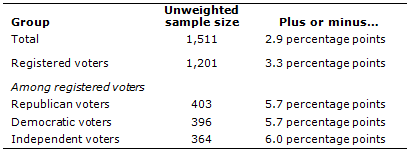
The combined landline and cell phone sample are weighted using an iterative technique that matches gender, age, education, race, Hispanic origin and nativity and region to parameters from the March 2011 Census Bureau’s Current Population Survey and population density to parameters from the 2010 Decennial Census. The sample also is weighted to match current patterns of telephone status and relative usage of landline and cell phones (for those with both), based on extrapolations from the 2011 National Health Interview Survey. The weighting procedure also accounts for the fact that respondents with both landline and cell phones have a greater probability of being included in the combined sample and adjusts for household size among respondents with a landline phone. Sampling errors and statistical tests of significance take into account the effect of weighting. The following table shows the unweighted sample sizes and the error attributable to sampling that would be expected at the 95% level of confidence for different groups in the survey:

Sample sizes and sampling errors for other subgroups are available upon request.

Additional analysis in this report is based on telephone interviews conducted October 4-7, 2012 among a national sample of 1,006 adults 18 years of age or older living in the continental United States (601 respondents were interviewed on a landline telephone, and 405 were interviewed on a cell phone, including 206 who had no landline telephone). The survey was conducted by interviewers at Princeton Data Source under the direction of Princeton Survey Research Associates International. A combination of landline and cell phone random digit dial samples were used; both samples were provided by Survey Sampling International. Interviews were conducted in English. Respondents in the landline sample were selected by randomly asking for the youngest adult male or female who is now at home. Interviews in the cell sample were conducted with the person who answered the phone, if that person was an adult 18 years of age or older. For detailed information about our survey methodology, see: https://alpha.pewresearch.org/pewresearch-org/politics/methodology/.

The combined landline and cell phone sample are weighted using an iterative technique that matches gender, age, education, race, Hispanic origin and region to parameters from the March 2011 Census Bureau’s Current Population Survey and population density to parameters from the Decennial Census. The sample also is weighted to match current patterns of telephone status, based on extrapolations from the 2011 National Health Interview Survey. The weighting procedure also accounts for the fact that respondents with both landline and cell phones have a greater probability of being included in the combined sample and adjusts for household size among respondents with a landline phone. Sampling errors and statistical tests of significance take into account the effect of weighting. The following table shows the unweighted sample sizes and the error attributable to sampling that would be expected at the 95% level of confidence for different groups in the survey:

Sample sizes and sampling errors for other subgroups are available upon request.

In addition to sampling error, one should bear in mind that question wording and practical difficulties in conducting surveys can introduce error or bias into the findings of opinion polls.