
Pew Research Center

FOR RELEASE JUNE 4, 2012

Partisan Polarization Surges in Bush, Obama Years

Trends in American Values: 1987-2012

FOR MEDIA OR OTHER INQUIRIES:

Communications Department
202.419.4372
www.pewresearch.org

RECOMMENDED CITATION

Pew Research Center, June 2012, "Partisan Polarization Surges in Bush, Obama Years"

About Pew Research Center

Pew Research Center is a nonpartisan, nonadvocacy fact tank that informs the public about the issues, attitudes and trends shaping the world. It does not take policy positions. The Center conducts public opinion polling, demographic research, computational social science research and other data-driven research. It studies politics and policy; news habits and media; the internet and technology; religion; race and ethnicity; international affairs; social, demographic and economic trends; science; research methodology and data science; and immigration and migration. Pew Research Center is a subsidiary of The Pew Charitable Trusts, its primary funder.

© Pew Research Center 2026

Table of contents

  • About Pew Research Center
  • Partisan Polarization Surges in Bush, Obama Years
  • Section 1: Understanding the Partisan Divide Over American Values
  • Section 2: Demographics and American Values
  • Section 3: Values About Economic Inequality and Individual Opportunity
  • Section 4: Values About Government and the Social Safety Net
  • Section 5: Values About Business, Wall Street and Labor
  • Section 6: Religion and Social Values
  • Section 7: Values About Foreign Policy and Terrorism
  • Section 8: Values About Immigration and Race
  • Section 9: Trends in Party Affiliation
  • About the Values Survey Data

Partisan Polarization Surges in Bush, Obama Years

Trends in American Values: 1987-2012

Overview

As Americans head to the polls this November, their values and basic beliefs are more polarized along partisan lines than at any point in the past 25 years. Unlike in 1987, when this series of surveys began, the values gap between Republicans and Democrats is now greater than gender, age, race or class divides.
Widening Partisan Differences in Political Values: 1987-2012

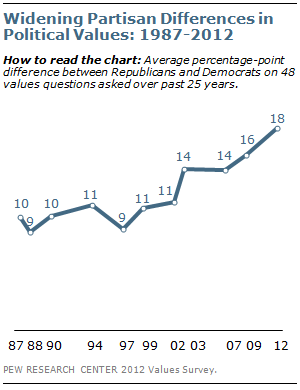
Overall, there has been much more stability than change across the 48 political values measures that the Pew Research Center has tracked since 1987. But the average partisan gap has nearly doubled over this 25-year period – from 10 percentage points in 1987 to 18 percentage points in the new study.

Nearly all of the increases have occurred during the presidencies of George W. Bush and Barack Obama. During this period, both parties’ bases have often been critical of their parties for not standing up for their traditional positions. Currently, 71% of Republicans and 58% of Democrats say their parties have not done a good job in this regard.
Partisan Gap Grows While Other Divides Are Stable

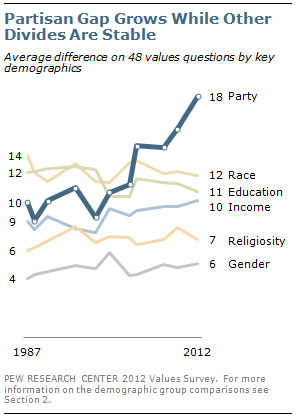
With regard to the broad spectrum of values, basic demographic divisions – along lines such as gender, race, ethnicity, religion and class – are no wider than they have ever been. Men and women, whites, blacks and Hispanics, the highly religious and the less religious, and those with more and less education differ in many respects. However, these differences have not grown in recent years, and for the most part pale in comparison to the overwhelming partisan divide we see today.

In recent years, both parties have become smaller and more ideologically homogeneous. Republicans are dominated by self-described conservatives, while a smaller but growing number of Democrats call themselves liberals. Among Republicans, conservatives continue to outnumber moderates by about two-to-one. And there are now as many liberal Democrats as moderate Democrats.

But the growing partisan divide over political values is not simply the result of the declining number who identify with the party labels. While many Americans have given up their party identification over the past 25 years and now call themselves independents, the polarization extends also to independents, most of whom lean toward a political party. Even when the definition of the party bases is extended to include these leaning independents, the values gap has about doubled between 1987 and 2012.

Looking ahead to the 2012 election, the largest divides between committed supporters of Barack Obama and Mitt Romney are over the scope and role of government in the economic realm. Swing voters, who make up about a quarter of all registered voters, are cross-pressured. Their attitudes on the social safety net and immigration are somewhat closer to those of Romney supporters, while they tilt closer to Obama supporters in opinions about labor unions and some social issues.

In contrast to the widening partisan gap, the new survey finds neither growing class differences in fundamental political values, nor increasing class resentment. As in the past, a substantial majority of Americans agree that “the rich just get richer while the poor get poorer.” Yet there are no indications of increasing hostility toward the rich and successful. And there are no signs that lower-income people have become more cynical about an individual’s power to control their destiny or the value of hard work.

At the same time, the proportion of Americans who see a widening gap in living standards between the poor and middle class has grown since the mid-1980s. But the public sees no greater gap in values differences between the middle class and poor over this period.

The polling finds little support for the broad notion of American “declinism.” As has been the case in previous political values surveys, a large majority agrees that “as Americans we can always find a way to solve our problems and get what we want.” The public’s confidence in the nation has not been dulled, even as Americans have become more skeptical about prospects for economic growth.

These are among the principal findings of the latest Pew Research Center American Values survey, conducted April 4-15, 2012, among 3,008 adults nationwide. The values project, which began in 1987 and has been updated 14 times since then, tracks a wide range of the public’s fundamental beliefs. These questions do not measure opinions about specific policy or political questions, but rather the underlying values that ultimately shape those opinions.

American Values Interactive Database

To mark the 25th anniversary of the study, we have developed an interactive database of the full history of the Center’s values studies.  This tool allows you to go beyond the surface to study change and stability within political and demographic subgroups.  Explore the database.

Widening Gaps over Social Safety Net, Environmentalism
Where Partisan Divisions Are Largest

The survey covers the public’s attitudes on the role and performance of government, the environment, business, labor, equal opportunity, national security and several other dimensions.

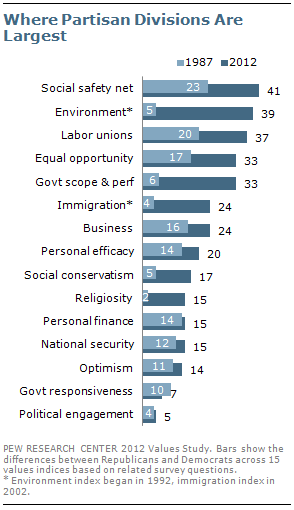
Republicans are most distinguished by their increasingly minimalist views about the role of government and lack of support for environmentalism. Democrats have become more socially liberal and secular. Republicans and Democrats are most similar in their level of political engagement.

On some sets of issues, such as views of the social safety net, there already were sizable partisan gaps in Pew Research’s first political values study in 1987. But these differences have widened considerably. On others, such as measures of religiosity and social conservatism, there were only modest differences initially, but these divides also have grown.
Republican Support for Safety New Plummets

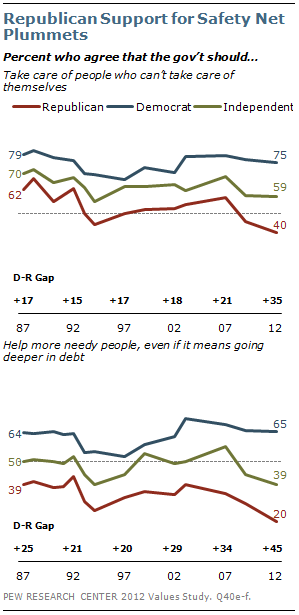
Republicans and Democrats are furthest apart in their opinions about the social safety net. There are partisan differences of 35 points or more in opinions about the government’s responsibility to care for the poor, whether the government should help more needy people if it means adding to the debt and whether the government should guarantee all citizens enough to eat and a place to sleep.

On all three measures, the percentage of Republicans asserting a government responsibility to aid the poor has fallen in recent years to 25-year lows.

Just 40% of Republicans agree that “It is the responsibility of the government to take care of people who can’t take care of themselves,” down 18 points since 2007. In three surveys during the George W. Bush administration, no fewer than half of Republicans said the government had a responsibility to care for those unable to care for themselves. In 1987, during the Ronald Reagan’s second term, 62% expressed this view.

Declining Republican Support for Tougher Environmental Laws

Over the past two decades, the public consensus in favor of tougher environmental restrictions has weakened, also primarily because of changing opinions among Republicans.

For the first time in a Pew Research Center political values survey, only about half of Republicans (47%) agree that “there needs to be stricter laws and regulations to protect the environment.” This represents a decline of 17 points since 2009 and a fall of nearly 40 points, from 86%, since 1992.

The partisan gap over this measure was modest two decades ago. Today, roughly twice as many Democrats as Republicans say stricter environmental laws and regulations are needed (93% vs. 47%).

Democrats More Secular, Socially Liberal

Yet the widening partisan divide in political values is not just the result of changing opinions among Republicans. Democrats have shifted their views in a number of areas in recent years, though less dramatically: They have become more secular, more positive in their views of immigrants and more supportive of policies aimed at achieving equal opportunity.

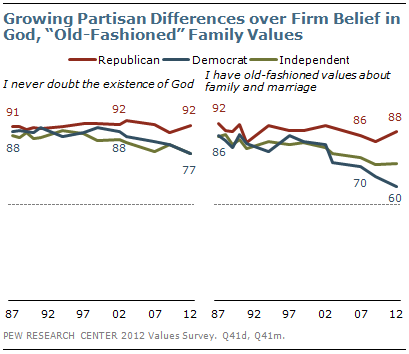
Roughly three-quarters of Democrats (77%) say they “never doubt the existence of God,” as do 76% of independents. The proportion of Democrats saying they never doubt God’s existence has fallen 11 points over the past decade. Among white Democrats, the decline has been 17 points – from 85% in 2002 to 68% currently.
Growing partisan differences over firm belief in God, "old-fashioned" family values

Independents also are less likely to express firm belief in God than in the past. By contrast, the percentage of Republicans saying they never doubt God’s existence is as large today (92%) as it was a decade ago, or a quarter century ago.

There also has been a substantial decline in the share of Democrats saying they “have old-fashioned values about family and marriage.” Just 60% of Democrats currently agree, down from 70% in 2007 and 86% in the first political values survey. Republicans’ views have shown far less change: Currently, 88% say they have old-fashioned values about marriage and family.
More Democrats favor preferences to improve minorities' position

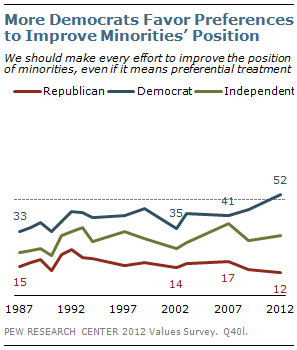
Democratic support for doing whatever is necessary to improve the position of minorities, including the possible use of preferences, has increased in recent years. About half (52%) of Democrats agree that “We should make every effort to improve the position of blacks and other minorities, even if it means giving them preferential treatment” – an 11-point increase since 2007.

Republicans’ views have changed little over this period. Just 12% currently agree that all efforts should be taken, including the use of preferential treatment, to improve the position of minorities. Since 1987, the gap between the two parties has about doubled – from 18 points to 40 points.

Class Divides: No Wider than in 1987

While the partisan gaps in political values have increased substantially, class divisions have not. This does not mean there are not significant differences, particularly when it comes to views about whether hard work leads to success and whether success is within an individual’s control. But these differences are generally no wider today than in recent years, or than they were in the initial political values survey.

Consistent education divides over hard work leading to success, rich-poor gap

For the past 25 years, majorities across most groups have rejected the idea that “hard work offers little guarantee of success.” In the current survey, just 35% agree with this statement while 63% disagree. As in the past, those with less education and lower incomes are more likely than those with more education and higher incomes to say that hard work does not ensure success.

Currently, 45% of those with no more than a high school education agree that hard work offers little guarantee of success, compared with 25% of college graduates. The gap was about as large in Pew Research’s first political values study (35% vs.17%).

Among whites who have not completed college, 36% are skeptical that hard work guarantees success; fewer white college graduates agree (24%). The education gap among whites was comparable in 1987 (29% non-college grad, 16% college grad).

There is greater agreement across socioeconomic lines in views of the gap between the rich and poor in this country.

As has been the case in most values surveys, majorities in all educational and income groups agree that “today it’s really true that the rich just get richer while the poor get poorer.” In the current survey, 76% of the public agrees with this statement, about the same as the 74% that agreed in 1987.
Most see wider gap in living standards, not values

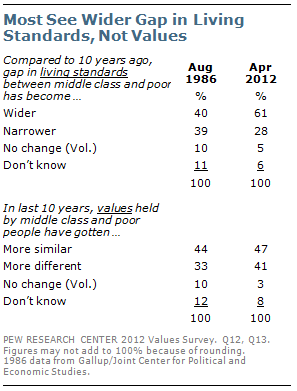
Still, there is evidence that the public sees greater economic inequality today than it did in the 1980s. About six-in-ten (61%) say the gap in living standards between middle class and poor people has widened over the past 10 years, while just 28% say it has narrowed.

In a 1986 survey by Gallup and the Joint Center for Political and Economic Studies, just 40% said the gap in the standard of living between the middle class and poor had grown, while about as many (39%) said it had narrowed.

Yet there has been far less change in opinions about whether the values of middle class and poor people are growing apart. In the current survey, 47% say the values of the middle class and poor have gotten more similar over the past 10 years; somewhat fewer (41%) say they have gotten more different. That is little changed from the 1986 survey, when 44% said the values of each had gotten more similar and 33% more different.

Economic Views Sour, But No Decline in Optimism

The survey also finds new evidence of the toll taken by the economic downturn, both on people’s personal financial assessments and their views of the country’s economic prospects. Just 53% say they are “pretty well satisfied with the way things are going for me financially.” That matches the lowest percentage ever, reached three years ago. People with family incomes of $75,000 or more express greater satisfaction with their finances than in 2009; financial satisfaction has continued to sag among those with incomes of less than $40,000.
As Americans, we can solve our problems and get what we want

Only about half of Americans (51%) agree with this statement: “I don’t believe that there are any real limits to growth in this country today”; 45% disagree. That is the lowest percentage ever agreeing with this statement, down slightly from 54% in 2009. In the first political values survey, 67% said there were no limits to growth in the United States.

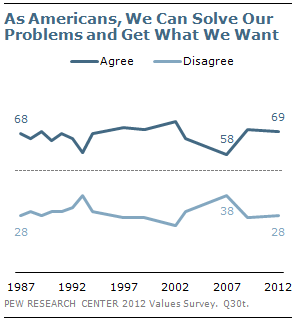
Despite persistent economic pessimism, however, the public remains bullish about the ability of the American people to overcome challenges. Nearly seven-in-ten (69%) agree that “As Americans, we can always find a way to solve our problems and get what we want.” While that is largely unchanged from 2009 (70%), it is up 11 points since 2007 (58%). It also is about the same percentage that agreed with this statement in the first values survey (68%).

Political Values and the 2012 Election
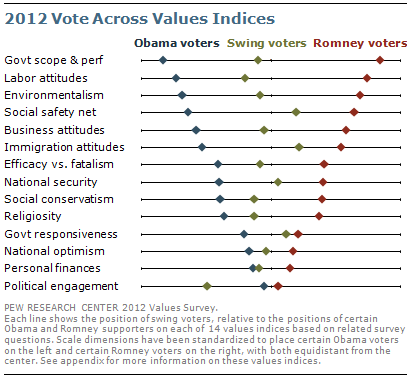
2012 vote across values indices

When the values items are combined into indices (grouping measures on common subjects, such as the social safety net, into a single scale), swing voters – who make up 23% of all registered voters – tend to fall about halfway between certain Obama voters and certain Romney voters. Swing voters are either undecided, only lean toward a candidate, or favor a candidate but say there is still a chance they will change their minds.  (For more, see “With Voters Focused on Economy, Obama Lead Narrows,” April 17, 2012).

On views about the scope and performance of government, for example, there is a wide divide between certain Obama and Romney supporters. But the attitudes of swing voters are about equidistant from backers of either candidate. The same is true on several other key indices, including views of business, the environment and national security.

Nonetheless, there are some issues on which the views of swing voters tilt slightly toward the backers of either candidate. On attitudes toward labor and social conservatism, opinion among swing voters comes somewhat closer to that of Obama voters. By contrast, on indices measuring attitudes on the social safety net and immigration, swing voters’ opinions tilt toward those of Romney supporters.

While the views of swing voters generally fall between those of certain Obama and Romney backers, there are a handful of individual questions that show agreement between swing voters and the supporters of one candidate or the other.
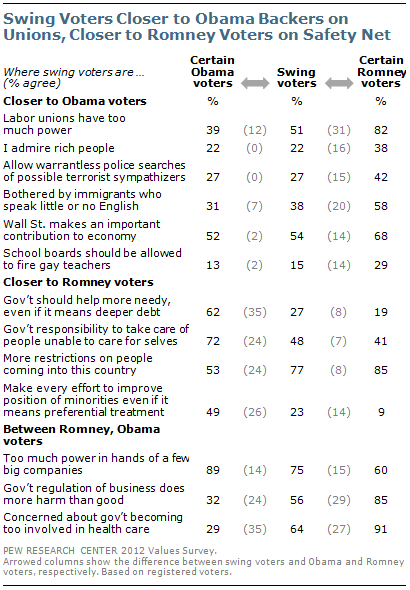
Swing voters closer to Obama backers on unions, closer to Romney voters on safety net

For example, on the power of labor unions and admiration of wealthy people, the opinions of swing voters are closer to those of Obama supporters. About half of swing voters (51%) agree that labor unions have too much power, placing them closer to the views of Obama supporters (39% agree) than Romney supporters (82%).

Just 22% of swing voters, and an identical percentage of Obama supporters, say they “admire people who are rich.” A much higher percentage of Romney supporters (38%) agree.

But swing voters are far closer to Romney voters on the question of whether the government should help more needy people even if it means going further into debt: just 19% of Romney voters and 27% of swing voters agree, compared with a 62% majority of Obama voters.

Number of Independents Continues to Grow
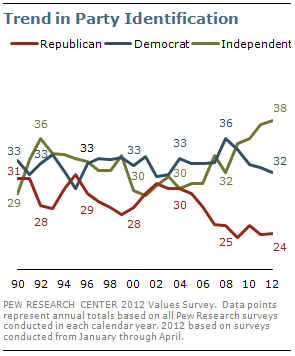
Trend in party identification

While Republicans and Democrats have been moving further apart in their beliefs, both groups have also been shrinking. Pew Research Center polling conducted so far in 2012 has found fewer Americans affiliating with one of the major parties than at any point in the past 25 years. And looking at data from Gallup going back to 1939, it is safe to say that there are more political independents in 2012 than at any point in the last 75 years.

Currently, 38% of Americans identify as independents, while 32% affiliate with the Democratic Party and 24% affiliate with the GOP. That is little changed from recent years, but long-term trends show that both parties have lost support.

The percentage of Americans identifying as Democrats increased from 31% in 2002, following the 9/11 terrorist attacks, to 36% in 2008. But over the past four years, Democratic affiliation has fallen to 32%. Republican identification stood at 30% in 2002, but fell to 25% in 2008 and has not recovered since then.

More Conservative Republicans, More Liberal Democrats
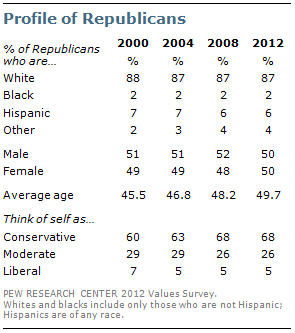
Profile of Republicans

Over the past decade, the Republican Party has come to be dominated by conservatives, while liberals make up an increasing share of Democrats.

In surveys conducted this year, 68% of Republicans describe themselves as politically conservative. That is little changed from 2008, but is higher than in 2004 (63%) or 2000 (60%).

Demographically, Republicans remain overwhelmingly white and their average age now approaches 50. Fully 87% of Republicans are non-Hispanic whites, a figure which has changed little since 2000.

Profile of Democrats

Meanwhile, the percentage of Democrats who say their political views are liberal has risen from 28% in 2000 to 34% in 2008 and 38% in 2012 surveys by the Pew Research Center. For the first time, there are as many liberal Democrats as moderate Democrats.

In contrast to Republicans, Democrats have grown increasingly diverse. A narrow majority of Democrats (55%) are non-Hispanic whites, down from 64% in 2000. As in recent years, most Democrats are women (59%). And while the average age of self-described Democrats has risen since 2008 – from 46.9 to 47.7 – Democrats continue to be younger than Republicans on average (47.7 vs. 49.7).
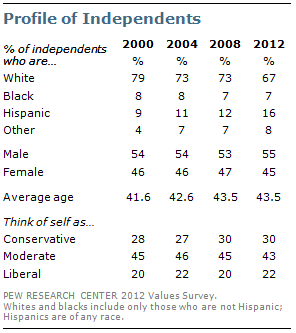
Profile of Independents

Independents also have become more diverse since 2000: Two-thirds of independents (67%) are non-Hispanic whites, down 12 points from 2000. The proportion of independents who are Hispanic has nearly doubled – from 9% to 16% – over this period.

A plurality of independents (43%) describes their views as moderate, while 30% are conservative and 22% are liberal. These views are largely unchanged from previous election years.

Section 1: Understanding the Partisan Divide Over American Values

Much has changed over the past 25 years – internationally, domestically and technologically. But through this period, the public’s core values have remained relatively stable. The way

More skepticism of government

that the public thinks about poverty, opportunity, business, unions, religion, civic duty, foreign affairs and many other subjects is, to a large extent, the same today as in 1987. On most of the questions asked in both 1987 and 2012, the number agreeing is within five percentage points of the number who agreed 25 years ago. And on almost none has the basic balance of opinion tipped from agree to disagree or vice-versa.

The exceptions to this pattern of stability have occurred almost exclusively in two areas: views of government and social values. Public assessments of the federal government’s role and performance have fluctuated over the past 25 years, but are currently at a low point on

Shifting social values

most measures. And public views about race, homosexuality, gender and family have undergone an even more fundamental shift since 1987.

While important, the changes in these two realms are the exceptions, however. More common are the consistent majorities who believe that the strength of the country is mostly based on the success of American business, who believe that as Americans we can always find a way to solve our problems, and who believe that hard work can lead to success for anyone. Similarly, for 25 years

Mostly stable values: wealth gap, foreign affairs, opportunity

most have consistently held the view that the government has a responsibility to care for people who can’t take care of themselves, that labor unions are necessary to protect the working person, and that it’s really true that the rich just get richer while the poor get poorer. Despite the inherent tension in many of these values, the relative stability over this tumultuous period suggests that the core principles and beliefs of the nation are robust.

This relative stability in the overall balance of values does not mean the nation has not undergone a fundamental transformation, however. As discussed in the overview of this report, the defining change in American politics over the past quarter-century is not in overall public beliefs, but how these beliefs are increasingly being sorted along partisan lines. Today, the partisan bases are more

Consistent majorities on patriotism, prayer, business

homogeneous and less cross-pressured, and hold more consistently liberal or conservative views across a wider spectrum of values.

This polarization along partisan lines stands in contrast to other social divides such as race, ethnicity, gender, class and religion, all of which remain significant factors, but which have neither grown nor receded in importance.

To mark the 25 year anniversary of the Pew Research Center’s American Values study, we have developed an interactive database of the full history of these studies. The website allows you to go beyond the surface to study change and stability within political and demographic subgroups.

Partisan Differences Now Predominant

In 1987, midway through Ronald Reagan’s second term in office, party was one among many fundamental cleavages in American society. Republicans and Democrats held different values, but the differences were on par with the differences of opinion between blacks and whites, wealthy and poor, or college grads and those without a college degree.

Widening partisan differences in political values: 1987-2012

This is no longer the case. Since 1987 – and particularly over just the past decade – the country has experienced a stark increase in partisan polarization. Across 48 different questions covering values about government, foreign policy, social and economic issues and other realms, the average difference between the opinions of Republicans and Democrats now stands at 18 percentage points. This is nearly twice the size of the gap in surveys conducted from 1987-2002.

The growing divide between Democrats and Republicans spans a wide range of beliefs, with record-wide gaps for many value dimensions Pew Research has tracked over the past 20 to 25 years. In most cases, this represents a widening of already existing partisan differences – particularly when it comes to the role of government. For example, Democrats have always been more committed than Republicans to government responsibilities in providing a social safety net and actively addressing inequality in the nation. But in both of those areas, the divide between Democratic and Republican values has nearly doubled over the past quarter century.

Views on the importance of environmental protection have arguably been the most pointed area of polarization. When these questions were first asked 20 years ago, there was virtually no disagreement across party lines. Even as recently as 2003, Republicans and Democrats were, on average, only 13 points apart on questions related to the environment. That gap has now tripled to an average of 39 points – one of the largest

Partisan polarization spans multiple realms

values gaps in the study.

Religion and social conservatism have also arisen as new partisan divides over this period. When the project was first started in 1987, Democrats and Republicans were equally likely to express strong religious faith, cite the importance of daily prayer and express unwavering faith in God. While broad majorities in both parties continue to hold these views, the share of Democrats who do not has grown substantially.

Views on immigration have also become partisan, when they were not before. When these items were first asked 10 years ago, there was little difference in how Democrats and Republicans thought about the impact of immigrants and the need to reduce immigration. But that four-point average difference has increased to 24 points in the current survey.

Polarization has not increased in all areas, however. While there are partisan differences over national security, these are not much larger than they were 25 years ago. And there is no greater gap between Republicans and Democrats today in terms of their impression about how well the electoral process works, how responsive elected officials are, and the importance they place on civic engagement and voting.

Why the Gaps Have Grown

Republican value shifts

Responsibility for the growing divide between Republicans and Democrats cannot be attributed solely to a shift in the values of one or the other party.

In some realms, Republicans today clearly take a more conservative position, while Democratic values have remained relatively constant. This is most apparent when it comes to environmental protection. Republicans also have grown far less committed to the social safety net in their responses to questions about whether the government has a responsibility to care of those unable to care for themselves and provide basic food and shelter for the needy. And views of the role of labor unions have also become more polarized due mostly to shifting Republican views on unions as Democratic support has remained more stable.

But in other realms, the values of Democrats have shifted while Republicans have held steady. Most notably, there has been a decided secular trend among Democrats in recent years. From 1987 through the end of the 1990s Republicans and Democrats expressed roughly equal levels of religious commitment. But since then, Republican commitment has held steady, while a declining majority of Democrats hold traditional religious views. The trend away from religion has become substantial among liberal Democrats in particular.

Democratic value shifts

Democratic support for equal opportunity – the sense that the government should do more to ensure equal opportunity for blacks and minorities – has also risen substantially in recent years. And similarly, Democrats have become increasingly favorable toward immigration and view the impact of immigrants on America more positively. In both of these realms, this shift is not only due to the Democratic Party’s increasingly diverse demographics; even among white Democrats, support for equal rights and immigrants has grown.

Views of government

Perhaps the most dramatic shift in partisan values has occurred on general assessments of the government’s effectiveness and proper scope. Since 2007, Republicans increasingly feel that regulation does more harm than good, while Democrats increasingly disagree. Republicans see more waste and inefficiency, Democrats see less. And the share of Republicans who say the government is too involved in our daily lives has grown, while the number of Democrats who say this has decreased.

Historically, views on government effectiveness have changed with administrations. When Ronald Reagan, George H.W. Bush and George W. Bush were in office, Republican skepticism and concern about government was far less intense. And by the latter part of the most recent Bush presidency, Democratic concerns about government had increased.

But the Obama presidency has witnessed the most extreme partisan reaction to government in the past 25 years. Republicans are more negative toward government than at any previous point, while Democrats feel far more positively.

Independent Polarization

The increasing divergence between Republicans and Democrats coincides with the shrinking of the partisan bases. So far in 2012, a

Polarization extends to Independents as well

record low 56% of Americans think of themselves as either Republicans (24%) or Democrats (32%). By comparison, 62% identified as a Republican or Democrat in 2008, and 64% in 2004.

Yet political polarization is not limited to the narrowed partisan bases. Even independents who say they only lean toward one or the other party have grown further apart in their values and beliefs. On most of the core attitudes about the role and effectiveness of government, the values of these partisan leaners track very closely with those of partisans; this is true on other value dimensions as well, such as views of business, labor unions, national security, immigration and social conservatism.

Growing political divide beyond shrinking political bases

As a result, the pattern of growing polarization between Republicans and Democrats is just as stark when leaners are included. Over the past 25 years, the average difference between Republicans and Democrats has grown from 10 points to 18 points. When leaners are included, the gap has increased from nine to 16 points.

Overall, a growing number of Americans – including both partisan and many independents – are expressing consistently liberal or consistently conservative views across a wider range of political values than at any previous point in the past quarter century.

Section 2: Demographics and American Values

Even as party divisions over values have expanded over the last quarter century, gaps between other groups have remained relatively unchanged. Across the 48 values items tracked

Partisan gap grows while other divides are stable

regularly since 1987, average gender, age, race, education, income and religiosity differences have remained remarkably stable. Several of these demographic characteristics are associated with significant differences in values, but none have shown substantial change over time.

Of particular note is the size of the overall gender gap, which is modest. On average, men and women differ by only six points across these values questions. The size of the gender gap varies on different questions, but it remains relatively narrow across-the-board.

Differences between blacks and whites, college graduates and non-college graduates, high and low-income people and younger and older people are more substantial, although in each case these divisions are now dwarfed by partisan differences.

Age Differences in Social and Political Values

Comparing the values of younger and older Americans

There have long been age divides in political and social values. Younger people tend to be less politically engaged, less religious, and more positive about government and what it can do.

As discussed in detail in a previous report on generational politics (See “The Generation Gap and the 2012 Election”, Nov. 3, 2011), much of the current political dynamic is a result of strong generational characteristics of the Millennial generation compared with Gen X, Baby Boomers and the Silent generation. There have been particularly wide differences in the voting patterns of younger and older Americans in the past few elections because of the contrast between a younger, more Democratically-oriented generation and an older generation that has consistently been more supportive of Republican candidates.

Many of the age differences over values have remained fairly constant over the past quarter century. In 1987, 18-to-29 year olds were considerably less skeptical than those 65 and older about the government’s ability to operate efficiently; that gap has endured ever since. Younger adults also have been consistently more supportive of the social safety net and of environmental policies, and they are significantly less religious.

One emerging age gap is over wealth disparities – 83% of those younger than 30 say it is really true that the rich just get richer while the poor get poorer, compared with 67% of those 65 and older.

But this does not mean there is an age divide over opportunity in America. Only a minority of younger and older Americans alike agree with the notion that hard work offers little guarantee of success. Similarly, fewer than half in any age group believes that success is determined by forces outside their control.

Not surprisingly, the largest gaps between younger (18-to-29) and older (65+) Americans in core values concern issues related to social change such as homosexual rights, single parenting, and racial integration.

Key young-old divides in 2012

Just 36% of those 65 and older say they agree with the statement that “One parent can bring up a child as well as two parents together,” compared with 65% of those younger than 30.

While sizable majorities of those in all groups approve of interracial dating, this sentiment is nearly universal among young people (95% agree). About two-thirds (68%) of those 65 and older agree. In terms of current political issues, there is more support for gay marriage among younger people, though support has grown across all age groups.

Some of these age gaps are related to a trend toward secularization in the younger age groups. Notably, people younger than 30 are substantially less likely than older people to say prayer is an important part of their lives (24-point gap). Research on generational patterns shows that this is not merely a lifecycle effect; the Millennial generation is far less religious than were other preceding generations when they were the same age years ago. (See graphic entitled “Rise of Religiously Unaffiliated among Younger Generations”, Nov. 3, 2011.)

Younger people also are less critical of government performance. While 69% of those 65 and older agree that “when something is run by the government, it is usually inefficient and wasteful,” this compares with only about half (47%) of those younger than 30. Related to this, younger people are more supportive of the government’s role in regulating the economy and providing a social safety net.

And younger people express far less negative attitudes about immigrants and the effects of immigration on the country. To be sure, the younger generations are far more ethnically diverse – the latest data suggest that one-in-five U.S. adults younger than 30 are of Hispanic background. But age differences in views of immigrants and immigration are not attributable to demographics alone. The gap in the views of younger and older whites is just as large.

Gender Gaps Modest Overall

Although differences between men and women are evident across many values items, the size of these differences is generally modest, and on many items there is no significant difference at all. Moreover, what gender differences exist have neither increased nor decreased over time.

Most gender gaps modest, consistent

One of the larger value differences between men and women is in how religiously committed they are. Women are significantly more likely than men to say prayer is an important part of their lives, and to say they never doubt the existence of God. These gender gaps persist among both younger and older generations of men and women, as well as among college graduates and the less educated.

Despite their higher religiosity, women have not been more conservative th

Sizable gender differences over single parents, working mothers

an men on social issues. Women are about as likely as men to say that they have “old-fashioned values about family and marriage.” And on one of the most divisive social issues – homosexuality – women have tended to be more supportive of gay rights than men.

When it comes to government, men have generally been more skeptical of the government’s ability to act efficiently, and less supportive of the social safety net.

There is a substantial gender gap in attitudes about single parenting: About six-in-ten (62%) women say one parent can bring a child up as well as two parents together; only 39% of men share that view. Additionally, women are less likely than men to agree that “a pre-school child is likely to suffer if his or her mother works” (29% of women vs. 42% of men).

Whites and Blacks Differ Over Role of Government

Values by race and ethnicity

The differences in the views and beliefs of blacks and whites today are largely the same as when this project began in 1987. African Americans have consistently been more confident than whites in government’s ability to perform efficiently and more supportive of the social safety net and a larger role for the government in society.

Most notably, 62% of blacks say “we should make every possible effort to improve the position of blacks and other minorities, even if it means giving them preferential treatment.” Just 22% of whites agree. Twenty-five years ago, the gap was almost identical, 64% vs. 16%.

When it comes to the social safety net, 78% of blacks today say “the government should guarantee every citizen enough to eat and a place to sleep.” That figure was 80% in 1987. Among whites, 52% agree with this statement today, down slightly from 58% in 1987.

One of the defining values gaps between blacks and whites is over opportunity. Currently, half of blacks say “success in life is determined by forces outside our control,” compared with 31% of whites. Again, these figures are little changed from 25 years ago (49% of blacks, 35% of whites.)

While blacks overwhelmingly support a government safety net, they mostly agree with whites that poor people have become too dependent on government assistance programs. Currently, 72% of whites and 70% of blacks hold this view. While historically whites have been more likely to feel this way than blacks, the gap has been small relative to other divides over government and opportunity.

Religiosity remains a substantial racial gap. On all measures of religious intensity – the importance of prayer never doubting the existence of God and believing there will be a Judgment Day – the share of African Americans who not only agree, but completely agree, is far higher than among whites.

This religious conviction does not always mean blacks are more conservative on social issues, however. African American support for gay marriage has grown in recent years, but is still below support among whites (39% of blacks and 47% of whites now favor allowing gays and lesbians to marry legally). (See “Changing Views of Gay Marriage: A Deeper Analysis,” May 23, 2012.)

But there is no difference in the share of blacks and whites who say schools should have the right to fire gay teachers (24% of blacks, 20% of whites). Roughly equal majorities of blacks (69%) and whites (72%) say they have “old fashioned values about family and marriage,” though blacks are more likely than whites (28% vs. 14%) to say that “women should return to their traditional roles in society.”

Education and Income Gaps

Values by income and education

As has consistently been the case over the last quarter century, there are clear values divides by socioeconomic status. Apart from differences in financial security, some of the largest education and income gaps concern social issues and religiosity: Just 39% of college graduates believe we will all be called before God at the Judgment Day to answer for our sins, compared with 60% who did not finish bachelors’ degrees and 65% of those who never attended college. Low- and high-income people differ by similar degrees. These divides have been consistent over the past 25 years.

Large income and education divides also have been steady when it comes to questions of personal efficacy: Nearly half of those in the bottom two income quartiles say “hard work offers little guarantee of success,” compared with just 23% of those in the top income quartile. Those with no more than a high school diploma are also far more likely to believe this (45%) than are those with a college degree (25%). Those in lower income and education categories also are the most likely to say that “the rich just get richer while the poor get poorer.”

Income and education gaps are not always parallel. Lower-income Americans always have been more supportive of the social safety net than those in higher income brackets. There is not as much variation across educational lines. In fact, in the current survey, college graduates and those who never attended college have that same view on whether the government has a responsibility to take care of people who can’t take care of themselves.

Section 3: Values About Economic Inequality and Individual Opportunity

The public has long believed there is a growing financial divide between the rich and poor in this country. On a basic measure of inequality, a substantial majority continues to agree that “today it’s really true that the rich just get richer while the poor get poorer.”

It's really true that the rich get richer while the poor get poorer

Moreover, more Americans see a greater divergence in the standards of living between the middle class and poor than did so in the mid-1980s. And even as the personal financial assessments of more affluent Americans have rebounded since 2009, those of people in the lowest income tier have not. Currently, people in the lowest-income group express less financial satisfaction than at any time in the last 25 years.

Despite these widespread perceptions of economic inequality, there are no indications that class resentment is on the rise in the United States. Wealthy people who achieve success through hard work are as widely admired today as they were in the first Pew Research Center political values survey in 1987. On the other hand, most Americans do not admire those who simply are rich, with no mention of them becoming wealthy through their own efforts.

When it comes to opinions about the poor, more say that people are poor because of circumstances beyond their control than because of a lack of effort on their part. And a sizable majority continues to say that poor people work but are unable to earn enough money; far fewer say that they do not work.

Moreover, while more Americans say that living standards among the poor and middle class are growing apart than did so in the 1980s, a plurality continues to say that the values of the poor and middle class have become more similar, rather than more different, in recent years.

For the most part, there are larger partisan gaps than educational or income differences in opinions about wealth, poverty and inequality. But there are some notable exceptions, including in opinions about personal success and the value of hard work. People with less education and lower incomes are consistently more likely than those with better education and higher incomes to say that success is outside of an individual’s control. Even on these measures, however, socioeconomic differences in views are no wider today than they were in the first political values survey in 1987.

Perceptions of Economic Inequality

Most see wider gaps in living standards

In 1986, the public was evenly divided over whether the gap in living standards between the middle class and poor was growing; 40% said it was getting wider, while 39% said it was narrowing. But today, more than twice as many say the gap in living standards has widened than narrowed over the past decade (61% vs. 28%). The belief that there is a larger economic gap between the middle class and poor has increased among most demographic and political groups since 1986.

Broad agreement that economic gaps have grown

An even higher percentage (76%) sees a wider gap in living standards between the middle class and rich compared with 10 years ago. Just 16% say the gap in living standards has narrowed over this period.

Majorities across all major demographic groups say that gaps in the standard of living between the poor and the middle class – and the middle class and the rich – have gotten wider over the past 10 years.

While there are partisan differences in these views, they are fairly modest. Majorities of Democrats (66%) and independents (62%) say the gap in living standards between the middle class and poor is wider than it was 10 years ago; about half of Republicans (51%) agree. Large majorities of all three groups say the gap in living standards between the rich and the middle class is wider than it was a decade ago.

Perceptions of Values Gaps

Little change in views of values gap between poor, middle class

The public sees a wider economic gap between the poor and middle class than it did in 1986. But its views of the values differences between the two groups are largely unchanged.

As in 1986, a greater percentage says the values of the poor and middle class have gotten more similar – rather than more different – over the past 10 years. Nearly half (47%) say the values of the poor and middle class have become more similar, while 41% say they have become more different.

In the 1986 survey by Gallup and the Joint Center for Political and Economic Studies, 44% said values of the middle class and poor had become more similar while 33% said they had grown more different.

Most say poor and rich have same more values as others

In the current survey, far more say the values of the rich and the middle class have diverged over the past decade than say that about the poor and middle class. Nearly seven-in-ten (69%) say the values of the rich and middle class have become more different over the past ten years; only 41% say the same about the values held by the poor and middle class.

A relatively small percentage (23%) thinks that rich people have lower moral values than other Americans. A majority (55%) says that rich people have about the same moral values as others and 15% say rich people’s values are higher.

Fully two-thirds of Americans (67%) say that the poor have about the same moral values as other Americans; 14% say the poor have lower values while about the same percentage (12%) says they have higher values.

The Rich-Poor Divide
Views of whether "rich get richer" by income

The belief that the “rich just get richer while the poor get poorer” has remained stable across income groups since 1987. Those in the lowest quartile of family income –$20,000 a year or less in the current survey – continue to be somewhat more likely to agree with this sentiment than those in highest income quartile ($75,000 or more) (85% vs. 70%).

But the partisan gap in these attitudes is large and growing. The percentage of Democrats agreeing that the “rich get richer” (92%) is as high as it has ever been and has increased by eight points since the previous political values survey in 2009. Nearly three-quarters of independents (73%) agree that the rich g

More Democrats say rich get richer, poor get poorer

et richer, while a much smaller majority of Republicans (56%) do so.

Partisan differences on this measure have never been wider. In the first political values survey in 1987, 84% of Democrats said the rich got richer and the poor got poorer, compared with 74% of independents and 62% of Republicans.

Success Admired When Achieved through Work

Rich are widely admired... if they work hard

Nearly nine-in-ten (88%) say that they “admire people who get rich by working hard”; about half (49%) completely agree. These opinions are little changed from previous political values surveys. Yet the key to this admiration is the effort: just 27% agree with statement “I admire people who are rich” while 67% disagree.

As in the past, there are small demographic, educational and income differences in how people view those who have worked hard to get wealthy. Yet for the first time, sizable political differences have emerged.

I admire people who get rich by working hard

To be sure, overwhelming percentages of Republicans (95%), Democrats (86%) and independents (88%) admire those who have gotten rich through hard work. But Republicans are now far more likely to completely agree: 64% of Republicans say this, compared with 48% of independents and 42% of Democrats. Since 2009, there has been a 12-point increase in the share of Republicans who completely agree that they admire people who have gotten rich by working hard. Opinions among Democrats and independents have shown little change.

Republicans are more likely to admire people who are rich

There also are partisan differences over the statement: “I admire people who are rich.” There is no political or demographic group in which a majority agrees, but Republicans (40%) are more likely than Democrats (26%) or independents (21%) to express admiration for the rich.

People with higher family incomes are more likely than those with lower incomes to admire people who are rich. Nearly four-in-ten (37%) of those with incomes of $75,000 or more say they admire people who are rich. That compares with 27% of those with incomes of $30,000-$75,000 and 22% of those who earn less than $30,000.

Why Are People Poor?

Overall, 46% say that circumstances beyond one’s control are more often to blame if a person is poor, while 38% say that an individual’s lack of effort is more often to blame; 11% blame both. These views have fluctuated over the years, but opinion typically has been divided or pluralities have blamed circumstances, rather than a lack of effort, for people being poor.

Opinion gaps in opinions about why people are poor

In the current survey, more women (52%) than men (40%) blame circumstances beyond one’s control for why a person is poor. Majorities of blacks (62%) and Hispanics (59%) also blame external circumstances, while whites are evenly divided: 41% say circumstances beyond a person’s control are mostly to blame while an identical percentage says it is mostly a person’s lack of effort.

Notably, whites are divided in opinions about why someone is poor. White college graduates mostly blame circumstances beyond a person’s control (47% to 33%), while whites with some college experience say it mostly is because of a lack of effort (49% to 33%). Whites with a high school education or less are evenly divided (43% circumstances, 42% lack of effort).

By more than two-to-one (61% to 24%), Democrats say circumstances beyond a person’s control are primarily to blame for them being poor. By about the same margin (57% to 28%), Republicans blame a person’s lack of effort. Among independents more say circumstances, rather than a lack of effort, are mostly to blame (46% vs. 37%).

Most Say the Poor Work, but Can’t Earn Enough

Nearly two-thirds of Americans (65%) say that most poor people in the U.S. work but are unable to earn enough money; just 23% say the poor do not work. These opinions have changed little over the past decade, but opinion was more evenly divided in December 1994,

Little change in views of whether most poor people work

shortly after Republicans won control of Congress (49% work, 44% do not).

Majorities of men, women, whites, blacks and Hispanics say that poor people work but cannot earn enough money. And there are only modest differences in these opinions by income or educational attainment.

Yet there are sharp ideological differences. Fully 89% of liberal Democrats and 78% of moderate and conservative Democrats say poor people work but cannot earn enough; 64% of independents agree. But only about half of moderate and liberal Republicans (53%) say that poor people work but do not earn enough. Conservative Republicans are evenly divided: 43% say the poor in this country work but cannot earn enough, while 40% say most poor people do not work.

Economic Gaps over Personal Empowerment

Hard work offers little guarantee of success

Despite the struggling economy, majorities continue to reject the idea that hard work offers little guarantee of success and that success is outside of an individual’s control. As in the past, those with lower incomes and less education remain far more likely than those with higher incomes and more education to agree with these statements.

Currently, just 35% agree that “hard work offers little guarantee of success”; 63% disagree. Despite tough economic times and high unemployment, these opinions have not changed substantially in recent years. This stands in contrast with public reactions to the economic downturn in the early 1990s. In 1992, 45% said they felt hard work was no guarantee of success.

In the current survey, 46% of those with family incomes of $20,000 or less say that hard work offers little guarantee of success, compared with just 20% of those with incomes of $75,000 a year or more. And while 45% of those with no more than a high school education are skeptical that hard work leads success, just 25% of college graduates say this.

The pattern is similar in attitudes about whether individuals are largely in control of their own fates. Overall views are identical to opinions about whether hard work leads to success: Currently, 35% agree that “success in life is pretty much determined by forces outside our control,” while 63% disagree. These opinions also have changed little over the past 25 years; in the first values survey in 1987, 57% rejected the idea that success is largely determined by outside forces while 38% agreed.

Success is pretty much determined by forces outside out control

As was the case in the first political values survey, about twice as many of those in the lowest quartile of family income than those in the highest quartile say that success is determined largely by outside forces (50% vs. 22%).

There also are partisan and race differences in views about whether success is determined by outside forces and whether hard work offers little guarantee of success. But these gaps are somewhat more modest than differences by education and income.

The opinion divides are as substantial among whites as they are in the general public. In the current survey, 47% of low-income whites say that success is mostly determined by outside forces, compared with just 21% of high-income whites.

Financial Satisfaction Equals All-Time Low

Currently, 53% agree that “I’m pretty well satisfied with the way things are going for me financially.” That equals the lowest percentage agreeing with this statement in the last 25 years, from April 2009. In 2007, before the recession, 61% said they were pretty well satisfied with their finances.

While the percentage of the public expressing satisfaction with their finances is unchanged from three years ago, lower-income Americans have become less satisfied with their finances while financial satisfaction among upper-income people has recovered after falling sharply during the teeth of recession in 2009.

Just 30% of those in the lowest family income category – less than $20,000 a year – say they are “pretty well satisfied” financially. That is the lowest percentage of this group that has expressed financial satisfaction in the 25 years of Pew Research political values surveys.

Financial satisfaction rebounds among affluent, falls among poor

Just 41% of those in the next lowest income group ($20,000 to $40,000) say they are satisfied financially; that is a decline of 10 points since 2009 and also an all-time low.

In contrast, upper-income people (those with incomes of $75,000 or more), whose assessments of their personal finances fell sharply between 2007 and 2009, offer more positive views than they did three years ago. Currently, 74% say they are pretty well satisfied financially; that is up nine points from 2009 though still below 2007 levels (85%).

Americans’ perceptions of financial stress also have increased in recent years. Nearly half (48%) agree that “I often don’t have enough money to make ends meet” – this is the highest percentage expressing this sentiment since the early 1990s.

As might be expected, there are substantial socioeconomic differences in these attitudes, though they have not widened over the years. In the current survey, fully 75% of those in the lowest income category say they do not have enough money to make ends meet, compared with just 20% of those in the upper-income group.

Fewer See Unlimited Growth

I don't believe there are any real limits to growth in this country

As the public’s personal financial assessments have become more negative, so too have its views of the country’s growth prospects. Only about half (51%) agree that “I don’t believe there are any real limits to growth in this country today,” while 45% disagree. The percentage agreeing that there are no limits to growth (51%) is the lowest ever.

There are only modest demographic differences in these opinions. Comparable percentages of college graduates (47%), those with some college experience (52%) and those with a high school education or less (54%) say that there are no limits to growth.

Despite the public’s declining belief in the potential for unlimited growth, it has not grown skeptical of Americans’ abilities to solve problems. The percentage agreeing “as Americans we can always find a way to solve our problems and get what we want” is as high today as it was in the first political values survey in 1987 (69% now, 68% then).

Poor people are less likely than those with higher incomes to express optimism about Americans’ abilities to solve problems. Still, majorities across most demographic groups – including 57% of those in the lowest income quartile – say the American people can solve their problems.

Partisan agreement that American people can solve their problems

Partisan differences in opinions about the ability of the American people to solve their problems have fluctuated in recent years. In the current survey, 77% of Republicans agree, compared with 71% of independents and 64% of Democrats.

In 2009, there were virtually no partisan differences in these views. But in 2007, the partisan gap was much wider than it is today; at that time, 72% of Republicans expressed confidence in the people’s ability to solve problems, compared with 56% of independents and 53% of Democrats.

Most Upsetting: Cheating Gov’t Out of Benefits

More are upset by illegitimate government benefits than by unpaid taxes

The political values survey also asked about reactions to some illegal or morally questionable behaviors. Overall, far more Americans (70%) say they would be very upset if they heard someone claimed government benefits that they were not entitled to than if they heard a person had not paid all the taxes they owed (45%).

Other behaviors are viewed as less upsetting, including using government food aid for candy or soda (39% very upset), stopping payments on an underwater mortgage (31%), or parents not attending their child’s parent-teacher conferences (30%).

Republicans react more negatively than Democrats to some questionable behaviors

Most Americans find all of these behaviors unacceptable; majorities say they would either be very upset or just annoyed over hearing about each one. No more than a third say they either wouldn’t care about or would approve of any of these behaviors.

There are sizable partisan differences in reactions to many of these practices. Nearly half of Republicans (46%) say they would be very upset if they heard someone had stopped making mortgage payments on a house worth less than what they owe; fewer independents (28%) and Democrats (25%) find this very upsetting.

Republicans also are more likely than Democrats to be very upset by someone claiming government benefits illegitimately (by 15 points) and using government food aid to buy candy and soda (13 points).

There are racial divides in these concerns. Whites are more likely than blacks or Hispanics to say someone claiming government benefits they were not entitled to is very upsetting –

Racial differences in concerns over some behaviors, no class differences among whites

though majorities in all groups express this view. Both whites and Hispanics react more negatively than do blacks to using government food aid to purchase candy or soda. And when it comes to a parent missing their child’s teacher conference, Hispanics and blacks find this more upsetting than do whites.

But there is little evidence of significant class differences among whites in reactions to these behaviors. Lower-income whites find four of the five items just as upsetting as do higher income whites. The one exception is walking away from an underwater mortgage, which whites with household incomes under $75,000 find less upsetting than higher income whites.

Section 4: Values About Government and the Social Safety Net

Americans have long been skeptical of the federal government and suspicious of elected representatives as a whole. Roughly eight-in-ten (81%) say elected officials in Washington lose touch with the people pretty quickly, and 62% say “most elected officials don’t care what people like me think.” Just 41% of Americans now say the government is really run for the benefit of all the people. This is down from 49% three years ago, and matches previous lows in the early 1990s.

Concerns about the government’s scope and reach have also resurged. The number saying “the federal government controls too much of our daily lives” fell to 55% in 2009, only to rise again to 62% in the latest poll.

Overall assessments of the government’s performance remain quite negative. On the core question of whether the government is usually wasteful and inefficient, 59% now agree, little different than the 57% who said this in 2009. This is still less critical than views people expressed in the late 1980s and through most of the 1990s. In 1992, 70% said the government was usually inefficient and wasteful.

Public support for a government social safety net has continued to steadily wane. While a majority of Americans has consistently agreed that it is the responsibility of government to take care of people who can’t take care of themselves, this has slipped to 59% from 63% in 2009 and 69% in 2007.

None of these negative assessments are unprecedented. Negative attitudes toward government generally rose in the early 1990s – often peaking around 1994 – and then gradually receded over the latter point of that decade.

All of these assessments of government’s scope, responsiveness and performance are deeply divided along partisan lines – and in most cases the schism has grown since Barack Obama took office. Republicans and Democrats have moved in opposite directions in their views of government effectiveness and the responsiveness of leaders – Democrats have become significantly more positive since Obama took office, while Republicans have become significantly more negative. But when it comes to the social safety net, the drop in support has been driven largely by a substantial shift in the values of Republicans and, to a lesser extent, independents. At the same time, views among Democrats have remained relatively constant.

Government Evaluations Increasingly Partisan

Public ratings of the effectiveness of government are as politically polarized as they have ever been. About three-fourths of Republicans (77%) say when something is run by the government it is usually inefficient and wasteful, matching a previous high in 1994. In contrast, just 41% of Democrats say the same, similar to 2009. Democrats in recent years have been more positive about government than at any point in the past 25 years.

A Partisan Reaction to Government

The current 36-point partisan gap on this question is consistent with a pattern of wider polarization during Democratic administrations. Since Democrats are generally less skeptical of government than Republicans, the gap between the parties narrows during Republican administrations, when Democratic criticism rises and Republican criticism falls. The largest partisan gap prior to Obama’s presidency occurred during the early Clinton administration, when Republican criticism peaked at 77% and Democratic criticism fell to 58%. The current divide is larger than in 1994, due to the more positive assessments of government performance among Democrats.

Overall, views among independents about the inefficiency and wastefulness of government are more stable, regardless of which party is in office. About six-in-ten (63%) now say things run by the government are typically wasteful and inefficient, relatively unchanged for most of the past decade.

The Federal Government's Reach

The growing partisan gap also is reflected in questions about the scope of the federal government. Today, 69% of Americans say the federal government should run only things that cannot be run at the local level. Although views among the population as a whole have been fairly stable, the partisan divide over the issue of federalism has swelled in recent years: 84% of Republicans currently agree with this statement, compared with 56% of Democrats. The gap is now twice as large as it was just three years ago.

Young People Still More Positive about Government’s Performance

Young People See a More Efficient Government

Younger Americans have typically been more upbeat in their evaluations of government performance, and that pattern continues. While majorities of those in older age groups say the government is usually inefficient and wasteful, that compares to 47% of 18-29 year olds. This pattern is not unique to the current generation of 18-29 year olds – the Millennials – but was also the case throughout the 1990s, when Gen Xers were 18-29 years old.

However, on some measures of government responsiveness, young people, like the rest of the public, have become more cynical over the last few years. Today, 49% of 18-29 year olds agree that the government is really run for the benefit of all the people, down 10 points from 2009. Other age groups also have become more cynical on this measure.

New People in Washington

A majority (55%) of Americans say they would like to see new people in Washington, even if they are not as effective as experienced politicians. Anti-incumbent sentiment has risen 11 points since 2003, when the question was last asked, and nearly matches the peak seen in 1994 (60%).

On a similar item, 76% now agree with the statement: “it’s time for Washington politicians to step aside and make room for new leaders.” That is up 13 points since 2003, but still somewhat lower than in 1992.

Growing Appetite for Change in Political Leadership, Particularly Among Republicans

Historically, the appetite for inexperienced leadership generally has been greatest among those in the party not in control of the presidency, and that is still the case today. About two-thirds of Republicans (65%) say we need new political leaders, even if they are less effective than experienced politicians, compared with 45% of Democrats.

Similarly, during Bill Clinton’s first term in office in 1994, more Republicans than Democrats agreed with this statement (65% vs. 54%). But the reverse was evident as Ronald Reagan’s second term was coming to an end (when 58% of Democrats and 43% of Republicans wanted new leaders in Washington) and during George W. Bush’s first term in 2003 (when 47% of Democrats and 32% of Republicans wanted new leaders).

Older people have consistently expressed higher levels of anti-incumbent sentiment than younger Americans over the last 25 years. Today, about six-in-ten (62%) of those 65 and older want new people in Washington, compared to 47% of 18-29 year olds.

Compromise Continues to Garner Public Support
Republicans Less Inclined Toward Compromise

Eight-in-ten (80%) Americans now agree with the statement: “I like political leaders who are willing to make compromises in order to get the job done,” and support for compromise –framed in this way – is little changed over the last 15 years.

Today, an overwhelming majority of Democrats (90%) find compromise appealing in a political leader, as do 68% of Republicans. Over the past 15 years, more Democrats than Republicans have preferred political leaders who compromise.

Support for the Safety Net Falls

Support for Government Safety Net Remains Low

Support for a government social safety net declined in 2009 and has continued to decrease since then.  Support for government programs to aid the poor now nears the 25-year lows seen in 1994. Today, just 43% agree that the government should help more needy people, even if it means going deeper in debt, down from 48% in 2009 and 54% in 2007.

Similarly, although a majority (59%) says that it falls to the government to take care of those who cannot care for themselves, this is down 10 points from 2007.

Declining Republican and Independent Support for the Safety Net

Since 2007, Republican support for the safety net has declined significantly even as Democrats continue to support government assistance to the poor and needy as they have over the last 25 years. As a result, although the safety net has long been one of the areas where the opinions of Republicans and Democrats most diverge, the current party gap is now larger than ever.

Majorities of Republicans now say they disagree that the government should guarantee every citizen enough to eat and a place to sleep (36% agree, 63% disagree) and take care of people who can’t take care of themselves (40% agree, 54% disagree). As recently as 2009, Republican opinions on these questions were more evenly divided.

Partisan Rift Over Safety Net Grows

Republicans also have consistently disagreed with the statement that: “the government should help more needy people even if it means going deeper in debt”; 76% now say they disagree, an increase of 15 points since 2007.

At the same time, Democratic positions on these items have been relatively stable over the last quarter century. Three-fourths (75%) now agree that the government should take care of those who can’t take care of themselves. Similarly, 78% say basic food and shelter should be government guarantees and 65% think more support for the needy should be provided, even in the face of increased debt.

Independent views on the safety net are nearly evenly divided between those of Democrats and Republicans, reflecting a recent conservative turn. Backing of each of the safety net items among independents is now as low as it was in the mid-1990s. While majorities continue to say the government should help those who cannot help themselves (59%) and guarantee minimal food and shelter (58%), just 39% now agree that greater assistance to the poor should be provided even it means additional debt.

Safety Net: Beyond Party

The Social Safety Net: A Closer Look at Demographics

In addition to the partisan divide, there are gaps among demographic groups on views of the social safety net. But these gaps have been largely stable over the past 25 years and are now much smaller than the partisan gap. African Americans have consistently been more supportive of a government safety net than whites and remain more supportive today. Currently, 78% of blacks support government guarantees of food and shelter, compared with 52% of whites. Support also is high among Hispanics: 78% now agree that the government should guarantee people food and shelter.

In addition, people with lower incomes are far more supportive of the social safety net than those with higher incomes. Women also have consistently been more supportive of the social safety net than men. In the current poll, 64% of women and 54% of men support the government guaranteeing all citizens food and shelter. There are modest age and education differences on views of the social safety net, but these have changed little over the last 25 years. See the interactive database for detailed demographic breaks on this and all of the other long-term values items in this report.

Government Involvement in Health Care

Health Care Cross-Pressures

The public remains conflicted about the government’s role in the health care system. Today, 59% agree that they are concerned about the government becoming too involved in health care. In 2009, during the early stages of debate about what would become the Affordable Care Act a year later, 46% expressed concern about growing government involvement in health care. Yet, even as concern about government involvement has grown, an overwhelming majority (82%) continues to agree that the government needs to do more to make health care affordable and accessible.

Government Role in Health Care Divisive

And the partisan gap, already large in 2009, has only grown larger. Today, 88% of Republicans express a concern about the government becoming too involved in health care, compared with 37% of Democrats. This 51-point gap between Republicans and Democrats is the single largest partisan divide of the 79 items included in the current survey.

There also are divisions on this question within each party; conservative and moderate Democrats are twice as likely as liberal Democrats to express concern about government involvement in healthcare (46% agree vs. 23% agree, respectively). And although clear majorities of Republicans agree that they are concerned with growing government involvement in healthcare, there is less unanimity among moderate and liberal Republicans (79%) than among conservatives (92%).

A majority of independents (61%) now say they are concerned about government involvement in health care, up from 44% in 2009. Just 37% disagree with the statement, down from 53% three years ago.

Section 5: Values About Business, Wall Street and Labor

As the economy continues to struggle, fundamental attitudes toward business are little changed. Americans continue to see the success of business as central to the strength of the country. At the same time, large majorities continue to say that business corporations make too much profit and fail to strike a fair balance between making profits and serving the public interest.

As recent surveys have shown, the public also is of two minds about government regulation of business. Most Americans agree that free markets need government regulation to protect the public interest. However, nearly as many say that government regulation of business usually causes more harm than good.

Positive opinions about Wall Street have edged lower since 2009. A majority continues to say that Wall Street makes an important contribution to the economy. But most Americans think that Wall Street only cares about making money for itself.

Views of labor unions, which reached all-time lows in the previous political values survey in 2009, have remained stable since then. Nonetheless, fewer say labor unions are necessary to protect working people than did so a decade ago.

Country’s Strength Seen as Linked to Business

Strength of Country Today Mostly Based on Success of Business

Fully 72% of Americans agree that “the strength of this country today is based on the success of American business.” This opinion has endured, largely unchanged, for the past quarter century.

Moreover, it is a value on which there are only modest partisan differences: 77% of Republicans believe the country’s strength is tied to the success of business, as do 71% of both independents and Democrats.

Yet the public also continues to criticize business for being too big, too profitable and failing to serve the public interest. Three-quarters of Americans (75%) agree “there is too much power concentrated in the hands of a few big companies.” About six-in-ten (61%) say that “business corporations make too much profit.” Nearly as many (58%) disagree with the idea that business corporations “generally strike a fair balance between making profits and serving the public interest.”

These opinions have proven resilient over the past 25 years, as has the belief that the country’s strength is tied to the success of business. Criticisms of business have long been divided along partisan lines. In the current survey, 52% of Republicans say business strikes the right balance between profits and the public interest, compared with 37% of independents and just 29% of Democrats.

Deepening Divide over Regulation

Growing Gap over Impact of Government Regulation in Obama Era

No issue relating to business is more politically divisive than the impact of government regulation. In nearly every political values survey since 1987, majorities have agreed that “government regulation of business usually does more harm than good.”

Partisan differences on this measure, while little changed from 2009, are far greater than they were in 2007, the final year of George Bush’s presidency. Fully 76% of Republicans say that government regulation of business does more harm than good, among the highest percentages ever. Just 41% of Democrats agree, one of the lowest percentages ever. In 2007, identical proportions of Republicans and Democrats said government regulation of business did more harm than good (57% each).

The public’s skeptical view of the impact of government regulation of business is balanced by the widespread view that government regulation is needed in a free market economy. Overall, 63% agree that “a free market economy needs government regulation in order to best serve the public interest”; only about half as many (31%) disagree.

Republicans Split over Need for Regulation, Democrats Divided over its Impact

Beyond the wide partisan differences over each of these measures, both parties are divided over the need for – or the impact of – government regulation.

Nearly nine-in-ten Tea Party Republicans (87%) say that government regulation of business does more harm than good. A smaller majority of Republicans who do not agree with the Tea Party, or have no opinion of the movement, agree (65%).

But the larger division among Republicans is over the necessity of government regulation: 68% of Tea Party Republicans disagree with the idea that a free market economy needs government regulation to protect the public interest. Most non-Tea Party Republicans (62%) say that government regulation of the free market is needed.

The Democrats’ internal differences are not as stark, But while conservative and moderate Democrats are divided over whether government regulation of business does more harm than good (48% agree, 45% disagree), most liberal Democrats disagree (65%). Roughly eight-in-ten conservative and moderate Democrats (79%) and liberals (82%) agree that a free market needs government regulation.

Views of Wall Street

Positive views of Wall Street have slipped, though only modestly, since the advent of Occupy Wall Street and an increased focus on economic inequality. Currently, 58% agree that “Wall Street makes an important contribution to the American economy,” down from 63% in 2009.

Majority Says Wall Street Makes Important Contribution, Larger Majority Views it as Greedy

A larger majority (72%) agrees that “Wall Street only cares about making money for itself.” Three years ago, 67% expressed this view.

Large majorities of college graduates (66%) and those with family incomes of $100,000 or more (70%) say that Wall Street makes an important contribution to the economy. About half of those with a high school education or less and those with incomes of less than $30,000 agree (50%, 52%, respectively).

Nearly seven-in-ten Republicans (69%) say that Wall Street contributes significantly to the economy, compared with 57% of independents and 53% of Democrats. Republicans are also less likely than Democrats or independents to say that Wall Street only cares about making money for itself. But sizable majorities across partisan groups – as well as education and income categories – express this view.

Opinions about Labor Unions Hold Steady

Labor Unions Are Necessary to Protect the Working Person

Overall, 64% agree that labor unions are necessary to protect the working person; 33% disagree. Positive views of labor unions have stabilized, after declining by 13 points from 2003 to 2009.

Republicans have grown increasingly skeptical of the need for labor unions. In 2003, 62% of Republicans said labor unions were necessary to protect workers – that figure fell to 53% in 2007 and 44% in 2009. Currently, 43% of Republicans agree that labor unions are necessary, while 54% disagree.

The belief that labor unions are needed also fell among independents from 2003 to 2009, from 76% to 58%. Today, 61% of independents say unions are needed to protect the working person. Democrats remain strong supporters of labor unions: 82% agree that they are necessary, little changed from recent years.

There has been less change over time in opinions about whether labor unions are too powerful. Currently, 57% agree that “labor unions have too much power.” That is little changed from 2009 (61%), or from the first political values survey in 1987 (59%).

Privacy Threats from Business, Government

Growing Privacy Concerns among Republicans

Most Americans are concerned that business and government are accessing too much of their personal information. Nearly three-quarters (74%) say they are concerned that business is collecting too much information about people like them. More than six-in-ten (64%) have the same concern about the government.

While overall trends on these measures have shown little change since 2007, Republicans are increasingly concerned about the personal information being collected by both government and business. Fully 72% of Republicans say they are concerned about the personal information being collected by government, up from just 39% five years ago.

An identical percentage of Republicans (72%) is concerned about business corporations collecting too much personal information, an increase of 14 points since 2007. Opinions among Democrats and independents have shown far less change over this period. Among both Democrats and independents, higher percentages voice concern about business than about government collecting too much personal information.

Section 6: Religion and Social Values

The United States continues to be a highly religious nation. Most Americans say they belong to a particular faith and large percentages agree with statements about key religious beliefs and behaviors.

About three-quarters of the public (76%) say prayer is an important part of their daily life, while an identical percentage agrees that “we will all be called before God at the Judgment Day to answer for our sins.” And eight-in-ten say they never doubt the existence of God.

The percentage of the public agreeing with all three statements has shifted little since the first Pew Research values survey in 1987. That year, 68% of respondents agreed with all three statements; this year 67% do so.

Nonetheless, there are some demographic and partisan differences over religious values. In the current survey, 68% of Millennials say they never doubt the existence of God, a decline of 15 points since 2007. Over this period, the proportion of older age cohorts expressing firm belief in God has remained stable.

I Never Doubt God's Existence

As a result, the gap between the oldest Americans—the Silent generation – and the youngest, which was just six points in 2007, has increased to 21 points today (89% of Silent generation vs. 68% of Millennials)

There have been smaller declines in the percentages of Millennials agreeing to the other two statements about core religious beliefs – the personal importance of prayer and belief in a Judgment Day.

Still, just 55% of Millennials agree with all three religious values; among older age cohorts, two-thirds or more agree with all three religion statements.

Partisan Differences over Religious Beliefs

The partisan gap over the three religious values questions, while substantial, has not increased much in recent years. Currently, 81% of Republicans agree with all three religious values statements, compared with 62% of Democrats and 61% of independents. In the 2007 study, there was a similar gap. In the first political values survey in 1987, however, there were only modest differences in the percentages of Republicans (71%), Democrats (69%) and independents (64%) who agreed with all of these statements.

Bigger Partisan Differences over Religious Beliefs among Whites

The gap between Republicans and Democrats increases dramatically when only white non-Hispanics are considered. African Americans, who make up about a quarter of all Democrats, are more likely than whites to hold more traditional religious values (82% of non-Hispanic blacks agree with all three statements vs. 65% of whites.)

Just half (50%) of white non-Hispanic Democrats agree that prayer is personally very important, never doubt God’s existence and express belief in a Judgment Day. That compares with 60% of white independents and 83% of white Republicans.

Liberal Democrats Less Certain about God's Existence

There are widening ideological differences among Democrats over the statement “I never doubt the existence of God.” The percentage of liberal Democrats who agree with that statement has fallen by 13 points since 2007, from 73% to 60%. In the first political values survey, 84% of liberal Democrats said they never doubted God’s existence. By contrast, conservative and moderate Democrats continue to overwhelmingly say they never doubt God’s existence (91% in 1987, 86% today).

Among white conservative and moderate Democrats, 82% agree that they never doubt God’s existence; 17% disagree. Among white liberal Democrats, about as many agree (49%) as disagree (48%).

Trends in Traditional Values

Partisan Differences on Index of Social Conservatism

While the overall shifts in religious values have been modest, there has been a more clear downward trend over time in the level of conservative views on many social values.

There have been declines in the overall percentages saying that school boards should be able to fire homosexual teachers, they have “old-fashioned” family values, women should return to their traditional roles and books with “dangerous ideas” should be banned from public school libraries. However, nearly as many say there are clear guidelines about good and evil as did so in the 1987 (76% today, 79% then).

Declining Social Conservatism

The average number of conservative responses on an index of five social values questions has dropped from 3.0 in 1987 to 2.3 this year. The index has ticked down in most of the values survey since 1999.

As with religious values, Republicans are more likely than Democrats or independents to hold socially conservative views. On average, Republicans gave 2.7 conservative responses to the five questions on the index, the same as in 2009. Still, that average number of conservative responses has dropped from 3.2 in 1987.

Democrats, on average, gave 2.0 conservative responses, down slightly from 2.3 in 2007 and 3.0 in 1987. On average, independents give conservative responses to 2.2 questions, down from 2.4 in both 2007 and 2009. In 1987, independents gave conservative responses to 2.8 out of the five questions.

Generational change is a factor in the decline in social conservatism. For example, the Baby Boomers offer fewer conservative responses than the Silent generation (2.3 vs. 2.7) and the youngest cohort, the Millennials (1.9), offer fewer than the Baby Boomers.

Views on Traditional Values

Change and Continuity on Social Values

The issue of whether school boards should be able to fire homosexual teachers was divisive in the early political values surveys. At that time 51% agreed that “school boards ought to have the right to fire teachers who are known homosexuals,” while 42% disagreed.

But for more than 20 years, majorities have disagreed with this statement. In the last five years alone, the percentage saying school boards should not have the right to fire openly gay teachers has increased from 66% to 75%.

In recent years, the public also has become much more supportive of rights of gays and lesbians to marry legally. (For more, see: More Support for Gun Rights, Gay Marriage than in 2008 or 2004.)

There also has been change in opinions about “old-fashioned” family values. In the first political values survey, 87% agreed they have “old-fashioned values about family and marriage.” By 2007, 76% agreed with this statement and in the current survey 71% agree.

There has been less change in opinions about whether “there are clear guidelines about what’s good and evil that apply to everyone regardless of their situation.” Nearly eight-in-ten (79%) agreed with this statement in 1987; 76% agree today.

School Boards and Homosexual Teachers

There have been major changes within age cohorts, including the Silent generation, in opinions about whether school boards should be able to fire openly gay teachers. In 1987, a 55% majority of Silents (born 1928-1945) said school boards should have the right to fire openly homosexual teachers. By 2007, just 44% agreed. Since 2007, there has been a further 14-point decline in agreement (to 30%).

Views about Whether School Boards Should be Able to Fire Gay Teachers

While white evangelical Protestants have long been more supportive of school boards’ right to fire homosexual teachers than have members of other religious groups, the percentage of white evangelicals agreeing has fallen by about half – from 73% to 37% – since the first political values survey. As recently as a decade ago, most white evangelicals agreed that school broads should have the right to fire openly homosexual teachers (56% in 2002).

Democrats Split over Family Values

Declining Number Says They Have "Old-Fashioned" Values

Since 1987, there have been declines in the percentages of independents and Democrats who say they have “old-fashioned” family values. But Republicans’ views are largely unchanged.

Currently, 91% of conservative Republicans say they have old-fashioned family values, which is virtually unchanged from 25 years ago (93%). Among moderate and liberal Republicans agree, 82% say they have old-fashioned values.

Conservative and moderate Democrats are far more likely than liberal Democrats to say they have old-fashioned family values (70% vs. 44%). But the share of both groups saying this has declined since 1987; at that time, 90% of conservative and moderate Democrats and 81% of liberals agreed they had old-fashioned values.

Less Support for Banning “Dangerous” Books

Fewer Favor Banning Books with "Dangerous Ideas"

For the first time, a majority (55%) disagrees with the statement: “Books that contain dangerous ideas should be banned from public school libraries.” Four-in-ten agree (40%). In 2009, the public was evenly divided: 49% disagreed and 46% agreed. In 2002, more agreed than disagreed that books with dangerous ideas should be banned from public school libraries (53% vs. 44%).

Over the past decade, agreement with this statement has declined across political and demographic groups. Currently, 46% of Republicans say books with dangerous ideas should be banned, down from 54% in 2002. There also have been declines among Democrats (from 56% to 38%) and independents (47% to 36%).

In 2007, 46% of Millennials agreed that books with dangerous ideas should not be permitted in school libraries, as did 54% in the Silent generation. Since then, however, the percentage of Millennials expressing this view has fallen 18 points (to 28%), while Silents’ opinions have shown little change. As a result, the generational divide has increased considerably.

Section 7: Values About Foreign Policy and Terrorism

For two decades, the public has consistently favored focusing more attention on domestic problems, and less on overseas concerns. At the same time, it has expressed robust support for an active approach to world affairs.

The new survey finds most Americans continuing to hold both points of view. But the number saying the U.S. should concentrate more on problems at home has risen modestly, while support for an active role in world affairs has slipped.

Currently, 83% agree that “we should pay less attention to problems overseas and concentrate on problems here at home.” That is up 10 points since 2002, shortly after the 9/11 attacks, and the highest percentage expressing this view since 1994.

Meanwhile, the number agreeing that “it’s best for the future of our country to be active in world affairs” has fallen from 90% to 83% since 2009, while the percentage disagreeing has doubled, from 7% to 14%.

Notably there are only slight partisan differences over these attitudes. However, the partisan divide over the Reagan-era principle of “peace through strength” remains about as wide as it has been over the past decade. Republicans continue to say that the best way to ensure peace is through military strength, while most Democrats disagree.

Shifting Partisan Views on Global Involvement

More Republicans Now Say Concentrate on Problems at Home

Republican support for focusing greater attention on problems at home has risen sharply since George W. Bush left office. Between 2007 and 2009, the percentage of Republicans favoring more of domestic focus increased 12 points (from 67% to 79%). In the current survey it has risen to 86%, as high as it has ever been in a political values survey.

By contrast, the percentage of Democrats saying the U.S. should focus more on problems at home fell between 2007 and 2009, from 87% to 79% and has remained about the same since then (80%). The current survey marks the first time that a higher percentage of Republicans than Democrats says that the nation should focus less on problems abroad and more on problems at home.

The share of Republicans that completely agrees that more attention should be focused on domestic problems also has increased sharply. Currently, 42% completely agree, up 15 points from three years ago. The proportion of Democrats who completely agree is virtually unchanged (42% today, 41% then).

Nonetheless, there remains widespread support across partisan lines for remaining active in world affairs: 88% of Democrats and 86% of Republicans say it is best for the country’s future to be active in world affairs, which is little changed from recent years. However, since 2009, the percentage of independents expressing this view has fallen by 10 points from 90% to 80%.

Peace through Strength

Best Way to Ensure Peace is Through Military Strength

Since the time of the first political values survey, during Ronald Reagan’s second term, there have been sizable partisan differences over whether the best way to ensure peace is through military strength. But those differences increased sharply in 2003, during the Iraq war, and have remained as wide ever since.

In the current survey, 73% of Republicans say the best way to ensure peace is through military strength, compared with 52% of independents and just 44% of Democrats.

Republicans’ views on this measure have changed little since 2002. But between 2002 and 2003, there were sharp declines in the percentages of Democrats and independents who said that peace is best ensured through military strength. The share of both groups that express this view has changed little since 2003. And the partisan gap in opinions about peace through strength remains about as large today as it was then (29 points now, 25 points in 2003).

Democrats have long been divided ideologically in opinions about peace through strength. In the current survey, 55% of conservative and moderate Democrats say peace is best ensured through military strength, compared with just 30% of liberal Democrats.

Most Say Countries Helped by U.S. Are Resentful

Nearly two-thirds of the public (64%) agrees that “most of the countries that have gotten help from America end up resenting us.” That is little changed from recent years, but there also are increased partisan differences in these views.

Currently, about seven-in-ten Republicans (69%) and independents (68%) agree that others resent the U.S. after receiving assistance, compared with 56% of Democrats. The proportion of Democrats expressing this view has fallen 10 points since 2009, while changing little among independents and Republicans.

The survey finds that fewer half of Americans (43%) say that “we should get even with any country that tries to take advantage of the United States.” Support for this idea reached 61% in 2002, shortly after the 9/11 terror attacks, but fell to 48% the following year and has remained below 50% since then.

Partisan differences in these attitudes are relatively modest: Fewer than half of Republicans (46%), Democrats (41%) and independents (45%) say the U.S. should get even with countries attempting to take advantage.

Views of Anti-Terror Tactics

Concern over Going Too Far in Searches of Terror Sympathizers

The public continues to harbor reservations about suspending some civil liberties in the fight against terrorism. Nearly two-thirds of Americans (64%) say the police should not be allowed to search houses of those who might be sympathetic to terrorists without a court order. These attitudes have changed little since 2003.

This is a rare issue on which there are larger educational differences than partisan divisions. Fully 80% of college graduates say that the police should not be allowed to conduct searches of possible terrorist sympathizers without a court order. By contrast, half (50%) of those with no more than a high school education say police should be allowed to do this. Majorities of Democrats (68%), independents (66%) and Republicans (58%) say the police should not be able to carry out such searches without a court order.

Public Divided over Freedom of Speech for Terrorist Sympathizers

The public is more evenly divided over whether freedom of speech should extend to groups sympathetic to terrorists: 49% say it should not, while 47% disagree. There also are large educational differences over this issue. A majority of those with no more than a high school education (56%) say freedom of speech should not extend to groups sympathetic to terrorists. Most college graduates (61%) disagree.

Comparable percentages of Republicans (54%) and Democrats (51%) oppose extending freedom of speech to groups sympathetic to terrorists; somewhat fewer independents agree (45%).

There are larger differences in opinions among Democrats than between Democrats and Republicans. A majority of conservative and moderate Democrats (58%) say freedom of speech should not extend to groups sympathetic to terrorists; most liberal Democrats (57%) disagree.

The survey finds that a majority of Americans (64%) agree that that “occasional acts of terrorism in the U.S. will be part of life in the future.” That is about the same as the percentage that said this in 2009, but in 2003 nearly three-quarters of the public (74%) said occasional acts of terrorism would be likely.

Fight for U.S., Right or Wrong?

About half of the public (51%) says that “we all should be willing to fight for our country, whether it is right or wrong,” 43% disagree. Opinions on this measure have fluctuated only modestly over the past 25 years. In the first political values survey in 1987, 54% said people should be willing to fight for this country, right or wrong, while 40% disagreed.

Republicans (58%) are more likely than Democrats or independents (49% each) to say that everyone should be willing to fight for the U.S., regardless of the circumstances. Among Democrats, a majority of conservatives and moderates (55%) say everyone should be willing to fight for this country, right or wrong. A majority of liberal Democrats disagree (56%).

Section 8: Values About Immigration and Race

Amid slowing immigration to the United States, there has been a modest shift in views of immigrants. While most Americans still back tighter restrictions on people entering this country,

Modest Decline in Anti-Immigrant Sentiment

the percentage expressing this view is declining. At the same time, the public is divided over whether the growing number of newcomers from other countries threaten traditional American customs and values. As many now disagree (48%) as agree (46%) with this point of view. Three years ago, a narrow 51%-43% majority saw newcomers as a threat to traditional American values.

Views about black progress also have changed somewhat. About four-in-ten (38%) say that there hasn’t been much real improvement in the position of black people in recent years, while 52% disagree. In 2009, shortly after Barack Obama’s inauguration, 31% took this view and 61% disagreed.

Fewer See "Real Improvement" in Blacks' Positions

Most continue to disagree with the statement that discrimination against blacks is rare today. And while an 86%-majority says that society should do what is necessary to ensure everyone has an equal opportunity to succeed, there is little support for making every possible effort to improve the position of minorities even if it means preferential treatment. Whites and blacks and partisan groups hold starkly different opinions on the use of preferential treatment to improve the position of minorities.

The single largest shift across the values tracked by the Pew Research Center over the past 25 years comes in views of interracial dating. This was a controversial issue in 1987 when 48% agreed that “it’s all right for blacks and whites to date each other” and 46% disagreed. In the current survey, 86% agree that it’s alright for blacks and whites to date, up slightly from 83% in 2009.

Views of Immigration and Immigrants

Support Slips for Tighter Immigration Controls

About seven-in-ten (69%) agree with the statement “we should restrict and control people coming to live in our country more than we do now”; 28% disagree. While most continue to favor greater restrictions, the percentage disagreeing with this statement has edged up five points since 2009 and now stands at an all-time high.

Much of the change in views about immigration policy has occurred among Democrats and independents. About six-in-ten Democrats (58%) favor greater restrictions on immigration, compared with 84% of Republicans – largely unchanged in recent years. And three years ago, 77% of independents agreed that greater restrictions on people coming to live in this country were needed. That is down to 69% today.

Growing Partisan Divide over Immigration

When these questions were first asked twenty years ago, there was virtually no difference between the views of Republicans (78% agree), Democrats (74%) and independents (75%).

Republicans have tended to favor stronger restrictions on immigration, and they feel more strongly about it today than in the past. Currently, 56% of Republicans say they completely agree that we should restrict immigration more than we do now up from 50% in 2009. In 1992, 41% of Republicans strongly supported stronger restrictions on immigration.

The effect of immigration on the nation remains a divisive issue. Overall, about as many agree (46%) as disagree (48%) that “the growing number of newcomers from other

Immigrants and Traditional American Values

countries threaten traditional American customs and values.” The percentage expressing this view has dropped slightly from 51% three years ago, but there has been no substantial change in these views over the past decade in which the question has been asked.

Six-in-ten (60%) Republicans say that newcomers threaten traditional American customs and values, compared with just 39% of Democrats. As with other measures, this divide has widened. Ten years ago, 54% of Republicans and 50% of Democrats saw the growing number of newcomers as a threat to American values.

Independents’ views have generally been closer to those of Democrats. Currently, 44% say the growing number of newcomers threatens traditional American customs and values, while 52% disagree.

Blacks view newcomers to the United States as more of a threat to American values (61%) than do whites (48%), while very few Hispanics (29%) express this view.

While Democratic views on immigration have shifted in recent years, there remain large differences within the party on this issue. Race and ethnicity are substantial factors, but even among white Democrats there are significant differences of opinion. Just 14% of white liberal Democrats believe immigrants pose a threat to American values, compared with almost half of white conservative and moderate Democrats (47%). Similarly, white Democrats with a college degree reject this idea, while those with less education are more divided.

Education and ideology also are factors within the Republican Party, but to a lesser degree. Opinions among moderate and liberal Republicans do not differ significantly from those of conservative Republicans. Republicans with college degrees are divided over how newcomers affect American values, while those without a college degree see a negative effect.

Four-in-Ten Bothered When Immigrants Can't Speak English

Roughly four-in-ten Americans (41%) agree that it bothers them when they come in contact with immigrants who speak little or no English, while 57% disagree. Non-Hispanic whites are divided on this, with 46% agreeing and 52% disagreeing.

Far fewer 18-to 29-year-olds agree with this (30%) than older age groups, and there is a substantial education gap: 30% of college graduates agree, compared with 45% of those without a college degree.

But as with many other items, the partisan gap is larger than any others. By a slim 55% to 42% margin, most Republicans say it bothers them when immigrants speak little or no English. By a 69% to 31% margin, most Democrats disagree. Independent views are far closer to those of Democrats; 58% disagree and 41% agree.

Attitudes About Race

The perception that blacks have not made progress in recent years has increased modestly since 2009 among the public at large. And African Americans’ views of black progress, which turned less negative between 2007 and 2009, have changed little since then.

Most Blacks Continue to Say Their Position Has Not Improved

Currently, 61% of blacks say there has been little real improvement in the position of black people in this country. In 2009, 58% of blacks expressed this view; two years earlier, more (69%) said there was not much improvement in blacks’ position.

Meanwhile, more whites say there has been little improvement for blacks than did so in 2009 (33% today, 26% then). The current measure is nearly identical to the 2007 level (34%).

There also continue to be wide partisan differences over perceptions of black progress. Just three-in-ten Republicans say blacks’ position has not shown much improvement, compared with 47% of Democrats, including 43% of white Democrats and 60% of black Democrats.

Views of Discrimination

Discrimination against Blacks is Rare Today

Majorities continue to reject the notion that racial discrimination in this country is rare. Overall, 61% disagree with the statement “discrimination against blacks is rare today,” just 34% agree. Opinion on this question is little changed over the past decade.

Racial and party divides on this question are much more modest than on views of black progress. Majorities of both whites (60%) and blacks (71%) disagree with the statement that discrimination is rare today. And while Democrats (72%) are more likely than other partisan groups to disagree that discrimination against blacks is rare, a majority of independents (61%) and 51% of Republicans also disagree that discrimination against blacks is rare.

Republicans and Republican-leaning independents who agree with the Tea Party,  however, are as likely to agree (49%) as disagree (46%) that discrimination against blacks is rare today. By contrast, more Republicans and GOP-leaners who do not agree with the Tea Party disagree that discrimination against blacks is rare (59%) than agree (37%).

Public Rejects Preferential Policies

Most Oppose Use of Preferences to Improve Position of Minorities

While the public continues to see discrimination against blacks, majorities continue to reject preferential treatment to improve the position of minorities.

About six-in-ten (62%) disagree with the idea that “we should make every possible effort to improve the position of blacks and other minorities, even if it means giving them preferential treatment”; 33% agree. Over the past 25 years, sizable majorities have consistently rejected the use of preferences to improve the position of minorities.

Since 1987, there have been wide racial differences over this issue. In the current survey, 62% of blacks and just 22% of whites say every

More White Democrats Favor Use of Preferences to Aid Minorities

possible effort should be made, including the use of preferential treatment, to improve the position of minorities. In the first political values survey, 64% of blacks and 16% of whites expressed this view.

The partisan gap has increased in recent years, largely because of increased support for minority preferences among white Democrats. For the first time in a political values survey, a majority of Democrats (52%) say that every possible effort should be made to improve the position of blacks and other minorities. Democrats’ support for minority preferences has risen 11 points since 2007.

Currently, 44% of white Democrats favor the use of minority preferences up from 32% in 2009 and 31% in 2007. Views of non-white Democrats have shown far less change; in the current survey, 62% of non-white Democrats say all efforts should be made, including the use of preferential treatment, to improve the position of minorities.

There also are sizable age differences in these attitudes. Young people – who are more racially diverse than older age cohorts – are far more likely than older Americans to say that every effort should be made to improve the position of minorities even if it means preferential treatment: 44% say this, compared with three-in-ten of those 30 and older (30%). The age differences are much narrower when only whites are considered: 30% of whites younger than 30 favor the use of minority preferences, compared with 21% of whites 30 and older.

Views of Interracial Dating

Narrowing Racial Gap in Views of Black-White Dating

The long-term rise in acceptance of interracial dating has continued in the current survey. Overall, 86% agree that “it’s all right for blacks and whites to date each other,” up slightly from 2009 (83%). The percent who completely agree has risen six points and now stands at 62%.

Racial differences over interracial dating, which were substantial in the first political values survey 25 years ago, have narrowed considerably. In 1987, 71% of blacks and just 43% of whites said it was acceptable for blacks in whites to date. Currently, about nine-in-ten blacks (92%) say it is all right for blacks and whites to date as do 83% of whites. The proportion of whites that finds interracial dating acceptable has nearly doubled since 1987.

Younger Cohorts More Supportive of Interracial Dating

There has long been a generational dynamic in views of interracial dating with younger cohorts more accepting than older cohorts. Millennials (born in 1981 or later) have overwhelmingly found interracial dating acceptable. In the current survey, fully 95% agree that it is all right for blacks and whites to date.

By comparison, two-thirds (66%) of those in the Silent generation (born 1928-1945) do not object to interracial dating, a figure that has held steady for several years. In 2007, 67% of Silents said black-white dating was acceptable.

Democrats (94% agree) continue to be somewhat more accepting of interracial dating than are Republicans (79% agree). However, the percentage of Republicans completely agreeing that interracial dating is acceptable has jumped from 41% in 2009 to 53% in 2012. There has been a more modest increase in complete agreement among Democrats (from 63% to 70%).

Section 9: Trends in Party Affiliation

The number of political independents has continued to grow, as both parties have lost ground among the public. Based on surveys conducted this year, 38% describe themselves as independents, up from 32% in 2008 and 30% in 2004.

The proportion of independents is now higher than at any point in more than two decades. Looking back even further, independents are more numerous than at any point in the last 70 years. (For trends in party identification from 1939-2012, see this interactive feature.)

Meanwhile, the percentage of self-described Democrats has fallen from 36% four years ago to 32% today. Republican identification has remained largely stable over this period (24% today, 25% in 2008). In 1991, however, there were nearly equal percentages of Republicans (31%), Democrats (31%) and independents (33%).

The Democrats continue to hold an advantage in leaned party identification: In 2012 surveys, 48% either affiliate with the Democratic Party or lean Democratic while 40% either identify as Republicans or lean toward the GOP. That is little changed from recent years, but in 2008 the Democrats held a 15-point lead in leaned party affiliation (51% to 36%).

Race and Party Affiliation

As has been the case since 2008, a plurality of whites (38%) identify as independents. Among the remainder, more call themselves Republicans (32%) than Democrats (26%). Four years ago, party identification among whites was more evenly divided: 33% were independents, 30% Democrats and 31% Republicans.

African Americans continue to overwhelmingly align with the Democratic Party (69%). But blacks’ identification as Democrats has declined since the mid-1980s; in 1984, nearly eight-in-ten African Americans (78%) said they were Democrats.

By contrast, only about a third of Hispanics (32%) identify as Democrats while nearly half (46%) say they are independents; just 11% of Hispanics identify with the GOP. More than twice as many Hispanics either identify as Democrats or lean toward the Democratic Party as identify with the GOP or lean Republican (57% vs. 24%).

Wide Racial Differences in Party Identification

Gender Gap in Party ID

Men Increasingly Identify as Independents

The percentage of men identifying as independents is up sharply since 2008, from 35% to 43%. The share affiliating with the Democratic Party has fallen from 31% to 27%. About a quarter of men continue to identify with the GOP (27% in 2008, 25% today).

Democrats maintain an advantage in party ID among women. Nearly four-in-ten women (37%) describe themselves as Democrats, compared with 33% who are independents and 24% who are Republicans. The share of women who call themselves independents has risen from 29% in 2008 to 33% this year, while the proportion of Democrats has declined (40% then, 37% today).

Nonetheless, there continues to be a gender gap in party identification. Women are more likely than men to identify as Democrats (37% vs. 27%). That gap has changed little in recent years. Men are more likely than women to identify as independents (43% vs. 33%). About the same percentages of women and men affiliate with the GOP (24%, 25% respectively).

More White Men Eschew Partisan Labels

White men, in particular, are moving away from partisan labels. Currently, 43% of white men say they are independents, up from 36% in 2008 and 33% in 2004. However, the GOP continues to hold a sizable advantage among white men who identify with a party (33% Republican compared with 20% who identify as Democrats).

White women, on the other hand, are more evenly divided: 31% are Democrats, 30% are Republicans and 33% identify as independents. Though these numbers have fluctuated only slightly since 2009, Democrats have lost some ground among white women since 2008 (34% to 31%), while the number of independents has grown (30% to 33%).

Religion and Party Identification

Party Identification and Religious Groups

The Republican Party has gained ground among white evangelical Christians in recent years. Currently, 49% of non-Hispanic white evangelicals say they are Republicans, up from 43% in 2009. The current figure nearly matches the 50% of white evangelicals who identified as Republicans in 2004 and 2005.

Pluralities of white Catholics (39%) and white mainline Protestants (38%) now identify as independents. In 2008, Democrats held a slight edge among white Catholics, while white mainline Protestants were divided in party affiliation (33% independent, 30% Democrat, 30% Republican).

The share of the religiously unaffiliated who identify as independents also has increased. Fully half (50%) of those with no religious affiliation say they are independents, up from 43% in 2008. The share of the religiously unaffiliated who identify as Democrats has fallen over this period, from 37% to 32%. The percentage of Republicans has fluctuated a bit, but is unchanged from four years ago (12% in 2008 and 2012).

Silent Generation Turns More Republican

More Millennials, Gen Xers Identify as Independents

The proportion of independents among the two youngest age cohorts – Millennials and Gen Xers – also has grown in recent years. Meanwhile, the oldest age group – the Silent generation – is turning more Republican.

Among Millennials, the youngest generational group (born 1981-1994), 45% say they are independents, a jump of six points since 2008. At the same time, the share of Millennials who identify as Democrats has dropped from a peak of 35% in the year Obama was elected to 31% today.

There is a similar pattern among Gen Xers (born 1965-1980). Currently, 42% say they are independents, 29% are Democrats and 24% align with the GOP. In 2008, 34% each said they were independents or Democrats, while 25% said they were Republicans.

The number of Baby Boomers (born 1946-1964) calling themselves independents has edged up as well – from 31% in 2008 to 34% this year. Currently, as many say they are independents as say they are Democrats. The number of Baby Boomers saying they identify as Democrats has edged down slightly from 36% in 2008 to 34%, while the number who say they are Republicans is unchanged from four years ago (27%).

The Silent generation (born 1928-1945) is the only one in which Republicans have gained ground since 2008. Currently, 34% say they are Republicans while an equal percentage identifies as Democrats; 27% say they are independents. Four years ago, the Democrats held a 38% to 29% advantage over the GOP among the Silent generation. The proportion of the Silent generation affiliating with the Republican Party is at its highest point in two decades. (For more on age and party affiliation, see “The Generation Gap and the 2012 Election,” Nov. 3, 2011.)

Little Shift in Ideology

Public's Ideological Balance Shows Little Change

Despite electoral swings in recent elections, the fundamental ideological breakdown of the American public has shifted little in recent years. So far in 2012, 36% describe themselves as politically conservative, 22% say they are liberal and 37% say they are moderate.

Throughout 2008, an average of 37% said they were conservative, 21% said they were liberal and 36% said they were moderate. The breakdown in 2004 was only slightly different: 37% conservative, 19% liberal and 39% moderate.

Looking at the breakdown of the adult population within the ideological spectrum of the parties – and among independents – also shows steadiness in recent years, but some longer term shifts.

Over Past Decade, Fewer Moderate Republicans, More Liberal Democrats

As the Republican Party has gotten smaller, it has become more conservative. Currently, 17% of the public identifies as conservative Republicans, while about half as many (8%) are moderates or liberals. That balance has changed little recently, but in the early 2000s there were more GOP moderates; in 2001 and 2002, 12% of the public identified as moderate or liberal Republicans.

The balance of self-reported ideology among Democrats has remained stable in recent years, but also has shifted over the past decade. Currently, 12% of the public calls themselves liberal Democrats, 13% are moderate Democrats and 6% are conservatives. A decade ago, moderate Democrats outnumbered liberals by nearly two-to one (15% vs. 8%).

As the number of independents has grown, the ranks of the independents include more moderates and conservatives. Currently, 18% are moderate independents, 11% are conservatives and 8% are liberals. Six years ago, 15% of the public was made up moderate independents, 8% conservative independents and 7% liberals.

Republicans Unhappy with Party

While both parties have lost adherents, they also are drawing more criticism from their bases. Just 28% of Republicans and Republican-leaning independents say the GOP is doing an excellent or good job in standing up for its traditional positions on issues such as reducing the size of government, cutting taxes and promoting conservative social values. Fully 71% say the party is doing a poor or only fair job in advocating its traditional positions.

Republicans More Critical of Their Party's Performance

The proportion of Republicans and GOP leaners giving the party positive ratings has declined 12 points since November 2010, shortly after the Republicans’ sweeping victories in the midterm elections. Since 2004, there has been only one occasion – April 2009 – when Republicans gave their party lower positive marks. At that time, just 21% said the party was doing a good job in supporting traditional positions.

More Democrats than Republicans give their party positive ratings for standing up for its traditional positions (41% vs. 28%). Still, Democrats are far less satisfied with the party today than they were in April 2009, during the early months of Obama’s presidency. At that time, a majority of Democrats and Democratic leaners (55%) said the party was doing an excellent or good job of standing up for traditional positions, such as protecting the interests of minorities, helping the poor and needy and representing working people.

GOP Gets Better Marks from Conservatives than Moderates

Within the ranks of Republicans and GOP-leaners, about a third of conservatives (32%) say the party has done an excellent or good job of standing up for its traditional positions, compared with just 19% of moderates.

Among Democrats and Democratic leaners, nearly identical percentages of liberals (45%) and conservatives (44%) say the party has done well in advocating its traditional positions; somewhat fewer moderates agree (37%).

About the Values Survey Data

The values project draws on a series of large national surveys conducted since 1987. The project was initiated by the Times Mirror Center for the People & the Press in 1987 and continued by the Pew Research Center for the People & the Press since 1996. Over this period, 15 surveys have been conducted with a total of 35,578 interviews. In the 2012 survey, interviews included 79 questions about political and social values, plus questions about current issues and political figures. Surveys since 2003 include interviews conducted in English and Spanish.

Results for the 2012 values survey are based on telephone interviews conducted April 4-15, 2012, among a national sample of 3,008 adults, 18 years of age or older, living in all 50 U.S. states and the District of Columbia (1,805 respondents were interviewed on a landline telephone, and 1,203 were interviewed on a cell phone, including 603 who had no landline telephone). The survey was conducted by interviewers at Princeton Data Source under the direction of Princeton Survey Research Associates International.

The following table shows the error attributable to sampling that would be expected at the 95% level of confidence for different groups in the 2012 survey:

Sample sizes and sampling error for other subgroups are available upon request. In addition to sampling error, one should bear in mind that question wording and practical difficulties in conducting surveys can introduce error or bias into the findings of opinion polls.

Figures in this report may not add to 100% due to rounding. Whites and blacks are non-Hispanic; Hispanics may be of any race.

Survey Methodology in Detail

Sample Design

A combination of landline and cell phone random digit dial samples were used; both samples were provided by Survey Sampling International. Landline and cell phone numbers were sampled to yield a ratio of approximately two completed landline interviews to each cell phone interview.

The design of the landline sample ensures representation of both listed and unlisted numbers (including those not yet listed) by using random digit dialing. This method uses random generation of the last two digits of telephone numbers selected on the basis of the area code, telephone exchange, and bank number. A bank is defined as 100 contiguous telephone numbers, for example 800-555-1200 to 800-555-1299. The telephone exchanges are selected to be proportionally stratified by county and by telephone exchange within the county. That is, the number of telephone numbers randomly sampled from within a given county is proportional to that county’s share of telephone numbers in the U.S. Only banks of telephone numbers containing three or more listed residential numbers are selected.

The cell phone sample is drawn through systematic sampling from dedicated wireless banks of 100 contiguous numbers and shared service banks with no directory-listed landline numbers (to ensure that the cell phone sample does not include banks that are also included in the landline sample). The sample is designed to be representative both geographically and by large and small wireless carriers.

Both the landline and cell samples are released for interviewing in replicates, which are small random samples of each larger sample. Using replicates to control the release of telephone numbers ensures that the complete call procedures are followed for all numbers dialed. The use of replicates also improves the overall representativeness of the survey by helping to ensure that the regional distribution of numbers called is appropriate.

Respondent Selection

Respondents in the landline sample were selected by randomly asking for the youngest male or female, 18 years of age or older who is now at home (for half of the households interviewers ask to speak with the youngest male first and for the other half the youngest female). If there is no eligible person of the requested gender at home, interviewers ask to speak with the youngest adult of the opposite gender, who is now at home. This method of selecting respondents within each household improves participation among young people who are often more difficult to interview than older people because of their lifestyles, but this method is not a random sampling of members of the household.

Unlike a landline phone, a cell phone is assumed in Pew Research polls to be a personal device. Interviewers ask if the person who answers the cell phone is 18 years of age or older to determine if the person is eligible to complete the survey. This means that, for those in the cell sample, no effort is made to give other household members a chance to be interviewed. Although some people share cell phones, it is still uncertain whether the benefits of sampling among the users of a shared cell phone outweigh the disadvantages.

Interviewing

Interviewing was conducted at Princeton Data Source under the direction of Princeton Survey Research Associates International. Interviews were conducted in English and Spanish. A minimum of 7 attempts were made to complete an interview at every sampled landline and cell phone number. Calls were staggered over times of day and days of the week (including at least one daytime call) to maximize the chances of making contact with a potential respondent. Interviewing was also spread as evenly as possible across the field period. An effort was made to recontact most interview breakoffs and refusals to attempt to convert them to completed interviews. People reached on cell phones were offered $5 compensation for the minutes used to complete the survey on their cell phone.

Response rates for Pew Research polls typically range from 5% to 15%; these response rates are comparable to those for other major opinion polls. The response rate is the percentage of known or assumed residential households for which a completed interview was obtained. The response rate we report is the American Association for Public Opinion Research’s Response Rate 3 (RR3) as outlined in their Standard Definitions. Fortunately, low response rates are not necessarily an indication of nonresponse bias. In addition to the response rate, we sometimes report the contact rate, cooperation rate, or completion rate for a survey. The contact rate is the proportion of working numbers where a request for an interview was made. The cooperation rate is the proportion of contacted numbers where someone gave initial consent to be interviewed. The completion rate is the proportion of initially cooperating and eligible households where someone completed the interview.

Weighting

The landline sample is first weighted by household size to account for the fact that people in larger households have a lower probability of being selected. In addition, the combined landline and cell phone sample is weighted to adjust for the overlap of the landline and cell frames (since people with both a landline and cell phone have a greater probability of being included in the sample), including the size of the completed sample from each frame and the estimated ratio of the size of the landline frame to the cell phone frame.

The sample is then weighted to population parameters using an iterative technique that matches gender, age, education, race, Hispanic origin and nativity, region, population density and telephone status and usage. The population parameters for age, education, race/ethnicity, and region are from the Current Population Survey’s March 2011 Annual Social and Economic Supplement and the parameter for population density is from the Decennial Census. The parameter for telephone status and relative usage (of landline phone to cell phone for those with both) is based on extrapolations from the 2011 National Health Interview Survey. The specific weighting parameters are: gender by age, gender by education, age by education, race/ethnicity (including Hispanic origin and nativity), region, density and telephone status and usage; non-Hispanic whites are also balanced on age, education and region. The weighting procedure simultaneously balances the distributions of all weighting parameters at once. The final weights are trimmed to prevent individual cases from having too much influence on the final results.

Weighting cannot eliminate every source of nonresponse bias. Nonetheless, properly-conducted public opinion polls have a good record in achieving unbiased samples. In particular, election polling – where a comparison of the polls with the actual election results provides an opportunity to validate the survey results – has been very accurate over the years.

Sampling Error

Sampling error results from collecting data from some, rather than all, members of the population. The 2012 survey of 3,008 adults had a margin of error of plus or minus 2.1 percentage points with a 95% confidence interval. This means that in 95 out of every 100 samples of the same size and type, the results we obtain would vary by no more than plus or minus 2.1 percentage points from the result we would get if we could interview every member of the population. Thus, the chances are very high (95 out of 100) that any sample we draw will be within 2.1 points of the true population value. The margins of error reported and statistical tests of significance are adjusted to account for the survey’s design effect, a measure of how much efficiency is lost in the sample design and weighting procedures when compared with a simple random sample.

ABOUT THE PARTY IDENTIFICATION DATABASE

The analysis of changes in party identification over time is based on a compilation of 276 surveys and almost 450,000 interviews among the general public conducted by the Pew Research Center from January 1990 to April 2012. These surveys are combined into one large data file that can be sorted according to a range of demographic characteristics, with comparisons made across different time periods. Yearly totals are calculated by combining all surveys for the calendar year, with appropriate weights applied. The table below shows the number of surveys and interviews conducted each year as well as the margin of error for each yearly sample.