Pew Research Center

FOR RELEASE NOVEMBER 3, 2011

The Generation Gap and the 2012 Election

Overview In the last four national elections, generational differences have mattered more than they have in decades. According to the exit polls, younger people have voted substantially more Democratic than other age groups in each election since 2004, while older voters have cast more ballots for Republican candidates in each election since 2006. The latest […]

FOR MEDIA OR OTHER INQUIRIES:

Communications Department
202.419.4372
www.pewresearch.org

RECOMMENDED CITATION

Pew Research Center, November 2011, "The Generation Gap and the 2012 Election"

About Pew Research Center

Pew Research Center is a nonpartisan, nonadvocacy fact tank that informs the public about the issues, attitudes and trends shaping the world. It does not take policy positions. The Center conducts public opinion polling, demographic research, computational social science research and other data-driven research. It studies politics and policy; news habits and media; the internet and technology; religion; race and ethnicity; international affairs; social, demographic and economic trends; science; research methodology and data science; and immigration and migration. Pew Research Center is a subsidiary of The Pew Charitable Trusts, its primary funder.

© Pew Research Center 2026

Table of contents

  • About Pew Research Center
  • The Generation Gap and the 2012 Election
  • Section 1: How Generations Have Changed
  • Section 2: Generations and the 2012 Election
  • Section 3: Views of Obama and the Political Parties
  • Section 4: Views of the Nation
  • Section 5: Generations and the Great Recession
  • Section 6: Generations and Entitlements
  • Section 7: Views of Government
  • Section 8: Domestic and Foreign Policy Views
  • About the Surveys

The Generation Gap and the 2012 Election

Overview In the last four national elections, generational differences have mattered more than they have in decades. According to the exit polls, younger people have voted substantially more Democratic than other age groups in each election since 2004, while older voters have cast more ballots for Republican candidates in each election since 2006. The latest […]

Overview

In the last four national elections, generational differences have mattered more than they have in decades. According to the exit polls, younger people have voted substantially more Democratic than other age groups in each election since 2004, while older voters have cast more ballots for Republican candidates in each election since 2006.

The latest national polls suggest this pattern may well continue in 2012. Millennial generation voters are inclined to back Barack Obama for reelection by a wide margin in a matchup against Mitt Romney, the Republican candidate who has run the strongest against Obama in many polls. By contrast, Silent generation voters are solidly behind Romney.

In between the youngest and the oldest voters are the Baby Boom generation and Generation X. Both groups are less supportive of Obama than they were in 2008 and are now on the fence with respect to a second term for the president.

One of the largest factors driving the current generation gap is the arrival of diverse and Democratic-oriented Millennials. Shaped by the politics and conditions of the Bill Clinton and George W. Bush presidencies, this group holds liberal attitudes on most social and governmental issues.

In contrast, the Silent generation – whose members reached adulthood between the late 1940s and early 1960s and now make up over 80% of Americans age 65 and older – has held relatively conservative views on social issues and the role of government for most of their lives. Their growing unease, and even anger, about the direction of the country in recent years has moved them further toward the GOP, largely erasing the Democratic Party’s advantage in affiliation.

While the political divides between young and old are deep, there are potential fissures at both ends of the age spectrum. Millennials continue to support Obama at much higher levels than older generations. But Obama’s job ratings have fallen steeply among this group, as well as among older generations, since early 2009. Perhaps more ominously for Obama, Millennials are much less engaged in politics than they were at this stage in the 2008 campaign.

In contrast, Silents – particularly those who affiliate with or lean to the Republican Party – are far more engaged in the presidential campaign than they were at this point in the contest four years ago. While Silents support Romney over Obama by a wide margin, they express highly unfavorable views of both the GOP and the Democratic Party.

Silents prefer the Republican Party on most issues, with Social Security a notable exception. Silents are about evenly divided over whether the Democrats or the Republicans can better handle Social Security. If debate over Social Security and Medicare comes to the forefront, it raises potentially significant cross pressures for Silent generation voters, who rank Social Security among the top issues affecting their 2012 vote.

Growing racial and ethnic diversity, which is concentrated among younger generations, has benefited Democrats. Race and ethnicity are strongly associated with views about government, and in no small part account for some of the greater liberalism of the younger age groups and greater conservatism of older groups.

The polling finds that older generations – Boomers and especially Silents – do not fully embrace diversity. Fewer in these groups see the increasing populations of Latinos and Asians, as well as more racial intermarriage, as changes for the better. For many Silents in particular, Obama himself may represent an unwelcome indicator of the way the face of America has changed. Feelings of “unease” with Obama, along with higher levels of anger, are the emotions that most differentiate the attitudes of Silents from those of the youngest generation.

The nation’s ongoing economic difficulties have affected all generations. But Boomers and Gen Xers are far more likely than either Silents or Millennials to have little or no confidence they will have enough money to finance their retirement. And two-thirds of Boomers ages 50 to 61 who are still working expect to delay retirement because of current economic conditions.

These are the principal findings from two major national surveys exploring generational differences in political attitudes conducted by the Pew Research Center for the People & the Press (Sept. 22-Oct. 4) and the Pew Research Center’s Social & Demographic Trends project (Sept. 1-15). Together, these surveys interviewed 4,413 adults. They have been supplemented with data from other polling over the course of the year and analyses of census data by Pew Social & Demographic Trends.

The study provides a detailed look at the current generational dynamics of American politics. Why are Silent generation voters so angry? How have the political leanings of Baby Boomers evolved? Is the Reagan-era Generation X moving closer to the Democratic column? Will Millennials be as engaged and enthused about Obama as they were in 2008? The answers lie in understanding the broad political, social and economic changes of the past decades and how they have shaped the political leanings of these generations over time.

A Closer Look at … Older Americans

The vast majority of Americans who are 65 and older are members of the Silent generation (ages 66 to 83). They came of age in the Truman, Eisenhower and Kennedy years. Silents favored the Democrats at times during the 1990s, but in recent elections have strongly supported the Republicans. While they aligned more with the Democrats in the 1990s, they have become much more Republican in recent years. The Silent generation “replaced” the Greatest generation, who were more reliable Democratic voters when they constituted the bulk of the senior vote.

Silents increasingly call themselves conservative and they hold the most consistently conservative views about government, social issues and America’s place in the world. Unlike other generations that in recent years have become more supportive of smaller government, they have held conservative views about government for years.

Today, an overwhelming majority of Silents are either angry or frustrated with government. They are the generation that is most strongly disapproving of Barack Obama, for whom a majority did not vote. Silents also are the most politically energized generation, as they demonstrated in the 2010 midterms.

More often than the younger generations, Silents take the American exceptionalist view that the United States is the greatest nation in the world. But fewer older people than young people think that “America’s best days are ahead of us.”

The political discontent of the Silent generation is not economically based. A greater proportion of Silents than younger people say they are financially satisfied, and Silents are less likely to say they often do not have enough money to make ends meet.

Race is a factor in their political attitudes. Silents are the whitest of the generations and are the least accepting of the new face of America. Compared with younger generations, relatively few Silents see racial intermarriage and the growing population of immigrants as changes for the better.

As was the case in 2008, racial attitudes are associated with views of Obama and voting

intentions. And while there is racial intolerance in all generations, it is more prevalent among older than younger age groups.

While Silent generation voters say they are solidly behind Obama’s Republican challengers, there are some signs of potential opportunity for the Democrats. Silents cite Social Security as often as they name jobs as their top voting issue. And while seniors tend to favor the Republican Party on most issues, they are as likely to favor the Democrats as Republicans on Social Security.

Young People

Millennials, who are 18 to 30, have voted more Democratic than older voters in the last four national elections. They came of age in the Clinton and Bush eras, and hold liberal attitudes on most social and governmental issues, as well as America’s approach to foreign policy.

Just as members of the Silent generation are long-term backers of smaller government, Millennials, at least so far, hold “baked in” support for a more activist government.

Millennials have come of age professing an allegiance to the Democratic Party and profoundly little identification with the GOP. Today, half of Millennials (50%) think of themselves as Democrats or Democratic-leaning independents while just 36% affiliate with or lean toward the GOP.

Although they back Barack Obama for reelection by a wide margin in matchups against both Mitt Romney and Rick Perry, just 49% approve of his job performance, down 24 points since February 2009.

Millennials are a racially and ethnically diverse generation. Only 59% of Millennials are white non-Hispanic. They are well acquainted with changing face of America and overwhelmingly think these changes are good for the country.

The racial gap also helps explain the greater liberalism of Millennials when compared with older generations. The racial factor, however, mutes rather than explains away the ideological and partisan gaps between Millennials and older voters. For example, while 57% of all Millennials favor a bigger government with more services, just 44% of white Millennials do. But only about a quarter of whites in older generations (27%) support an activist government.

Similarly, while 61% of all Millennials back Obama in a matchup against Romney, only 49% of white Millennials do. But this compares to 37% of older whites who back the president.

For more on Millennials, see Millennials: Confident. Connected. Open to Change, Feb. 24, 2010.

Middle-Aged Americans

Baby Boomers (ages 47 to 65) are the largest generation. They came of age under presidents Johnson, Nixon, Ford, Carter and Reagan. Boomers had very little allegiance to the GOP during the 1960s and 70s, but were increasingly drawn to the Republican Party starting in the 1980s. Since then, they have tilted to the Democratic Party.

Historically, there has been an age gap within the Baby Boom generation. Older Boomers, who cast their first ballots in the Nixon elections of 1968 and 1972, have voted more Democratic than have younger Boomers who came of age under Ford, Carter and Reagan. In 2008, for example, Obama performed better among older Boomers (currently 56 to 65) than younger Boomers (47 to 55).

Boomers supported Republican candidates in 2010. Currently, they are almost as disillusioned with Obama as are Silents, yet are divided in a matchup between Obama and Romney.

In recent years, more Boomers have come to call themselves conservatives. A majority of Boomers now favors a smaller government that provides fewer services. When they were in their 20s and 3os, Boomers were more supportive of big government. Today, almost as many Boomers as Silents say they are angry with government.

Boomers’ current attitudes bear little imprint from coming of age in an era of great social change. On most social issues, their opinions generally fall between the Silents and the younger age cohorts. And many Boomers express reservations about the changing face of America.

Like younger generations, many Boomers say they are dissatisfied with their financial situation and their anxieties about retirement have increased. In a survey conducted last year, a majority of Boomers (54%) said they were in worse shape financially than they were before the recession. Today, 38% say they are not confident that they will have enough income and assets to last through their retirement years.

Like other generations, Boomers oppose cutting entitlement benefits in order to reduce the budget deficit. They are also part of a multi-generational majority that supports reducing Social Security and Medicare benefits for seniors with higher incomes. However, unlike Silents, Boomers oppose raising the eligibility age for Social Security and Medicare.

Generation X, ages 31 to 46, is the in-between generation. They represent the dividing line on many issues between young and old, but they are not as Democratic and liberal as the younger Millennial generation.

Gen Xers mostly came of age politically in the Reagan, George H.W. Bush and Clinton years. In the 1990s, they divided their loyalties between the parties. In 2000, they split their votes between George W. Bush and Al Gore; they narrowly supported Bush in 2004 and favored Obama by clear margin in 2008.

Gen Xers are less supportive of larger government than they once were. And along with other generations, their views of Obama have become more negative. Gen Xers supported GOP candidates by a small margin in 2010. Currently, as many Gen Xers favor Romney as Obama.

On a range of social issues Gen Xers take a more liberal position than do older voters. Gen Xers are more likely than both Boomers and Silents to favor gay marriage and marijuana legalization, and Gen Xers are far more comfortable with the social diversity of 21st century America.

As with Millennials and Boomers, jobs are the number one voting issue for Gen Xers. And they are increasingly anxious over their financial futures. Fully 46% say they are not confident that they will have enough income and assets to last through their retirement years – the highest percentage in any generation.

Entitlements: Agreement on Principles, Not Policies

The poll finds a fair amount generational agreement on entitlement issues. Majorities across generations say that the federal government does too little for older people. And there is broad agreement that it is more important to maintain current retirement benefits than to reduce the budget deficit, though that view is more widely shared among older than younger generations.

But wide generation gaps exist with respect to a number of proposed reforms to the retirement programs. Silents are lukewarm toward allowing younger workers to invest their Social Security taxes in private accounts and using their Medicare benefits to purchase private insurance. Millennials, in particular, enthusiastically embrace these proposed changes.

Moreover, Silents are more supportive than are younger generations of gradually raising the retirement age for receiving Social Security and Medicare benefits. Roughly half of Silents favor raising the retirement age for these programs; no more than four-in-ten in younger generations agree.

Generational Voting in Red and Blue

One way to look at the political leanings of generations is to sort people by the political environment when they became politically engaged. For example, not so long ago, voters 65 and older were predominantly members of the Greatest generation, most of whom came of age during FDR’s presidency and were fairly reliable supporters of Democrats even into their later years.

As recently as 2004, members of the Greatest generation supported John Kerry by a greater margin than did all voters in that election.

As the Greatest generation has mostly passed from the scene, members of the Silent generation – most of whom came of age politically during the Truman and Eisenhower presidencies – have come to make up an increasing share of voters 65 and older. They have long voted less Democratic than the Greatest generation; in both 2008 and 2010, both Truman- and Eisenhower-era Silents voted more Republican than average.

The Baby Boom is a long generation, spanning many presidencies. The oldest, who turned 18 when LBJ was president, have mostly voted with the national electorate in recent years, though they voted more Republican than average in 2008. Those Boomers who came of age when Nixon was president retained a Democratic leaning, although they have voted with the overall electorate since 2006. The youngest Boomers, who mostly came of age in the Ford and Carter years, have been one of the most reliable Republican voting groups.

Internal divisions within Generation X are even more notable. The older portion of Generation X who came of age during the Reagan and George H.W. Bush presidencies, have voted more Republican than the electorate. In contrast, younger Xers, who became active politically during the Clinton administration, have mostly voted more Democratic than average. Millennials largely came of age during George W. Bush’s presidency and have consistently voted more Democratic by large margins.

Best President in Your Lifetime?

When asked which president has done the best job in their lifetime, more respondents name Bill Clinton and Ronald Reagan than any other presidents. Sizeable numbers in each of the four generational groups, including majorities of Millennials and Gen Xers, cite Clinton as either their first or second choice as the best president. Reagan matches Clinton in mentions among Baby Boomers and members of the Silent generation.

Despite the fact that many of them were quite young during Clinton’s years in office, nearly half (48%) of Millennials say Bill Clinton did the best job of any president in their lifetime. Another 12% cite him as second best. Fewer Millennials (37%) cite Obama as best or second-best. Relatively few (22%) say that George W. Bush was a favorite.

A majority of Xers also named Clinton as best (38%) or second-best (18%), while 43% cite Reagan (34% as best, 9% as second-best). Just 23% of Xers say that Obama is the best or second best president of their lifetimes; 18% cite George H. W. Bush and 14% cite George W. Bush.

Baby Boomers divide their loyalties about evenly between Clinton and Reagan, with 45% citing Reagan in either first (33%) or second (12%) place. About as many name Clinton as the best president (27%) or second-best (15%). About a quarter of Boomers (26%) cite John F. Kennedy.

Only among the Silent generation do presidents in office before Kennedy receive a significant number of mentions. But even among this older group, Clinton and Reagan are essentially tied for the top positions. Reagan is cited by 36% and Clinton by 35% as best or second-best. Kennedy is mentioned by 29%, Dwight D. Eisenhower by 17%, and Harry S Truman and Franklin D. Roosevelt are named by 11% and 12%, respectively.

Section 1: How Generations Have Changed

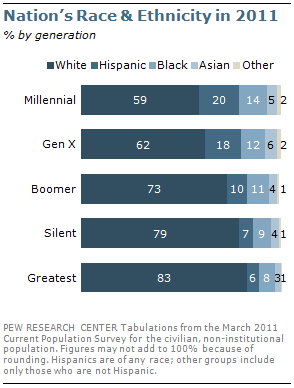
The age differences in political attitudes and voting choices in the past three election cycles have been driven by three broad social and political trends. The first is the growing racial and ethnic diversity of the country, reflected in the rising percentage of non-whites among younger age cohorts. Non-whites have been far more supportive of the Democratic Party in the last several decades. Among members of the Silent generation today, 79% are non-Hispanic whites; among the Millennial generation, just 59% are non-Hispanic whites.

A second factor is the political environment experienced by successive generations as they have come of age politically. The relative popularity of the president and the two major political parties at the time an individual turns 18 has clear consequences for their voting preferences in subsequent elections.

A third factor is the broader societal changes that occur within a generation’s life cycle. These changes have a bigger impact on the political views of younger people, who are still in the process of forming opinions. Older people are more likely to reflect the values prevalent when they were growing up. The greater acceptance of homosexuality and interracial dating among young people than older ones today are examples of this.

Changing Demographics

The contrasting race and ethnic compositions of the nation’s older and younger adults reflect overall change in the U.S., where non-Hispanic whites are a dwindling share of the population. The youngest adults today—Millennials, born after 1980—are far less likely to be non-Hispanic white than are the oldest Americans. While 59% of Millennials are non-Hispanic white, each earlier generation is more likely to be non-Hispanic white, culminating with an 83% share among the oldest Americans, the Greatest generation, born before 1928.

One-in-five Millennials is Hispanic (20%), compared with only 6% among Greatest generation Americans (now ages 84 and older) and 7% among Silent generation adults (ages 66 to 83). The same pattern of greater population share among younger generations is true for blacks, although the contrast between young and old is not as dramatic.

The generational pattern is more complex when it comes to immigration. The recent wave of immigration has contributed to the nation’s growing racial and ethnic diversity, but the youngest adults are not the most likely to be foreign-born. Generation X, ages 31 to 46, contains a higher percentage of immigrants (22%) than the Millennial generation (15%). Millennials, however, stand out as being more likely than all but the oldest Americans to be U.S.-born children of at least one immigrant pa

rent (12%). Among the Greatest generation, many of whose parents came to the United States during the nation’s immigration influx that began in the late 1800s, 17% are U.S.-born children of immigrants.

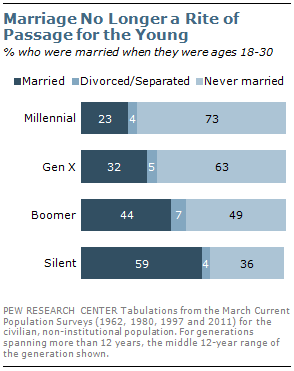
Millennials are far less likely to be married than earlier generations were when they were young. Currently, 23% of 18- to-30-year-olds are married. When Generation X was the same age in 1997 (ages 18 to 30), 32% were married. The equivalent share for Baby Boomers, in 1980, was 44%; for the Silent generation, in 1962, it was 59%. (For more on changes in marriage and the family, see Pew Social & Demographic Trends’ “The Decline of Marriage and Rise of New Families,” Nov. 18, 2010.)

Politics and Early Adulthood

Another major influence on the political character of successive generations is the political climate and events that people in each generation experienced as they reached adulthood and began to form their political identities.

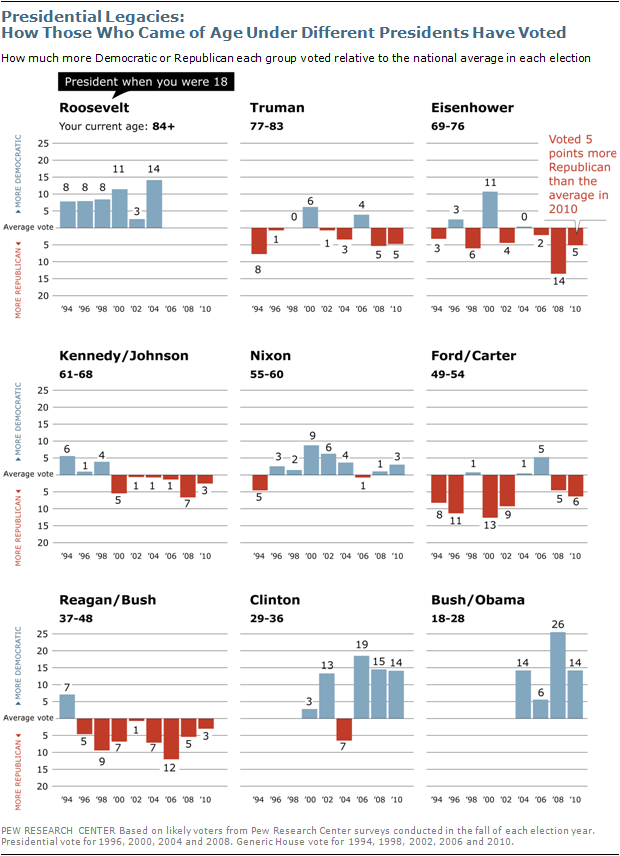
The graphic below shows the relative partisan voting patterns of individuals who reached the age of 18 during the presidential terms of the past 13 presidents. (In some cases, presidential terms are combined.) The label after the president’s names shows the current age of the individuals who turned 18 during those presidential terms. Each bar shows how much more Democratic or Republican that group voted, compared with the average vote for each election.

The clearest pattern is that younger voters who turned 18 during the presidencies of Clinton, Bush or Obama –the younger members of Gen X and the Millennial generation – have typically voted much more Democratic than the average. In contrast, voters who turned 18 during the Ford, Carter, Reagan and Bush Sr. presidencies –much of Generation X and younger Baby Boomers– have voted somewhat more Republican than the average.

The picture is less clear for older generations. Those who turned 18 during the Nixon administration – a segment of older Baby Boomers – have tended to be slightly more Democratic than average in their voting. Those who came of age during the Eisenhower, Kennedy and Johnson years – mostly members of the Silent generation and the very oldest of the Baby Boomers –have tended to be more Republican than the average, especially in 2008.

The Greatest generation is dwindling in numbers, but at least until recently their Democratic tendencies were still evident. Voters who turned 18 during the presidency of Franklin Roosevelt consistently voted more Democratic than average.

Recent Shifts in Voting, Party Affiliation

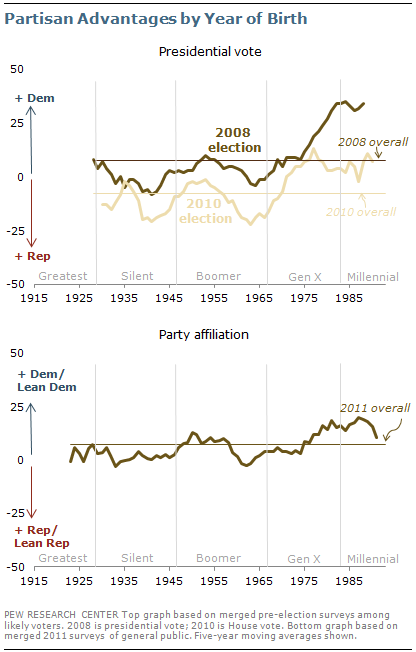
The mark of these early adult political experiences can be seen in recent party affiliation and voting tendencies of individuals according to their year of birth. This graph shows the partisan vote advantage in both 2008 and 2010 (percent Democratic minus percent Republican), as well as party affiliation in 2011.

In addition to showing the pattern according to year of birth, the conventional generational labels defining each birth cohort are also shown. For the vote in 2008 and 2010, the higher the line on the graph, the more Democratic the vote; conversely, the lower the line the more Republican the vote.

For party affiliation among the general public, the line shows the percent in 2011 identifying or leaning Democratic, minus the percent identifying or leaning Republican. The higher the line on the graph, the larger the Democratic advantage.

With the possible exception of the Millennial generation, the voting tendency and partisan leanings vary a great deal within generations, as well as across generations. Voters who came of age during the Eisenhower presidency – the younger half of the Silent generation – have been significantly more supportive of Republican candidates than average in recent elections. On the other hand, older Silents have voted less Republican, especially in 2008. In addition, in 2011 about equal numbers of Silents identify as Democrats and Republicans; for the adult population as a whole in 2011, Democratic affiliation surpasses Republican affiliation by about seven percentage points.

Older Baby Boomers, who came of age during Richard Nixon’s presidency, are more Democratic in their voting. But younger Boomers have been significantly more Republican than average in their party affiliation and voting preferences. The younger half of the Boomer generation came of age during a period of disillusionment with Democrat Jimmy Carter and during the beginning of the popular presidency of Republican Ronald Reagan. In this regard, younger Boomers have more in common with the older portion of Generation X, whose formative political experiences occurred during the later Reagan presidency and the early years of George H. W. Bush, than with older Boomers.

Generation X also is divided: Younger Gen Xers have more in common politically with the Millennial generation than with older Xers, reflecting a clear advantage for the Democratic Party. The percentage of this cohort identifying with or leaning to the Democratic Party or voting Democratic was significantly higher than among older cohorts and grew steadily into the presidency of George W. Bush.

This trend peaked with the election of Barack Obama, but has receded somewhat with the ongoing economic problems in the U.S. The voting preferences of those in the Millennial generation have been more Democratic than in older generations, but the gap was much smaller in 2010 than in 2008.

Generations, Social Issues and Religion

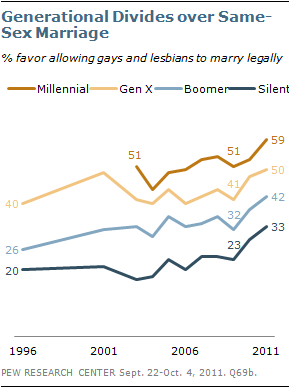
Generational differences in voting and party affiliation also are shaped by underlying values and attitudes that have been undergoing change in the past few decades. One of the clearest examples of generational change in social values is on views of homosexuality. Over the past 15 years, growing percentages in all generations favor gays and lesbians marrying legally.

However, Millennials and Xers remain more supportive of gay marriage than Boomers and Silents, whose early views on the issue were far more conservative than those of Millennials and Xers.

Nearly six-in-ten Millennials (59%) favor gay marriage compared with just 33% of Silents; this wide attitude gap persists even as Silents have become 13 points more likely to favor gay marriage over the past decade and a half.

Among middle-aged generations, more Gen Xers favor (50%) than oppose (42%) allowing gays and lesbians to m

arry legally. Boomers oppose gay marriage by a modest margin (48% to 42%); however, in 1996 Boomers opposed gay marriage by more than two-to-one (66% to 26%).

Attitudes about race also have changed, with younger generations leading the way. While large majorities of all generations now agree that it is all right for blacks and whites to date each other, the percent who completely agree with this statement is dramatically higher among Millennials and Xers than among Boomers and Silents. About three-quarters of Millennials (75%) and Xers (73%) completely agree with interracial dating, compared with far lower percentages of Boomers (57%) and Silents (37%).

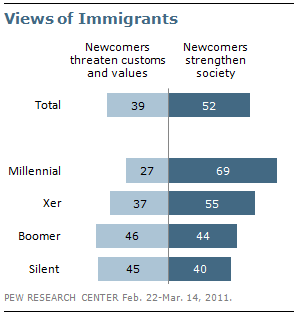
The greater acceptance of diversity among young people extends to views of immigrants and immigration. Overall, about half of the public (52%) says newcomers from other countries strengthen American society, while 39% say they threaten traditional American customs and values.

By a wide margin (69% to 27%), Millennials say newcomers strengthen American society, and most Xers (55%) share this view. Older generations are more divided: Boomers and Silents are about as likely to say newcomers threaten traditional American customs and values as to say they strengthen society.

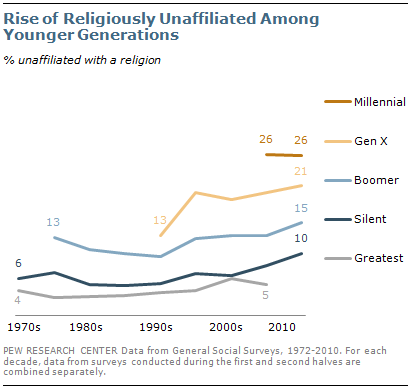
Younger generations also are significantly less likely than older ones to affiliate with a religious tradition. This pattern began in the 1970s when 13% of Baby Boomers were unaffiliated with any particular religion, according to the General Social Survey. That compared with just 6% among the Silent generation and 3% among the Greatest generation.

In the most recent General Social Survey, 26% of Millennial generation respondents said they were unaffiliated, as did 21% of Gen Xers. Among Baby Boomers, 15% were unaffiliated – not significantly different from when they were first measured in the 1970s. And just 10% of the Silent Generation said that they were unaffiliated.

Opinions about Government

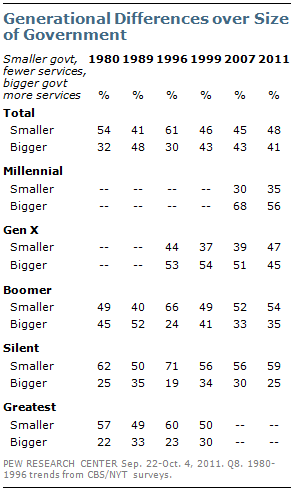
There also are deep generational divides in opinions about government. Overall, 48% of the public prefers a smaller government providing fewer services, while 41% would rather have a bigger government proving more services. This is little changed since 2009; in 2007 and 2008, opinion was more evenly divided.

Silents have long favored a smaller government and this continues to be the case today: Nearly six-in-ten (59%) Silents favor a smaller government providing fewer services, while just 25% favor a bigger government with more services.

Millennials, by contrast, prefer a bigger government providing more services (56%) over a smaller government providing fewer services (35%). Millennials’ preference for bigger government has declined since 2007 when about two-thirds (68%) favored a larger government.

Generation X is divided about evenly: 47% prefer smaller government, 45% bigger government. This marks a change from 2007 and earlier when a modest majority of Xers favored a bigger government.

More Boomers (54%) prefer smaller government than bigger government (35%), a point of view they have held since the 1990s. However, Boomers have not always felt this way: In 1989 more preferred a bigger government providing more services (52%) than a smaller government providing fewer services (40%).

Trust in Government Falls

Just 20% of Americans say they can trust the government in Washington to do what is right just about always or most of the time. Nearly eight-in-ten (79%) say they can trust the government only some of the time (72%) or volunteer that they can never trust the government (7%).

Overall trust in government has changed little over the past year, but is at one of its lowest levels in more than half a century. (For more, see People-Press’s “Distrust, Discontent, Anger and Partisan Rancor,” April 18, 2010.)

Trust in government has fallen among all generations in the past few years. Just 26% of Millennials say they can trust the government always or most of the time, down from 44% in 2004. There have been comparable declines among Gen Xers, Boomers and Silents. In all

three groups, no more than about one-in-five says they can trust in government always or most of the time.

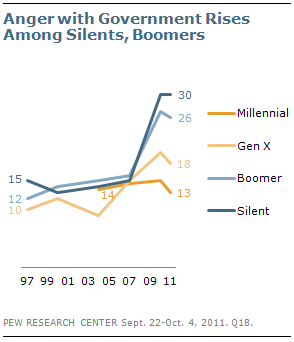
Most Americans also say they feel frustrated with the federal government and anger at the government has been increasing across generations, with the exception of Millennials.

In 2004, just 14% of Silents said they were angry with government – no different from the 14% of Millennials who said the same. Since then, the percentage of Silents who are angry at the government has more than doubled to 30%. But there has been virtually no increase in anger among Millennials (13% currently). Like Silents, more Boomers and Gen Xers say they are angry at the government than did so in 2004 (up 11 points and nine points, respectively).

Liberal and Conservative, by Generation

The generation gap in opinions across a number of issues is reflected in deep differences in how members of each generation describe their political views.

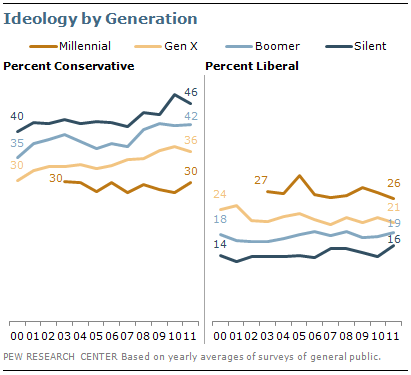
Fully 46% of Silents say they are conservative, while just 16% of Silents say their views are liberal. Since 2000, the percentage of Silents describing their political views as conservative has increased by six points, while the number of self-described liberals has remained largely unchanged.

Among Boomers and Gen Xers, there also are far more conservatives than liberals. And in both groups, the percentage of self-described conservatives has increased since 2000: from 35% to 42% among Boomers, and from 30% to 36% among Gen Xers.

Millennials are the only generation where about as many describe their views as liberal as conservative (26% vs. 30%). Self-reported ideology among Millennials has changed little in recent years.

Section 2: Generations and the 2012 Election

The age gap in voting, which began to open in the 2004 election and became a major factor in Barack Obama’s 2008 victory over John McCain, is not the political norm. In fact, for most of the past four decades, there was little difference in the voting preferences of younger and older Americans. As recently as the 2000 election, younger and older voters – as well as those in-between – were virtually indistinguishable.

Going back 20 years to the 1992 election, younger generations were less likely than seniors to vote Democratic. This partly reflects Ross Perot’s independent appeal, but also the Republican leaning of the early Generation Xers who came of age under Ronald Reagan. The last time age correlated as strongly with Democratic voting as it has in recent years is the 1972 matchup between George McGovern and Richard Nixon, when 18-to-29-year-old voters were 16 points more likely to back the Democrat than were older voters.

Since his 2008 victory, Obama’s support has slipped across all generations, but the age gap has not narrowed. He continues to hold a substantial edge among 18-to-29-year-old voters, while voters age 65 and older currently favor Romney by a slightly larger margin than they backed McCain.

At least as critical to Obama’s fortunes in 2012 is evidence that the enthusiasm and engagement Millennials exhibited four years ago is substantially depleted. While overall interest and engagement levels at this early point in the 2012 election cycle are no lower than they were at a comparable point four years ago, there has been a substantial decline in interest among Millennials, combined with a spike in interest among older voters. As a result, where there was virtually no generation gap in voter engagement four years ago, there is a substantial divide today.

And these shifts have clear partisan implications – it is the younger Democrats who are the most disengaged, while attention among the older Republicans has surged.

2012 Preferences

As voters look toward the 2012 general election, the generational differences that came to the surface in recent election cycles appear to be just as strong. Among all registered voters nationwide, Obama and Romney, who has run strongest against Obama in many polls, are tied: 48% say they would back each at this point. But across generations, Millennial voters (ages 18 to 30) favor Obama by a 61% to 37% margin, while Silent voters (ages 66 to 83) favor Romney by 54% to 41%. The 20-point gap in support for Obama (61% among Millennials vs. 41% among Silents) is almost identical to the 21-point generation gap in the 2008 National Election Pool exit polls, when 66% of younger voters backed Obama, compared with 45% of older voters.

Obama’s support has slipped by similar margins across all generations compared to when he defeated McCain. This erosion of support has particular implications for balance of support among the two middle-aged generations. Generation X voters (ages 31 to 46 today) voted for Obama over McCain by 52% to 46% in 2008, but are split evenly now (47% Obama, 48% Romney).  Baby Boomers (ages 47 to 65) split their vote evenly in 2008, but Romney now holds a six-point edge among these voters today.

The racial and ethnic diversity of Millennials and Generation X plays a role in these generational gaps. Overall, fully 95% of African-American voters, and 60% of Hispanic voters, say they would vote for Obama over Romney; both groups overwhelmingly supported Obama over McCain in 2008. The critical shift between 2008 and 2012 is among white voters, who tend to be older. Romney holds a 20-point lead over Obama among non-Hispanic white voters (58% to 38%). Whites favored McCain over Obama in 2008 by a 12-point margin (55% to 43%).

Obama’s 24-point advantage over Romney among all Millennial voters disappears when looking just at white Millennial voters – he currently runs even with Romney among this group (49% each). In 2008, white Millennials voted for Obama over McCain by a 54% to 44% margin in 2008.

Similarly, while Obama and Romney are virtually tied among all Generation X voters, Romney has a sizable 24-point lead over Obama among white Xers. That margin is comparable to Romney’s lead over Obama among older generations of white voters.

For more on the 2012 election, see “Obama Motivates Supporters, Opponents in Early 2012 Matchups,” Oct. 6, 2011.

Campaign Interest and Engagement

Even at this early stage in the presidential campaign, a sizeable minority of people say they have given a lot of thought to candidates who may be running (29%) and are following news about the presidential candidates very closely (25%). Interest in the presidential campaign is as high as it was at a comparable point in 2007, when both parties had nomination contests underway.

But because of a steep drop in attention among younger people and a notable increase in attention among older people, there is a wide generational gap in attention to the campaign that was not present in 2007. Just 13% of Millennials have given a lot of thought to the 2012 candidates, down from 28% four years ago. And 17% are following election news very closely, down from 24% in the fall of 2007.

Meanwhile, fully 42% of Silents have given a lot of thought to the candidates running for president, up 10 points from four years ago. And the Silent generation is also following election news more closely than in 2007 – 36% are following very closely now, up from 28% in 2007.

So far this cycle, Silents are three times as likely as Millennials to say they have given a lot of thought to the campaign (42% vs. 13%), and twice as likely to be following election news very closely (36% vs. 17%). On both measures, there was very little difference across generations four years ago.

Younger Democrats and Older Republicans

There also is a substantial partisan gap in attention to the campaign. Compared with four years ago, engagement is up among Republicans and Republican leaning independents, and down among Democrats and Democratic leaning independents.

The increased attention among Republicans is in large part driven by the intense interest of older generations. About half (52%) of Republican and Republican-leaning Silents have given a lot of thought to the candidates. That is 20 points higher than in October 2007. There has been a similar shift among GOP Silents in the percentage following election news very closely – from 25% in 2007 to 46% currently. Baby Boomer Republicans also have given more thought to the candidates and are following campaign news more closely now than at a similar point in 2007.

Meanwhile, the drop in Democratic engagement is driven predominantly by the relative disinterest of Millennial Democrats this year. Just 13% of Democratic and Democratic-leaning Millennials have given a lot of thought to the candidates, down from 31% in 2007. And they are following campaign news less closely now than at a similar point in 2007 (19% now, 32% in 2007). All other generations of Democrats are following the campaign about as closely today as they were four years ago.

The lack of attention among Millennial Democrats may simply reflect the fact that there is only a GOP primary this year. Moreover, it is still very early in the campaign cycle and these dynamics may change.

However, there are signs that the fundamental imperative to vote that Millennials felt in 2008 may be less intense in 2012. The share of Millennials who say that they personally care a good deal who wins the 2012 presidential election stands at 69%, down from 81% four years ago. All older generations are far more likely to say the election outcome matters to them personally, with no slippage from four years ago.

And there is some evidence that Millennials feel more disillusioned about the impact of their vote now than in the days after Obama’s victory. In April 2009 – three months after Obama took office – 73% of Millennials agreed with the statement “Voting gives people like me some say about how the government runs things.” That has slipped to 63% today. Over that same stretch, the share of Millennials saying “Elected officials in Washington lose touch with the people pretty quickly” jumped from 67% to 78%. On both questions, other generations have not moved.

Top Issues: Jobs, Deficit and Health Care

Jobs top the list of issues that matter most in deciding which presidential candidate to vote for next year – 63% of voters say jobs is one of the issues that will matter most in their vote. About four-in-ten say the budget deficit (43%) or health care (40%) will matter most. Fewer (29%) report that Social Security will be one of the most important issues to their vote next year. Just 15% of voters say immigration and only 4% report abortion will be among the most important issues to their vote.

Jobs lead the list across all generations. About two-thirds of Millennials, Generation X and Boomers say jobs will be the most or second-most important issue to their vote. Fewer Silent voters (52%) report that jobs will matter most.

Fully 45% of Silent voters say Social Security will matter most to their

vote, nearly as many as say jobs is the issue that will be most important. A third (33%) of Baby Boomers say Social Security is one of the issues that matters most to their vote. Far fewer Gen X voters (20%) and Millennials (13%) say Social Security is a top issue in their vote choice.

Gen Xers are more likely than older voters to cite the budget deficit as an issue that matters most to them. About half (49%) of Xers say the deficit is a top issue in their vote.

Voters who support Obama are more likely than those who support Romney to cite jobs, health care and Social Security as the issues that matter most to their vote. About half (49%) 0f voters who Obama supporters say health care will matter most, compared with 34% of Romney voters. And 32% of Obama backers say Social Security will matter most; fewer Romney supporters (24%) say this is a top issue for them.

Romney supporters are more likely to cite the deficit, immigration and abortion as the issues that matter most to their vote. Nearly as many Romney voters say the deficit is the issue that matters most as say jobs (52% deficit, 60% jobs). By comparison, 34% of Obama voters say the deficit is the issue that matters most to their vote.

Size of Government and 2012 Voter Preferences

While the job situation is a nearly universal priority in 2012, one of the largest factors shaping voter preferences at this early stage in the campaign is views about the size of government. They are more closely related to voter’s preferences for president in 2012 than opinions about social issues, trust and frustration with government, views on immigration, racial attitudes and opinions about entitlement reform.

Fully 69% of voters who prefer a smaller government with fewer services support or lean toward Romney while just 26% back Obama. Among those who prefer a bigger government with more services, candidate preferences are reversed – 78% support or lean toward Obama while 20% back Romney. Overall, 55% of all voters prefer a smaller government.

This pattern holds across all of the generations, and the differences are particularly large among the Boomer and Silent generations, the groups most likely to prefer a smaller government. Among Millennials, the only group in which more prefer a bigger government than a smaller one, the gap is somewhat narrower.

Section 3: Views of Obama and the Political Parties

Barack Obama was elected president in 2008 in large part because of the overwhelming support he received from young people. And in early 2012 matchups, Obama holds substantial leads among Millennials over both Mitt Romney and Rick Perry. However, since early in his presidency, Obama’s job approval rating has fallen substantially across all age cohorts, Millennials included.

Only about half of Millennials (49%) approve of the way Obama is handling his job as president, down 24 points from February 2009. Obama’s job approval is little different among Gen Xers (44% approve), and somewhat lower among Boomers and Silents (40% each).

Throughout much of his presidency, Obama’s job rating has been higher among Millennials than among older age cohorts. In February 2009, shortly after he took office, 73% of Millennials, 63% of Boomers, and 62% each of Gen Xers and the Silent Generation approved of the way Obama was handling his job as president.

Age and race are factors in the positive opinion of Obama among Millennials. Non-whites generally are much more approving of Obama’s job performance than are whites and Millennials are by far the most racially and ethnically diverse age cohort. In addition, white Millennials have less negative views of Obama than do older whites.

Currently, 39% of white Millennials approve of Obama’s job performance while 47% disapprove. Among whites in older age cohorts, comparable percentages approve of Obama’s job performance but more disapprove. Roughly six-in-ten white Gen Xers (60%), Boomers (61%) and Silents (62%) disapprove of the way Obama is handling his job as president.

White Millennials also are less likely to strongly disapprove of Obama’s job performance: 30% of white Millennials very strongly disapprove, compared with 43% of white Gen Xers, 48% of white Boomers and 52% of white Silents. Nonetheless, among Millennials and the older cohorts, more whites strongly disapprove than strongly approve of the way Obama is handling his job.

There is little difference in views of Obama among non-white Millennials, Gen Xers and Boomers. About six-in-ten or more in all three cohorts approve of his job performance. And substantially more in each age cohort strongly approve than disapprove of the way Obama is handling his job. Among the predominantly white Silents, there are too few non-whites to analyze.

How Does Obama Make You Feel?

There are sharp generational differences in negative personal reactions toward Obama, particularly when it comes to feelings of anger and unease. Overall, when asked if Obama makes them feel angry, 29% say yes while 70% say no. Four-in-ten (40%) say Obama makes them feel uneasy, while 53% say they have been disappointed by Obama.

Silents are more likely than those in younger age cohorts to say that Obama makes them feel angry: 40% of Silents say Obama makes them feel this way, compared with 32% of Boomers, 28% of Gen Xers and just 19% of Millennials. In a callback survey of voters shortly after the 2008 presidential election, just 11% of Silents, and comparable percentages of voters in other age cohorts, said Obama made them feel angry.

Even in the afterglow of Obama’s victory, Silents and Boomers were more likely than Gen Xers or Millennials to express unease with Obama, and these differences have persisted. In the current survey, Silents are the only age cohort in which a majority (52%) says Obama makes them feel uneasy; 43% of Boomers, 36% of Gen Xers and 33% of Millennials say Obama makes them feel uneasy.

Notably, the differences between Silents and Millennials in feelings of anger and unease toward Obama are as wide among whites as the overall public. Nearly half of white Silents (46%) say Obama makes them feel angry; 58% say he makes them feel uneasy. Among white Millennials, 22% say he makes them feel angry, while 39% say he makes them feel uneasy.

Overall, there are more modest generational differences in views of whether people feel disappointed by Obama: 59% of Silents express this view, as do 56% of Boomers, 53% of Gen Xers and 47% of Millennials.

Obama Inspires Less Hope, Pride

In the days after the 2008 election, large majorities of those who reported voting in the election said that Obama made them feel hopeful (69%) and proud (65%). Today, just 43% of the public says Obama makes them feel hopeful and 45% say he makes them feel proud.

There have been substantial declines in positive reactions toward Obama across all age cohorts. Yet the change among young people has been particularly striking. Shortly after the 2008 election, 81% of Millennials said Obama made them feel hopeful, while 80% felt proud. Today, only about half of Millennials say Obama makes them feel hopeful (48%) or proud (49%).

Views of Obama’s Economic Policies

Nearly twice as many Americans say Obama’s economic policies have made economic conditions worse than say his policies have made things better (38% vs. 20%). Close to four-in-ten (37%) say that, nearly three years into his presidency, Obama’s policies have not had an effect so far.

The balance of opinion regarding the impact of Obama’s economic policies has grown much more negative since 2009. And it has turned more negative just since the beginning of this year: In January, about as many said Obama’s policies had made things better (28%) as said his policies had made conditions worse (31%).

Boomers and Gen Xers have become critical of the impact of Obama’s economic policies. In January, about the same percentages in both cohorts said Obama’s policies had made conditions better as worse. Currently, more than twice as many Boomers say Obama’s policies have made conditions worse than better (44% vs. 19%). Among Gen Xers, 37% say Obama’s policies have made conditions worse, while 22% say his policies have made things better.

The balance of opinion among Silents, already tilting negative at the start of the year, has grown more so. Millennials, however, continue to express mixed views of the impact of Obama’s economic policies: 26% say his policies have made conditions worse, the lowest percentage of any age cohort, while 22% say they have made conditions better.

Views of the Political Parties

About a year ago, as the GOP headed toward major victories in the 2010 midterm elections, Xers and older age cohorts expressed mixed views of the Republican Party. In September 2010, for example, 48% of Silents said they had a favorable opinion of the Republican Party, while 44% had an unfavorable view.

Today, however, views of the GOP have turned negative among all cohorts – just 38% of Silents have a favorable opinion of the Republican Party, while 55% view it unfavorably. Silents’ opinions of the Democratic Party are equally negative: 39% have a favorable opinion of the Democratic Party and 56% have an unfavorable opinion.

Boomers also have a more unfavorable opinion of the Republican Party than they did about a year ago. In September 2010, 44% viewed the GOP favorably and 49% had an unfavorable impression. Currently, just a third of Boomers (33%) have a favorable opinion of the GOP, while 58% have an unfavorable view. In the current survey, Boomers’ favorable rating for the Democratic Party is 10 points higher than the GOP’s (43% vs. 33%).

Currently, more Gen Xers (47%) have a favorable opinion of the Democratic Party than the Republican Party (39%). And Democrats continue to hold a wide favorability advantage among Millennials (51% favorable toward Democratic Party vs. 34% for GOP).

Parties and Issues

While most Silents view the GOP unfavorably, they prefer the Republicans on several key issues. By 51% to 30%, more Silents say Republicans can better handle the budget deficit than Democrats; Silents also favor the GOP on immigration (by 15 points) and improving the job situation (10 points).

But Silents are divided over which party can better handle health care, abortion and Social Security. More than four-in-ten (44%) say the Democratic Party can do a better job in dealing with the Social Security system while about the same percentage (41%) favors the Republicans.

Millennials have a much more favorable opinion of the Democratic Party than the Republican Party, but they clearly prefer the Democrats on only two issues – representing their views on abortion (by 52% to 32%) and dealing with health care (52% to 36%). Millennials are split over which party can better deal with the Social Security system, improve the job situation, deal with immigration and deal with the federal budget deficit.

Gen Xers say the Democratic Party can do better on dealing with health care (by 49% to 36%). But more say the GOP than the Democrats can do better on dealing with immigration (49% to 34%).

Boomers are conflicted in evaluating which party can better handle major issues. By 49% to 39%, more Boomers say the Democratic Party can do better on health care. Boomers also prefer the Democrats on Social Security (45% to 38%). Notably, older Boomers – those ages 56 to 65 – favor the Democrats on Social Security by 13 points (48% to 35%), while younger Boomers (ages 47 to 55) are divided over which party can better handle this issue. By contrast, Boomers are more likely to say that Republicans can do a better job than Democrats dealing with the federal deficit (47% vs. 37%) and dealing with immigration (44% vs. 36%).

Party Traits: Democrats Lead on Empathy

By wide margins, Millennials, Gen Xers and Boomers say the Democratic Party is “more concerned with the needs of people like me.” Silents are divided; 45% say Democrats are more concerned with the needs of people like them and 42% say the Republicans.

By 50% to 31%, Millennials see the Democrats as better able to bring about the kind of changes the country needs. By contrast, slightly more Silents say the GOP can bring about needed changes (44% to 35%). Gen Xers and Boomers are split over which party can better bring needed change.

Roughly half of Millennials (55%) and Gen Xers (52%) view the Republican Party as “more extreme in its positions,” and 47% of Boomers agree. About as many Silents see the Democrats (43%) as the Republicans (45%) as having more extreme positions.

How Generations View the Tea Party

In 2010, Boomers and Silents, on balance, were more likely to say they agreed than disagreed with the Tea Party movement. But that is no longer the case.

Combining all surveys conducted last year, 34% of Silents said they agreed with the Tea Party, while 22% disagreed. More than four-in-ten (44%) offered no opinion of the Tea Party movement. In surveys conducted through October of this year, opinion is evenly divided: 26% agree and 27% disagree with the Tea Partiers. Nearly half (47%) still offer no opinion.

Among Boomers, the balance among those who offer an opinion has shifted from positive to negative. In 2010, 31% of Boomers said they agreed with the new movement, while 24% said they disagreed; 45% offered no opinion. This year, 24% agree, 28% disagree and 47% offer no opinion.

Opinion among Gen Xers also has turned more negative. In 2010, 23% said they agreed with the Tea Party, while 21% disagreed. In 2011, 19% say they agree with the movement, while 24% disagree. In both years, almost six-in-ten offered no opinion.

More Millennials offer an opinion of the Tea Party movement in 2011 than did so in 2010, but the balance of opinion is largely unchanged. In 2011, 21% say they disagree and 13% agree; nearly two-thirds (65%) offer no opinion. In 2010, 17% disagreed, 13% agreed and 71% offered no opinion.

Section 4: Views of the Nation

The last 50 years have seen dramatic demographic, social and technological changes in this country, and different generations of Americans have their own distinct reactions to these changes. The racial and ethnic makeup of the country has been transformed. The 1950s-era nuclear family is now just one of a growing variety of family arrangements. And the old means of communicating have given way to digital platforms that were unimaginable 50 years ago.

In general, older generations are having a harder time processing these changes, while younger generations are more likely to take them in stride. Among older adults, there is a tension between their belief that America is the greatest country in the world and a sense of pessimism about the country’s future. Younger adults are less convinced of America’s greatness but more comfortable with the path the country is currently on.

Overall, nearly half (48%) say America is the greatest country in the world, and another 42% say it is one of the greatest countries in the world. Fewer than one-in-ten (8%) say the U.S. is not one of the greatest countries in the world.

There are sharp differences across generations on this question. Millennials are the least likely to say the U.S. is the greatest country in the world – 32% hold this view. The share rises with each successive generation, with nearly two-thirds of Silents (64%) saying the U.S. stands above all other nations. This comes in spite of the Silents’ discomfort with many of the societal changes they have witnessed in the past 50 years. Within the Silent generation it is the oldest members who feel most strongly about America’s greatness – fully 72% of those ages 76 to 83 say the U.S. is the greatest country in the world.

The Patriotism Gap

Millennials also are less likely to express strong patriotic sentiments than are older generations. A large majority of Millennials (70%) agree with the statement “I am very patriotic.” But even larger percentages of Gen Xers (86%) Boomers (91%) and Silents (90%) say they are very patriotic.

This gap is not new. In surveys dating to 2003, Millennials have been less likely to say they are very patriotic than have older generations.

Keys to the Nation’s Success

Despite differences over American exceptionalism and feelings of patriotism, generations are largely in agreement about the factors that have contributed to America’s success. Overwhelming majorities – more than 90% across all generations – say “the freedoms we have” are very important in contributing to America’s success.

“Our work ethic” is viewed as a very important factor in America’s success by more than 80% of respondents from each of the four generations. And “our natural resources” are viewed as very important by nearly as many (82% overall).

Roughly three-quarters of all adults (77%) say “our military strength” is very important in contributing to America’s success. Here there are significant differences across generations. While at least eight-in-ten Boomers and Silents say this has been very important to America’s success, only about seven-in-ten Millennials and Gen Xers agree.

Millennials are less likely than others to say “our democratic system of government” has been an important factor in America’s success. Only 62% of Millennials say this has been very important, compared with roughly three-quarters of those older than 30. For the most part, the generations are in agreement about the value of the free market economy in terms of

America’s success. Overall 70% of adults say this has been very important – this includes 66% of Millennials, 71% of Gen Xers, 75% of Boomers, and 69% of Silents. There is much less consensus over the importance of “our religious faith and values.” Fewer than half of Millennials (46%) say religious faith and values have been very important in America’s success. This compares with 64% of Xers, 69% of Boomers and 78% of Silents.

The country’s racial and ethnic makeup is viewed as a somewhat less important factor in America’s success. Overall, 58% of the public says this is a very important factor, and there are no significant differences across generations. However, when respondents were separately asked about specific trends contributing to the increased racial and ethnic diversity of the country, wide generational gaps emerged.

Life in the U.S.: Past and Future

While older Americans are more likely than their younger counterparts to believe the U.S. is the greatest nation in the world, they are more ambivalent about the country’s current trajectory. In a January 2011 Pew Research Center survey, half of Silents (50%) said that life in the United States has gotten worse since the 1960s; 31% said life has gotten better while 17% said life in this country has stayed about the same. Boomers expressed similar views about how life has changed in the U.S.: 46% said it has gotten worse, 29% better, and 20% said it has stayed about the same.

The balance of opinion is just the opposite among Millennials and Xers. Some 46% of Millennials and 45% of Xers say life in the U.S. has gotten better in the past 50 years. Less than one-third of either group says life has gotten worse while roughly one-in-five said it has not changed.

In the same January 2011 survey, a narrow majority (54%) of all adults said they were very or somewhat optimistic about the future of the U.S. over the next 50 years, while 42% felt very or somewhat pessimistic. Majorities across generations expressed optimism about the nation’s long-term future, with one important exception. Fewer than half (46%) of Boomers said they were optimistic, while 51% were pessimistic.

In the current poll, respondents were asked whether America’s best days are ahead of us or behind us. Roughly half (51%) of the public says our best days are ahead of us, while 39% say our best days are behind us.

Millennials and Gen Xers are somewhat more positive than Boomers and Silents about America’s prospects: 55% of both Millennials and Xers say our best days are ahead of us, and 37% from each group say our best days are behind us. Boomers and Silents are more divided; about half of Boomers (48%) and Silents (47%) say America’s best days are still to come.

There is a substantial split among Gen Xers on this question, with younger Xers looking more like Millennials and older Xers looking more like Boomers. Among young Xers, ages 31-38, 61% say America’s best days are ahead of us; among those ages 39-46, only 49% agree.

Changing Face of America

Underpinning these concerns about America’s future are views about specific societal trends which have transformed the country. Respondents were asked to evaluate a variety of changes that have taken place over the last 50 years in American society. The items ranged from the country’s racial and ethnic makeup to the invention of the internet. Millennials consistently express a more positive view of these changes than do older generations.

There are several factors contributing to the nation’s changing racial and ethnic composition. The influx of immigrants has been a key factor, but so has the increase in interracial and interethnic marriage. One-in-seven new marriages in the U.S. in 2008 were between spouses of a different race or ethnicity from one another, according to an analysis of data from the Census Bureau’s American Community Survey (ACS) by the Pew Research Center’s Social & Demographic Trends project.

Overall, the public has a fairly positive reaction to the trend toward inter-marriage. Some 43% of all adults say more people of different races marrying each other has been a change for the better. Only 11% say this has been a change for the worse, and 44% say it has not made much difference. On this measure and others relating to changing racial and ethnic patterns, there are significant differences of opinion across the generations.

Millennials are extremely positive about the trend toward inter-marriage. Six-in-ten say this has been a change for the better. Gen Xers are more ambivalent about this change: 47% see it as a change for the better while 46% say it hasn’t made much difference. Boomers are less likely to see this as a change for the better (36%), though only 14% say it has been a change for the worse. Among Silents, 29% say this has been a change for the better, 16% say it’s been a change for the worse, and 49% say it has not made a difference.

The public is less positive about the influx of new immigrants. Overall, 27% say the nation’s growing population of immigrants has been a change for the better, 37% say this has been a change for the worse, and 29% say it has not made much difference. Roughly one third of Millennials and Gen Xers see the rising share of immigrants as a positive change. Only about one-in-five Boomers and Silents agree. Among the older generations, roughly four-in-ten say the growing population of immigrants has been a change for the worse.

These differences are due in part to the racial and ethnic composition of the generations. Fewer than six-in-ten (59%) Millennials are non-Hispanic whites. This compares with about 79% of Silents. As a result, after controlling for race and ethnicity, the generational differences are more muted. Among non-Hispanic white Millennials, 28% say the growing population of immigrants has been a change for the better; this is not significantly different from the 21% of non-Hispanic white Silents who say the same.

The two largest groups immigrating to the U.S. over the past 50 years have been Asians and Hispanics. Overall, 30% say the growing population of Asians has been a change for the better; about the same percentage (28%) views the growing Hispanic population positively. However, more people say the growing share of Hispanics has been a change for the worse (22%) than say that about the growing share of Asians (12%). Millennials are more positive than any other generational group about the growing population of Asians – 43% say this has been a change for the better, compared with 30% of Gen Xers, 24% of Boomers and 27% of Silents. With regard to Hispanic immigrants, roughly one-third of Millennials and Xers say this group’s growing population has been a change for the better. Among Boomers and Silents, smaller numbers (21% and 22% respectively) say this.

Social Changes: Family and Gender

The generations are also divided over several major social changes that have occurred over the past 50 years. Women have assumed a more prominent role in the labor force, marriage rates have fallen sharply, and the definition of what constitutes a family has broadened considerably. In general, Millennials embrace these changes to a much greater extent than do their older counterparts. Silents, who have witnessed the greatest amount of change over their lifetime, are having the hardest time adjusting to these changes.

Most adults agree that the trend toward more women in the workforce has been a change for the better. Millennials are the most enthusiastic about this change – 82% view it positively. Among Gen Xers and Boomers more than seven-in-ten say this has been a change for the better. Among Silents, 62% say the same.

Views about the changing American family are more sharply divided by generation. In 1960, nearly half of all U.S. households consisted of a married mother and father living with one or more of their own children. By 2008, that share had fallen to roughly one-in-four households. Over this period, falling marriage rates, increasing divorce rates, the growth in cohabitation and the dramatic increase in single parenthood, gave rise to a variety of new family arrangements, according to a report last year by Pew Social & Demographic Trends.

Millennials have a mostly positive view of this overall trend. Nearly half (47%) say the growing variety of family and living arrangements has been a change for the better. Only 16% view this as a change for the worse, and one third (32%) say it has not made much difference. On balance, Gen Xers also see this as a change for the better, however they are less positive than Millennials: 34% say this has been a change for the better, 24% see it as a change for the worse and 34% say it has not made much difference.

Boomers are conflicted about the changes in family structure: 27% say this has been a change for the better, 33% a change for the worse and 31% say it has not made much difference. Silents are much more negative. Only 16% say the growing variety of family types has been a change for the better, while 30% say it has been been a change for the .

Over the past 50 years, the link between marriage and parenthood also has become much more tenuous. The share of babies born to unmarried mothers increased eight-fold from 1960 to 2008. By 2008 four-in-ten babies born in the U.S. were born to an unwed mother. The public tends to react negatively to this trend. Very few adults, regardless of their generation, say this represents a change for the better. However, even on this issue there are sharp generational differences.

Silents overwhelmingly view the trend toward more unmarried parents negatively (76% change for the worse).

Two-thirds (67%) of Boomers and 62% of Gen Xers also say more people having children without being married has been a change for the worse. Fewer Millennials (52%) agree; 40% of Millennials say this change has not made much difference.

Previous surveys by the Pew Research Center’s Social & Demographic Trends project show similar generational splits on other trends relating to family and living arrangements. In a 2010 survey, a majority of Silents (62%) said the trend toward more unmarried couples living together was a bad thing for society. Only 27% of Millennials said the same. Similarly, while 58% of Silents said more gay and lesbian couples raising children was bad for society, only 28% of Millennials agreed. On both of these measures pluralities of Millennials said the trend didn’t make much difference.

Silents Less Positive about Technology Changes

Technological change is another dimension of American life that divides the generations. Millennials grew up with the internet, and they overwhelmingly view its emergence as a change for the better (79%). Strong majorities of Gen Xers (70%) and Boomers (65%) also say

they invention of the internet has been a change for the better. Silents are less persuaded: 45% say the internet has been a change for the better, 27% say it has been a change for the worse, and 11% say it hasn’t made much difference.

Pew Research surveys have consistently found that Millennials outpace older generations in virtually all types of technology use – including the use of social networking cites, cell phone use, texting, and wireless internet use. And Millennials are much more likely than their older counterparts to believe that technology simplifies life rather than making it more complicated. In the Pew Research Center’s 2010 report on Millennials, 74% of this generation said new technologies such as cell phones and the internet make life easier; only 18% said these technologies make life more complicated. Silents are had a much more skeptical view: only 50% said technology makes life easier, while more than one-third (36%) said it makes life more complicated.

Changing Moral Values

The vast majority of American adults – nine-in-ten or more across generations – believe that moral values in this country have changed in the past 50 years. However, the generations differ over whether this has been a change for the better or a change for the worse.

Among Millennials, only 54% say the change in moral values has been for the worse. This compares with 70% of Gen Xers, 77% Boomers and 78% of Silents. Millennials are twice as likely as Xers to say the change in moral values has been for the better (19% vs. 9%), and they are more than three times as likely as Boomers and Silents to view this change positively.

Section 5: Generations and the Great Recession

The nation’s worst economic meltdown since the Great Depression has had a disproportionate impact across generations. While Americans of all ages have felt the effects of the recession, Millennials have been hit harder on the job front, and Boomers and Generation Xers have suffered the greatest losses in terms of home values, household finances, and retirement savings. The Silent generation has survived the economic downturn in better shape. With the help of income from Social Security, Silents view their financial situations more positively than do younger generations.

Moreover, a  report by the Pew Research Center’s Social & Demographic Trends project shows that Americans 65 and older have made dramatic gains relative to younger adults in their overall economic well-being over the past quarter of a century. (For more, see Pew Social & Demographic Trends’ “The Rising Age Gap in Economic Well-Being,” Nov. 7, 2011.)

In the current poll, Silents express a higher level of satisfaction with their personal financial situation than do younger people. Seven-in-ten Silents say they are satisfied with their current finances (35% are very satisfied, another 35% are somewhat satisfied).

Among Boomers, six-in-ten are satisfied with their personal financial situation, with only one-in-four (26%) saying they are very satisfied. Similar shares of Gen Xers (21%) and Millennials (23%) say they are very satisfied with their finances.

In a survey last year by Pew Social & Demographic Trends, nearly half of the public (48%) said that their household finances were in worse shape than before the recession. Boomers suffered the most in this regard: More than half of Boomers (54%) said their household finances gotten worse over the course of the recession, with as many as one-in-five saying their finances were in much worse shape. Among Silents, 44% said they were in worse financial shape as a result of the recession, but just as many volunteered that their finances had not changed during the recession.

Millennials, despite their precarious situation in the job market, were more likely than any other generation to say their finances had improved over the course of the recession (33%). Gen Xers said they suffered more than Millennials but slightly less than Boomers. (For more, see Pew Social & Demographic Trends’ “How the Great Recession Changed Life in America,” June 30, 2010.)

Gen Xers Feeling More Pinched

Overall, Americans are less satisfied with their personal financial situation now than they were in 2009. Millennials, Gen Xers and Boomers all express lower levels of satisfaction now than they did two years ago. Silents’ assessments about their personal financial situation have not changed significantly over this period.

Gen Xers show the most dramatic change in this regard. In the current survey, 57% of Gen Xers say they are satisfied with their personal financial situations while 42% are dissatisfied. In early 2009, more than twice as many Gen Xers were satisfied than dissatisfied with their personal finances (68% vs. 30%).

More Boomers also express dissatisfaction with their finances: 39% are currently dissatisfied, compared with 32% two years ago. Millennials’ views of their personal finances, like those of Silents, have changed very little since 2009.

The increased anxiety about personal finances among Gen Xers and Boomers may be fueled in part by mounting concerns about retirement savings. Although the stock market has rebounded somewhat from its low point in early 2009, Americans have less confidence now than they did in early 2009 in their ability to provide for themselves in retirement. In 2009, roughly seven-in-ten adults were at least somewhat confident that they would have enough income and assets to last throughout their retirement years. In the current poll, 63% expressed at least some confidence.

Over the past two years Gen Xers have lost a great deal of confidence in their ability to provide for themselves in retirement. In the current survey, only 18% of Gen Xers say they are very confident they will have enough income and assets to last throughout their retirement years, down from 30% who were very confident in just two years ago.

Boomers, like Xers, are not highly confident in their retirement finances, though their opinions are largely unchanged from two years ago. Just one-in-five Boomers (20%) say they are very confident in their retirement finances; in March 2009, 25% said the same.

Older Workers and Retirement

Retirement is still a long way off for most Gen Xers, but it is right around the corner for many Boomers. In the current survey, about two-thirds of Boomers (67%) say they are not retired. Among that group, the average age at which they expect to retire is 66. Nearly one-in-four (23%) say they expect to work until they are 70 or older, and 12% say they never plan to retire.

The recession has had a major impact of some Boomers’ retirement plans. Among Boomers ages 50-61 who are still in the labor force, fully two-thirds (66%) say they might have to delay their retirement because of current economic conditions.

The vast majority of Silents are already retired – 90% in the current survey. A small share of Silents and Boomers who are retired report that they still do some type of work for pay. Among older Boomers and Silents who are not yet retired, 42% say they already have had to delay their retirement because of the economy.

Housing and Jobs

The collapse in the housing market has had relatively little impact on Millennials, largely because they are less likely than older Americans to own a home. In a Pew Research survey conducted earlier this year, only 18% of Millennials reported that they owned their own home.

The share of homeowners among Gen X is much higher – 57%. And among Gen Xers who own homes, three-in-four say they bought their home in 2000 or later, during the dramatic rise and fall in home values. One-in-four of these homeowners say their house is worth a lot less than it was before the recession, and 21% say they are underwater on their mortgage – that is, they owe more on their home than they could sell it for today.

Boomers are more likely than Gen Xers to own a home (75%), but they are less likely to have bought their home during the real estate bubble of the past decade. Fewer Boomers than Gen Xers (13%) say that they are underwater on their mortgages.

Silents – the vast majority (82%) of whom are homeowners – are even more removed from the housing crisis. Only 24% of homeowners from the Silent generation bought their home in the past decade; twice as many (50%) bought their home before 1990. Just 4% of Silents report that they are underwater on their mortgages. (For more, see Pew Social & Demographic Trends’ “Home Sweet Home. Still.” April 12, 2011.)

Finding a job during the recession has been a challenge for Americans of nearly all ages, but Millennials have been hit particularly hard. Over the course of the recession, the overall unemployment rate increased by roughly five percentage points. The increase was sharpest among the nation’s youngest workers. Pew Social & Demographic Trends’ 2010 report on the differential impact of the recession showed that 19.1% of workers ages 16 to 24 were unemployed in the fourth quarter of 2009, according to the Bureau of Labor Statistics. That was eight points higher than the unemployment rate for this age group in the fourth quarter of 2007. Both the levels and changes in the unemployment rate were less sizable among older age groups.

In the current survey, two-thirds of Millennials (67%) say they are employed: 38% are employed full-time and 29% are employed part-time. Among Millennials who are not currently employed, 63% say they are looking for work. A similar proportion of Gen Xers who are not working (59%) say they are looking for a job. Among Boomers, only 27% of those who are not working are actively looking for work.

Family Responsibilities

In addition to the broader economic forces that have battered Americans over the past few years, there are other financial burdens and responsibilities closer to home. Many parents and children feel a sense of financial obligation to each other. With the population growing older, the need for family members to provide assistance to one another may increase.

Roughly six-in-ten Americans (62%) think that at some point in their life they will be responsible for caring for an aging parent or another elderly person. Another 13% volunteer that they are currently caring for an aging adult or have done so in the past.

Large majorities of Millennials (86%) and Gen Xers (78%) say they think they will end up caring for an aging parent or another elderly person. Fewer Boomers (52%) expect to care for an aging adult, but 20% say they currently do so or already have done so.

There are wide generational differences in opinions about the responsibilities of family members to each other. On issues relating to aging parents, Millennials advocate a greater level of responsibility on the part of both the parents and the adult children than do older generations.

More than nine-in-ten Millennials and Gen Xers say adult children have a responsibility to care for their elderly parents if they need help. A strong majority of Boomers (83%) agrees this is a responsibility. Most Silents (73%), many of whom are elderly parents themselves, also see this as a responsibility. However, more than one-in-five disagree.

Fully seven-in-ten Millennials (71%) and 64% of Gen Xers say adult children have a responsibility to take an elderly parent into their home if that’s what the parent desires. Among Boomers, 60% say this is a responsibility. Silents are much less likely to agree: 48% say adult children have this responsibility, nearly as many (46%) say they do not.

Millennials are also more likely than those in older generations to say parents have an obligation to leave an inheritance for their children. Nearly half (46%) say parents have a responsibility to save money to hand down to their children after they die. Gen Xers are less likely to see this as a responsibility (36%). Just 26% of Boomers and 22% of Silents agree.

There is much more agreement across generations on the two additional items tested in the poll. Most adults, regardless of generation, agree that parents should pay for a child’s college education. Roughly six-in-ten Millennials, Gen Xers, Boomers and Silents say this is a responsibility.

And most adults agree that parents are not obliged to take in their adult children. Only about one-third from each generation says parents have a responsibility to allow their adult child to live in their home if the child wants to. Roughly two-thirds from each generation say this is not a parent’s responsibility.

Whether or not it is viewed as a responsibility, many families are living together in multi-generational households these days. A recent Pew Research analysis of data collected by the U.S. Census Bureau showed that a record share of Americans now reside in a multi-generational household and that, for many, this has become an economic lifeline. An earlier Pew Research analysis showed that during the recession, many Millennials moved back in with their parents (as many as one-in-four adults ages 18-24 did this). (For more, see Pew Social & Demographic Trends’ “Fighting Poverty in a Bad Economy, Americans Move in with Relatives,” Oct. 3, 2011.)

Families Providing Financial Support

Within families, generations support each other financially – and the support runs both ways. Among adults who have a parent age 65 or older, 39% say they have given financial support

to their parent in the past 12 months. Among adults ages 65 and older, a similar share (44%) say they have given financial support to an adult child.

This financial assistance tends to be more for ongoing expenses than a one-time gift or loan. Among adult children who have given their parents money over the past year, eight-in-ten say that money was for ongoing expenses. Similarly, among older adults who have given money to their adult children, about seven-in-ten say the money was for ongoing expenses.

Survey respondents are more willing to acknowledge giving financial support than they are to say they have received support. Among adult children with a parent age 65 or older, 21% say they have received money from their parent in the past 12 months. Among older adults, just 10% say they have received financial support from their adult children.

The share of adult children who have provided financial support for an elderly parent is significantly higher among blacks and Hispanics than among whites. Fully 64% of black and Hispanic adults with a parent or parents age 65 or older say they have given their parents money in the past year. Among non-Hispanic whites with a parent age 65 or older, only 30% have given money to a parent.

Section 6: Generations and Entitlements

The policy debates over Social Security and Medicare are potentially cross-cutting issues for older generations. Silents, as well as many Boomers, place a high priority on these issues politically and are generally more resistant to major changes or reforms than are younger Americans. As a result, while Silents favor the GOP by wide margins on jobs and the budget deficit, they are as likely to prefer the Democrats when it comes to Social Security. Silent and Baby Boom generation voters who are the most dependent on Social Security, and those who say it is an important issue to their vote, back Obama over Romney by significant margins.

While there are sharp generational differences over entitlement policies and the importance of the issue, there is little evidence of generational resentment or friction over what government provides for seniors. Millennial voters are just as likely as Xers, Boomers and Seniors to say the government does too little, not too much, to support seniors, and young and old alike are more concerned that the programs will run out of money for benefits than about the burden maintaining current benefit levels puts on younger people.

Impressions of Social Security and Medicare

When it comes to the two core entitlement programs serving seniors in America – Social Security and Medicare – there is broad consensus regarding their value to the nation as well as the precariousness of their finances.

Nearly nine-in-ten Americans say each of these programs has been good for the country over the years, and this includes at least eight-in-ten across all generations young and old. Similarly, roughly three quarters say these programs are in only fair or poor shape financially, and this view crosses generational lines as well.

Where the generations differ is in their evaluations of the current effectiveness of these programs. Only members of the Silent generation – the vast majority of whom receive Social Security and Medicare – say these programs do a good job of serving the people they cover. Majorities of Millennials, Generation Xers, and Boomers say the programs do only a fair or poor job.

The younger generations are more supportive of seeing the programs overhauled. Most Millennials (56%) and Gen Xers (66%) say Social Security needs major changes or a complete overhaul. By contrast, most in the Silent generation (62%) say the system works pretty well and needs only minor changes. Boomers, many of whom are on the cusp of receiving Social Security themselves, are more divided – 45% say they think only minor changes are in order, while 50% say major changes need to be made.

Entitlement Policy Proposals

In keeping with their support for major changes, the vast majority of Millennials back proposals that involve some degree of privatization of Social Security and Medicare.

Fully 86% of Millennials support changing the system so younger workers can invest their Social Security taxes in private retirement accounts. And 74% of Millennials favor changing Medicare so future participants can use the benefit toward purchasing private health insurance. Support for both of these ideas drops off among older generations and they garner a decidedly mixed reaction from those in the Silent generation.

When it comes to proposals to gradually raise the eligibility age for these programs, there is substantially more support from those who are mostly retired than from those who are not. About half in the Silent generation favor gradually raising the Social Security retirement age and the Medicare eligibility age. Majorities across all younger generations oppose these ideas.

A third area of proposed entitlement changes – means-testing benefits to reduce what high income seniors receive – divide the country, but not along generational lines. About half (53%) of Americans favor reducing Social Security benefits for seniors with higher incomes as a way to address financial problems with the system, and there is no difference in levels of support across generational lines. Similarly, 55% of the public, including nearly identical percentages across generations, favor reducing Medicare benefits for higher-income seniors.

The Tradeoffs: Priority on Maintaining Entitlement Benefits

Generally, the public is resistant to any cuts in entitlement benefits in order to reduce the budget deficit or reduce the tax burden. By 58% to 35%, most say keeping entitlement benefits as they are is more important than reducing the budget deficit. And by an almost identical 59% to 32% margin, more say that higher priority should be placed on avoiding future Social Security benefit cuts than on avoiding any Social Security tax increases for workers and employers.

Resistance to benefit cuts increases across generations, with both Boomers and Silents siding with preserving entitlement benefits by at least two-to-one. By contrast, Millennials are more divided on both of these questions.

Dependence on Social Security

One factor strongly related to attitudes about entitlements is people’s reliance – or expected reliance – on these programs. A majority of retired adults (56%) say that Social Security is their main source of income. But among those who are not yet retired, two-thirds (65%) say Social Security will not be their main source of income in retirement, while

only a 32% minority say that it will. When probed further, nearly a third (31%) of non-retired adults think they will end up getting no money from Social Security in their retirement.

Not surprisingly, experiences with and expectations about Social Security vary significantly across generations. Among those in the Silent generation – 84% of whom are retired – 58% cite Social Security as their main source of retirement income. Among these, 28% say it is (or will be) their only source of income in retirement, while 30% have other sources to supplement Social Security.

Millennials, currently ages 18 to 30, have starkly different expectations. More than seven-in-ten (72%) Millennials do not expect Social Security to be their main source of retirement income. In fact, 42% of Millennials think they will get no retirement income from Social Security at all, as do 35% of Generation Xers (currently ages 31 to 46).

While around one-in-five Baby Boomers (22%) say they are already retired, most are not, and their expectations about Social Security are mixed. Fewer than half (42%) of Boomers say that Social Security is or will be their main source of income in retirement, with about a quarter (24%) saying it is or will be their only source of income. A majority (56%) says they will have other sources of income that are more important during retirement, though most of these (35% of all Boomers) say they expect to get at least some income from Social Security to supplement their other sources.

People’s dependence, or expected dependence, on Social Security has a significant effect on their attitudes about Social Security policy. In particular, those who say Social Security is or will be their main source of income in retirement overwhelmingly favor maintaining entitlement benefits over deficit reduction as the bigger policy priority. This is particularly true among those in the Silent generation, who have mostly retired already, but also true among Boomers and younger people as well.

Similarly, those who are counting on Social Security as their own primary income source are far more opposed to raising the retirement age for Social Security eligibility. The link between personal need and views on this issue is notably strong among Baby Boomers. Boomers who say Social Security is or will be their main source of income oppose raising the retirement age by more than two-to-one (69% oppose, 29% favor) while Boomers who say other sources of income will be more important are divided (52% oppose, 47% favor).

Social Security Matters More to Older Voters

Social Security trails well behind the job situation, the budget deficit, and health care as key voting issues in 2012. But it is clearly among the top issues for older voters – 45% of Silent generation voters cite Social Security as the most important (25%) or second most important (20%) issue to their vote – rivaling the 52% who say jobs, and slightly more than the percentages citing the budget deficit (39%) or health care (38%) as a top voting issue.

Among Baby Boomers, the job situation outranks Social Security as a top voting issue by two-to-one (66% to 33%), and the gap is even wider among Millennials and Generation Xers.

Financial reliance on Social Security is strongly linked to the importance of the issue to voters. Within the Silent generation, 59% of those who get most of their income from Social Security say it is a top voting issue, compared with just 29% of those who say it is not a main source.

The difference is nearly as large among Boomers – 48% of those who receive or expect to receive most of their retirement income from Social Security rate it as a top voting issue, compared with 23% of Boomers who get most of their income elsewhere.

Social Security and Voting Preferences

Not only is Social Security a higher priority for Silent voters, it is a significantly bigger factor shaping voting preferences among Silents than among younger generations. Among all Silents, Mitt Romney holds a 13-point lead (54% to 41%) over Barack Obama. But among the half of Silent voters who rate Social Security as their first or second most important issue, Obama leads by 10 points (51% vs. 41%). Silent generation voters who do not prioritize Social Security favor Romney by two-to-one (64% to 32%).

The gap is somewhat narrower among Boomers: Those who say Social Security is important to their vote favor Obama by 10 points, while Boomers who do not favor Romney by 13 points. Because just a third of Boomers cite Social Security as a top voting issue, Romney holds a modest six-point lead (51% to 45%) among all voters in this cohort.

These gaps reflect the fact that those who prioritize Social Security tend to favor keeping the program unchanged, and tend to be more reliant on the programs, meaning they are typically from lower income households.

Future Concerns about Entitlements

Across generations, there is broad agreement that the entitlement programs are not on sound financial footing. And there is considerable concern – again, among young and old alike – that in the future there may not be enough money to provide Social Security and Medicare benefits at their current levels.

By contrast, the possibility that keeping these benefits at their current levels may put too much of a financial burden on younger generations is less of a concern – even among young generations themselves.

Majorities of Gen Xers (70%) and Millennials (57%) say they are very concerned that financial shortfalls in Social Security and Medicare may lead to reduced benefits. Fewer Gen Xers (45%) and Millennials (41%) are very concerned that maintaining current benefits may excessively burden young people.

In this regard, Gen Xers and Millennials are in synch with Boomers and Silents; among both groups, more are very concerned about possible benefit reductions than by the possibility than keeping benefits at current levels may place too much burden on younger generations.

Few Think Government Does Too Much for Seniors

Majorities of the public say the federal government does not do enough for older people (60%), the middle class (58%), poor people (57%) and children (57%). On the other hand, nearly two thirds (64%) say the government does too much for wealthy people.

More than half of each generation agrees that the government does not do enough for older people, including 64% among Baby Boomers and those in Generation X. The numbers saying this are slightly lower among the youngest and the oldest generations: 55% of Millennials and 52% of Silents say the government does not do enough for the elderly.

Notably, majorities of Democrats (69%), Republicans (52%) and independents (56%) say the federal government does not do enough for older people.

In addition to their agreement that the government does too little for the elderly, the youngest and the oldest generations both say the government does too much for the wealthy (62% and 63%, respectively). Similar majorities of Gen Xers (66%) and Baby Boomers (68%) say this as well. Substantial majorities of Democrats (76%) and independents (66%) say the government does too much for the wealthy; only about half of Republicans (49%) agree.

The Silent generation is least likely to say the government does not do enough for children. Just more than four-in-ten (44%) say this, compared with 64% of Gen Xers, 59% of Baby Boomers and 57% of Millennials.

On the other hand, the youngest generation is most likely to say that the government does not do enough for the poor: 62% of Millennials express this view, compared with 53% of the Silent generation. Nearly six-in-ten Boomers agree (57%), as well as 54% of those in Gen X.

Looking Out for Older People

The public is divided over whether the government or individuals and their families should be mainly responsible for making sure that retired older adults have at least a minimum standard of living. The differences among generations on this question are relatively small.

Looking at the public as a whole, about four-in-ten (43%) say the government is mainly responsible for ensuring at least a minimal standard of living for older people, while 40% say individuals and their families are mostly responsible. More than one-in-ten (14%) volunteer that both are equally responsible.

Millennials and Boomers are nearly evenly divided. The balance among Gen Xers tilts toward the government (47% vs. 34%), while the Silents tilt slightly more toward individual responsibility (44% vs. 36%).

On this question, the divides are greater across income levels than the generations. Among those with household incomes of $75,000 or more, 51% say individuals should be mainly responsible for making sure older adults getting a basic level of care, while 33% say the government should be. The numbers are reversed among those with household incomes of less than $30,000 (53% say the government should be mainly responsible, 29% say individuals and their families.) Those with incomes between $30,000 and $74,999 are evenly divided (42% each).

When those who say that individuals are mainly responsible are questioned further about whether the government should be responsible if individuals fall short, most agree that the government should be the ultimate backstop. Substantial majorities across all generations say the government should be mainly or partly responsible for ensuring that retired people have a minimum standard of living.

Section 7: Views of Government

For most of their adult lives, members of the Silent generation have been one of the more conservative generations with respect to their view of the role of government. At least as far back as 1980, when Silents were between the ages of 35 and 52, and in the years since, they have generally been more likely than younger generations to say they prefer a smaller government providing fewer services rather than a bigger government providing more services.

Millennials are at the other end of the spectrum; most favor a bigger government; just 35% prefer a smaller government. And over the last few decades, the relative position of Boomers has shifted in a conservative direction. In 1980, when the oldest Boomers were 34, they were slightly more supportive of bigger government than the rest of the country. But by 1996, when the oldest Boomers were 50, they had become more supportive of smaller government than average. That pattern has continued.

Generation X also has shifted in a less liberal direction. In 1996, when the oldest Gen Xers were 31, they were substantially more supportive of a bigger government than the rest of the country. But today, the balance of opinion among Gen Xers is almost identical to that of the nation at large.

Current Economic and Political Debates

The public is equally divided about how the government should address the current economic situation: 48% say reducing the deficit should be the more important priority, while 47% put a higher priority on spending to help the economy recover. In keeping with their broader values about government, the generations differ on this fundamental question. Millennials put economic stimulus (55%) ahead of the deficit (41%), while Boomers and Silents tend to prioritize deficit reduction over stimulus spending. Gen X is about evenly divided on this issue.

The public is also divided over what to do with the health care reform legislation that became law in 2010. Fully 38% want to repeal it, but another 31% want to see the law expanded. Only about one-in-five (22%) want to leave it as is.

Overall, the Silent generation is the least supportive of the health care law, with nearly half (46%) favoring repeal and just 17% saying the law should be expanded. Boomers express similar views with 44% favoring repeal and 27% expansion. Gen X’s attitudes mirror those of the general public, with 37% calling for repeal, 33% calling for expansion and 21% saying the law should be left as is. Millennials are most likely to favor expansion of the law (44%) and least likely to favor its repeal (27%).

The generation gap on this issue is not new. Just prior to the law’s passage in the spring of 2010, Silents were the least likely to favor it. After passage, just a third of Silents (33%) and Boomers (34%) approved, compared with 43% of Xers and 53% of Millennials.

Most See Government as Inefficient

Over the past quarter century, Silents and Boomers have been particularly critical of government performance. Currently, about three-quarters in both groups say that when something is run by the government it is usually inefficient and wasteful. Gen Xers and Millennials have been less critical by comparison. Currently, 57% of Xers and 51% of Millennials say government is usually inefficient and wasteful.

While Millennials are currently among the most positive toward government, their criticism of government performance has risen substantially in recent years. In 2009, 42% described the government as usually inefficient and wasteful. That figure was 31% in 2003.

Concerns about government efficiency have also risen substantially among Boomers. In 2003, 62% described the government as wasteful; that has increased to 76% today. The share of Xers criticizing government performance rose from 43% in 2002 to 53% a year later but has since remained fairly stable.

The Silent generation has been critical of government performance throughout the past quarter century. Yet the percentage of Silents describing government as inefficient and wasteful has risen in the past two years (from 62% in 2009 to 73% currently).

Government for the People?

Beyond the issue of government efficiency is the question of fairness. Across all generations, fewer than half now believe that “the government is really run for the benefit of all of the people.” There are only modest generational differences in these attitudes. But in 2009, Millennials were more likely than older generations to say that government was run for the benefit of all.

In the current survey, 42% of Millennials, 45% of Xers, 43% of Boomers and just 32% of Silents say the government is really run for the benefit of all the people. In April 2009, just a few months after Barack Obama took office, fully 59% of Millennials said the government is run for the benefit of all.

There also has been a decrease in the percentage of Gen Xers saying this, though the decline has been more gradual. In 2003, 57% said the government was run for all, 12 points higher than today.

Silents have consistently been more negative than Millennials and Xers in views of government fairness over the past decade. But in just the last two years, the percentage saying the government is run for all has slipped from 41% to 32%. As a result, Silents are n0w less likely than Boomers to say this.

Government in Daily Lives

Over the course of the past quarter century, a majority has agreed that “the government controls too much of our daily lives.” Currently, 70% of Boomers say this, as do 66% of Silents and 62% of Xers.

Millennials are less likely than Silents or Boomers to express this view, though 54% agree that the government is too involved in people’s daily lives.

Social Safety Net

Generational differences also are evident in views of the government’s responsibilities toward the poor. Silents, in keeping with their preference for smaller government, have been among the least likely to say the government should guarantee every citizen enough to eat and a place to sleep.

Over the past four years, support for the government safety net has dropped. Currently, just 56% of Americans say the government should guarantee everyone food and shelter – the lowest since 1994. This trend has occurred across all generations, but the divide between Silents and Millennials has remained about as large as it was four years ago.

There have been much smaller generational differences when people are asked specifically about the government’s responsibility to take care of people who cannot take care of themselves. Comparable percentages of Millennials (59%), Xers (57%), Boomers (53%) and Silents (54%) say it is the government’s responsibility to take care of the needy.

Equal Rights

Roughly four-in-ten Americans (39%) say they agree that “we have gone too far in pushing equal rights in this country.” About six-in-ten (59%) disagree.

Since the question was first asked in 1987, there generally has been a generational divide in public attitudes, with older generations more likely to say the push for equal rights has gone too far. Currently, 46% of Silents say this, compared with 41% of Boomers, 39% of Gen Xers, and just 28% of Millennials.

Section 8: Domestic and Foreign Policy Views

Generations Divide on Some—Not All—Social Issues

As discussed in Sections 1 and 4, different generations of Americans have starkly different views on some of the social changes occurring in the country today. That’s particularly the case when it comes to trends related to diversity, homosexuality, and secularism.

While Millennials tend to take a more liberal position on most social issues, this is not universally true. Most notably, there is no significant generational difference on one of the most divisive issues in the nation: abortion rights.

Gay Marriage

The American public divides almost evenly today on the issue of allowing gay marriage: 46% favor allowing gays and lesbians to marry legally, while 44% are opposed. Public views on this issue have changed gradually over time; five years ago – in 2006 – 33% favored gay marriage while 56% were opposed. Fifteen years ago – in 1996 – just 27% favored gay marriage while 65% were opposed. But support has grown much more steeply recently. It is up nine points in just the past two years (37% in 2009, 46% today).

Almost six-in-ten Millennials (59%) favor gay marriage, but just a third (33%) of the Silent generation shares this view. About four-in-ten Boomers (42%) support legal marriage for same-gender couples, as does half (50%) of Generation X.

The gradual change over the long term largely reflects the arrival of the new generations politically. Over the course of the past 15 years each younger generation has been more supportive of gay marriage than those older than them. As the younger generations make up

a larger share of the public, the balance of opinion shifts inexorably in that direction.

But the shift toward support for gay marriage has been steeper in recent years because this generational replacement has been augmented by significant attitude changes within generations as well. As recently as 2009, just 23% of Silents supported allowing gay marriage. Now 33% say they do. The increase in the past two years also has been notable among Boomers (from 32% to 42%), Gen Xers (from 41% to 50%) and Millennials (from 51% to 59%).

Attitudes about this issue vary by race across generations. Among whites, 50% support gay marriage; among non-whites, the figure is 39%. Even among Millennials – the generation most in favor of gay marriage – the race gap is large. Two-thirds of white Millennials (67%) favor legalizing gay marriage, compared with 48% of non-white Millennials. Little Change in Abortion Attitudes

Abortion

The dynamics of public opinion regarding abortion stand in stark contrast to the issue of gay marriage. While attitudes about legalizing gay marriage have shifted dramatically, public views on the legality of abortion have been far more stable. And while there are huge generational differences when it comes to gay marriage, the same is not true for abortion.

Just more than half of Americans (54%) think abortion should be legal in most (35%) or all (19%) cases. Fewer (41%) say it should be illegal in most (25%) or all (16%) cases. This is comparable to the balance of opinion in Pew Research Center and ABC/Washington Post surveys over the past 15 years, aside from a brief period in 2009 when the balance of opinion ran about even.

As has been the case in the past, differences by generation are small. About half of Silents (51%) say abortion should be legal in all or most cases. That view is shared by 56% of Boomers, 55% of Generation X and 53% of Millennials. Meanwhile, about four-in-ten in each generation say abortion should be illegal in all or most cases.

The Death Penalty

A majority of Americans – including over half within each generation – favors the death penalty for persons convicted of murder. Still, support has declined substantially over the past 15 years. The change reflects shifting personal attitudes on this issue, as well as more consistent opposition among Millennials.

Overall, more Americans favor (58%) than oppose (36%) the death penalty for persons convicted of murder. But opposition to the death penalty, while still the minority view, has been on the rise for the past 15 years. In 1996, just 18% of Americans opposed the death penalty. Opposition is up six points in just the past year – from 30% in 2010 to 36% today. (A longer Gallup trend shows that the period from the late 1980s to the mid 1990s was a high point in support for the death penalty. Support had been much lower in a trend going back to 1936. For more, see Gallup’s report: “In U.S., Support for Death Penalty Falls to 39-Year Low.”)

Millennials have been consistently more opposed to the death penalty than have older generations. Currently, 51% of Millennials favor the death penalty for persons convicted of murder, while 46% are opposed. In each other generation, support outweighs opposition by nearly two-to-one, with little difference between Silents, Boomers and Generation X.

Overall, support for the death penalty remains higher for whites than for people of other races. Whites favor the death penalty by a 65% to 30% margin. Among nonwhites, just 43% favor the death penalty while 50% are opposed. The greater opposition to the death penalty among Millennials in part reflects the racial and ethnic diversity of that generation. The size of this racial gap is similar across all generations, but nonwhites make up a larger share of the younger groups. Still, younger whites and nonwhites express more opposition to the death penalty than their over-30 counterparts.

Gun Rights and Gun Control

Public attitudes about gun control and gun rights took a sharp turn after Barack Obama took office. Over the previous two decades, majorities of Americans consistently put a higher priority on controlling gun ownership than protecting the right of Americans to own guns. But since early 2009, the public has been divided almost evenly.

In the past, major events have affected the public’s views. Most notably, there was an uptick in support for gun control following the Columbine High School shootings in 1999, and more recently, following the mass killings at Virginia Tech in 2007. But there was no such shift following the Tucson shootings earlier this year that left six dead and Rep. Gabrielle Giffords severely injured.

Millennials continue to be somewhat more supportive of gun control than older generations, but the difference is relatively small. Currently, Millennials support controlling gun ownership over protecting gun rights by a 55% to 43% margin. All other generations are divided about evenly.

Marijuana Legalization

Public attitudes about the legalization of marijuana have shifted dramatically over the past four decades. In 1973, just 20% of Americans said the use of marijuana should be made legal, though this included a substantial 43% of Baby Boomers, who were then still under age 25. Overall support rose to 31% by 1978, but then fell significantly in the 1980s, bottoming out at 16% from 1987 to 1990. Once popular among Baby Boomers, just 18% of Boomers supported marijuana legalization in 1990, when they were between the ages of 26 and 44.

But over the past two decades a growing share of Americans have backed the legalization of marijuana. That number rose to 31% in 2000, 41% in 2010 and 45% in the latest Pew Research Center survey on the issue in March 2011. Still, 50% in the latest survey say the use of marijuana should remain illegal.

Millennials are the only age group in which a majority favors legalizing the use of marijuana – 55% say yes, while 42% say no. Gen Xers are divided about evenly (49% yes, 47% no). Among Silents, opposition continues to outweigh support by roughly two to one (31% yes, 65% no). Though Silents are the least likely to say marijuana should be legal, their current level of support is about the highest it has ever been.

And Baby Boomers, who turned the most sharply against legalizing marijuana in their late 20s and 30s, have now shifted their views again. Currently, 41% of Boomers support legalizing the use of marijuana, while 52% are opposed, roughly the same balance of opinion among Boomers as in 1973.

Foreign Policy

Younger generations hold more liberal values when it comes to U.S. foreign policy. They are more likely than older people to favor multilateralism over unilateralism and the use of diplomacy to ensure peace, rather than a reliance on military strength.

Two-thirds of Millennials (66%) say that relying too much on military force to defeat terrorism creates hatred that leads to more terrorism. A slimmer majority of Gen Xers (55%) agree. But Boomers and Silents are evenly split between this view and the position that using overwhelming military force is the best way to defeat terrorism.

The Iraq and Afghanistan Wars

Millennials, more than any other generation, question the value of the unilateral use of military force and encourage diplomatic engagement. But over the years, Millennials have not been more likely than older generations to oppose the wars in Iraq and Afghanistan. When it comes to Afghanistan, in particular, it is the Silents, who have the greatest reservations.

When asked whether the war in Iraq has been worth fighting considering the costs and benefits, comparable majorities in all generations say no. Overall, 57% say the war has not been worth fighting, while 36% say it has.

A majority of Americans (52%) also says the war in Afghanistan has not

been worth fighting, considering its costs and benefits. There are relatively small generational differences in opinions on this question. But just 32% of Silents say the war has been worth fighting, compared with at least four-in-ten in younger generations.

Younger generations are far more optimistic about the situation in Afghanistan than are their older counterparts. Millennials, and Gen Xers to a slightly lesser degree, mostly think the U.S. will succeed in achieving its goals there. And they are more confident than older generations that Afghanistan will be able to maintain a stable government after most U.S. forces leave the country. Consistent with these views, Millennials and Gen Xers tend to express more support for keeping troops in Afghanistan until the situation has stabilized.

Americans are divided over whether it is appropriate (45%) or inappropriate (48%) for the military to engage in non-combat missions – as it has in Iraq and Afghanistan – such as reconstruction operations intended to strengthen a country’s social, political and economic institutions. A majority of Millennials (53%) view these missions – sometimes

called “nation building” – as appropriate, but just a third of Silents (33%) agree.

Generations also differ over the nation’s foreign policy priorities. While 24% overall say promoting human rights in foreign countries should be a top long-range foreign policy priority, Millennials are more likely to rate this as a top priority than are Silents (29% vs. 14%). By contrast, Silents are about twice as likely as Millennials to say solving that the Israel-Palestinian conflict should be a top priority (39% vs. 21%).

Terrorism and Civil Liberties

Though many Millennials were very young at the time of the Sept. 11 terrorist attacks in 2001 there is little doubt that it remains a vivid memory. Virtually all adults (97%) say they can

remember exactly where they were or what they were doing when they first heard the news. This includes nearly all Millennials (97%), who were between 8 and 20 years old at the time of the attacks. The figure is just as high among the youngest Millennials – who were ages 8 to 12 at the time – as among the oldest.

While the recollection is distinct, Millennials are far less likely to describe the attacks as something that moved them or affected them emotionally. More than half (55%) of Millennials say the 9/11 attacks affected them a great deal emotionally, but among older generations, at least eight-in-ten say this. Still, Millennials are about as likely as the public as a whole to say that the Sept. 11 attacks fundamentally changed life in America (68% of Millennials, 61% of public).

One stark difference across generational lines is how people look back at America’s actions prior to the attacks. Younger Americans are far more likely to say that there are things the U.S. did wrong in its dealings with other countries that might have motivated the Sept. 11 attacks. A slim majority (53%) of Millennials, along with 47% of Gen Xers, say the U.S. did things that may have motivated the attacks. This view is less prevalent among Boomers (39%) and especially Silents (30%).

Civil Liberties

Millennials take a starkly different position than older generations when it comes to the tradeoff between civil liberties and security from terrorism. By nearly three-to-one (72% vs. 25%) Millennials say it will not be necessary for the average American to give up some civil liberties in order to curb terrorism. All other age groups are divided over this issue.

There are only modest generational differences in opinions about whether airports should be allowed to conduct extra checks on people of Middle Eastern descent. However, Millennials are more concerned than older generations about government monitoring of Muslims. Most Millennials (55%) believe U.S. policies single out Muslims for increased surveillance, and 37% say this bothers them. Far fewer Xers (23%), Boomers (20%) or Silents (19%) are bothered by this kind of policy.

But Millennials are not uniformly opposed to government anti-terrorism policies that could be seen as infringing on civil liberties. For example, half of Millennials (50%) favor government monitoring of credit card purchases as a measure to curb terrorism. Just 32% of Silents agree. And there are no substantial generational differences over requiring a national ID card.

In addition, there are only modest differences in attitudes about the government use of torture against suspected terrorists in order to gain important information. Overall, 54% of Americans believe this can be often or sometimes justified, including roughly half in all generational groups.

Free Trade and China

Millennials stand out for their strong support of free trade. By about two-to-one (63% to 30%) more Millennials say free trade agreements are good for the country rather than bad. Other generations are divided about evenly on this question.

Moreover, nearly seven-in-ten Millennials (69%) say it is more important to build a stronger economic relationship with China; just 24% say it is more important to get tough with China on economic issues. Gen Xers on balance favor building stronger economic ties with China, but by a much smaller margin (53% to 41%). Boomers and Silents are about evenly divided over this.

Immigration

The public has long endorsed measures aimed at restricting the flow of illegal immigration, as well as a so-called path to citizenship for people in this country illegally. A large majority (78%) favors stronger enforcement of immigration laws and border security. Nearly as many (72%) favor providing a way for illegal immigrants already in the country to gain legal citizenship if they meet certain requirements.

Younger generations are more likely to favor creating a path to citizenship than are older ones. Eight-in-ten Millennials (81%) favor providing a way for illegal immigrants currently in the country to gain legal citizenship if they pass background checks, pay fines and have jobs. Three-quarters of Gen X (76%) also favor this approach, but fewer Boomers (68%) and Silents (61%) do.

When it comes to immigration enforcement, at least eight-in-ten Xers, Boomers and Silents favor enhancing it. Fewer Millennials (68%) favor stronger enforcement of immigration laws and border security.

Americans are divided over whether to build a fence along the entire border with Mexico: 46% favor this idea and 47% oppose it. Millennials are the only generation in which a majority (55%) opposes building a fence along the border with Mexico.

The Environment, Energy and Climate Change

There are deep generational divides over the nation’s energy and environmental priorities, and in terms of general values, it is the Silent generation that stands apart. In setting America’s energy policy priorities, 71% of Millennials say we should focus on developing alternative energy sources rather than expanding oil, coal and natural gas exploration. Roughly the same number of Gen Xers (69%), and a broad majority of Boomers (60%) agree. But among Silents, opinion is more divided; 47% say alternative energy should be the priority, while 40% say the country should focus on expanding exploration and production of fossil fuels.

The pattern is similar in how the generations evaluate the impact of environmental laws and regulations. Just over half (53%) of Americans say these laws are worth the cost, including most Millennials, Gen Xers and Boomers. A 39% minority of Americans say stricter environmental laws and regulations cost too many jobs and hurt the economy. This figure rises to 49% among the Silents.

These generational differences extend to specific policy proposals as well. A March Pew Research Center survey found overwhelming majorities of Millennials (82%), Xers (80%) and Boomers (74%) favoring increased federal funding for wind, solar and hydrogen technologies. Barely half of Silents (54%) agreed. And while the three younger generations clearly favor tax incentives for people who buy hybrid or electric vehicles, Silents tend to be opposed.

While Americans, on balance, prioritize investment in alternative energy sources over expanding fossil fuel production, most support both ideas. By a 57% to 37% margin, most favor allowing greater offshore oil and gas drilling in U.S. waters. (Support had decreased to a low of 44% in the wake of the summer 2010 BP oil spill in the Gulf of Mexico.) Both Boomers and Silents endorse expanded offshore drilling by more than two-to-one, while Xers and Millennials are more divided.

Public support for promoting the increased use of nuclear power fell to 39% in the wake of the catastrophic damage to a Japanese nuclear power plant following the March 2011 earthquake and tsunami there. Even so, a modest generational divide persisted, with Millennials and Xers expressing more opposition to expanded nuclear power (58% each) than Silents (38%).

Perspectives on Climate Change

A majority of Americans (58%) say there is solid evidence that the average temperature on earth has been getting warmer, according to the most recent Pew Research Center survey on this issue in March of this year. Among those who say the earth is warming, more say it is caused by human activity (36%) rather than natural patterns (18%).

Millennials are slightly more likely than the older generations to say there is solid evidence of warming and that the warming is caused mostly by human activity. Currently, 64% of Millennials say they think the earth is getting warmer, a view shared by 59% of Xers and 55% of Silents and Boomers. And Millennials are almost twice as likely as Silents to say that global warming is caused mostly by human activity (43% vs. 22%).

The overall share of Americans who say the earth is warming has declined over the past five years. In 2006, 77% said there is solid evidence of global warming. That fell sharply from 71% in 2008 to 57% in 2009 and now stands at 58%.

The decline in the view that the earth is warming has occurred across generational lines. Currently, 64% of Millennials say there is solid evidence that the average temperature on earth has been warming, down from 80% in 2006. There has been a similar shift among Silents from 76% in 2006 to 55% this year.

As reported in 2009, the public’s views on climate change have become increasingly partisan, and there continues to be a wide partisan divide on this issue. Pew Research Center polling over the past three years has found that twice as many Democrats and Democratic-leaning independents say there is solid evidence of global warming than Republicans and GOP-leaning independents (76% vs. 38%).

Among Democrats and leaners, there is virtually no generational divide on whether there is solid evidence of warming (about three-fourths in all generations say this) and only a modest divide on whether warming is caused by human activity (55% of Millennial Democrats say this, compared with 43% of Silent Democrats).

But there are generational differences among Republicans. About half (49%) of Millennial Republicans and Republican leaners say global warming is occurring, compared with 33% of Silent Republicans. There also is a generational gap among Republicans on whether warming is caused mostly by human activity (29% of Millennial Republicans say this compared with just 9% of Silent Republicans).

About the Surveys

Most of the analysis in this report is drawn from two telephone surveys.

The survey by the Pew Research Center for the People & the Press was conducted September 22-October 4, 2011, among a national sample of 2,410 adults, 18 years of age or older, living in all 50 U.S. states and the District of Columbia (1,442 respondents were interviewed on a landline telephone, and 968 were interviewed on a cell phone, including 462 who had no landline telephone). The survey was conducted by interviewers at Princeton Data Source under the direction of Princeton Survey Research Associates International. A combination of landline and cell phone random digit dial samples were used; both samples were provided by Survey Sampling International. Interviews were conducted in English and Spanish. Respondents in the landline sample were selected by randomly asking for the youngest adult male or female who is now at home. Interviews in the cell sample were conducted with the person who answered the phone, if that person was an adult 18 years of age or older. For detailed information about our survey methodology, see https://alpha.pewresearch.org/pewresearch-org/politics/methodology/

The combined landline and cell phone sample are weighted using an iterative technique that matches gender, age, education, race, Hispanic origin and nativity, region, and population density to parameters from the March 2010 Census Bureau’s Current Population Survey. The sample also is weighted to match current patterns of telephone status and relative usage of landline and cell phones (for those with both), based on extrapolations from the 2010 National Health Interview Survey. The weighting procedure also accounts for the fact that respondents with both landline and cell phones have a greater probability of being included in the combined sample and adjusts for household size within the landline sample. Sampling errors and statistical tests of significance take into account the effect of weighting. The following table shows the sample sizes and the error attributable to sampling that would be expected at the 95% level of confidence for different groups in the survey:

Sample sizes and sampling errors for other subgroups are available upon request.

In addition to sampling error, one should bear in mind that question wording and practical difficulties in conducting surveys can introduce error or bias into the findings of opinion polls.

The survey by the Pew Research Center’s Social and Demographic Trends project was conducted September 1-15, 2011, among a national sample of 2,003 adults 18 years of age or older living in the continental United States (1,203 respondents were interviewed on a landline telephone, and 800 were interviewed on a cell phone, including 349 who had no landline telephone). The survey was conducted by interviewers at Princeton Data Source under the direction of Princeton Survey Research Associates International. A combination of landline and cell phone random digit dial samples were used; both samples were provided by Survey Sampling International. Interviews were conducted in English and Spanish. Respondents in the landline sample were selected by randomly asking for the youngest adult male or female who is now at home. Interviews in the cell sample were conducted with the person who answered the phone, if that person was an adult 18 years of age or older.

The combined landline and cell phone sample are weighted using an iterative technique that matches gender, age, education, race, Hispanic origin, region, and population density to parameters from the March 2010 Census Bureau’s Current Population Survey. The sample also is weighted to match current patterns of telephone status and relative usage of landline and cell phones (for those with both), based on extrapolations from the 2010 National Health Interview Survey. The weighting procedure also accounts for the fact that respondents with both landline and cell phones have a greater probability of being included in the combined sample and adjusts for household size within the landline sample. Sampling errors and statistical tests of significance take into account the effect of weighting. The following table shows the sample sizes and the error attributable to sampling that would be expected at the 95% level of confidence for different groups in the survey:

Sample sizes and sampling errors for other subgroups are available upon request.

Additional analysis in this report is based on telephone interviews conducted September 22-25, 2011, among a national sample of 1,000 adults 18 years of age or older living in the continental United States (600 respondents were interviewed on a landline telephone, and 400 were interviewed on a cell phone, including 186 who had no landline telephone). The survey was conducted by interviewers at Princeton Data Source under the direction of Princeton Survey Research Associates International. A combination of landline and cell phone random digit dial samples were used; both samples were provided by Survey Sampling International. Interviews were conducted in English. Respondents in the landline sample were selected by randomly asking for the youngest adult male or female who is now at home. Interviews in the cell sample were conducted with the person who answered the phone, if that person was an adult 18 years of age or older.

The combined landline and cell phone sample are weighted using an iterative technique that matches gender, age, education, race, Hispanic origin, region, and population density to parameters from the March 2010 Census Bureau’s Current Population Survey. The sample is also weighted to match current patterns of telephone status based on extrapolations from the 2010 National Health Interview Survey. The weighting procedure also accounts for the fact that respondents with both landline and cell phones have a greater probability of being included in the combined sample and adjusts for household size within the landline sample. Sampling errors and statistical tests of significance take into account the effect of weighting. The following table shows the sample sizes and the error attributable to sampling that would be expected at the 95% level of confidence for different groups in the survey:

Sample sizes and sampling errors for other subgroups are available upon request.