Pew Research Center

FOR RELEASE AUGUST 25, 2011

Obama Leadership Image Takes a Hit, GOP Ratings Decline

Continued Dissatisfaction with Republican Field

FOR MEDIA OR OTHER INQUIRIES:

Communications Department
202.419.4372
www.pewresearch.org

RECOMMENDED CITATION

Pew Research Center, August 2011, "Obama Leadership Image Takes a Hit, GOP Ratings Decline"

About Pew Research Center

Pew Research Center is a nonpartisan, nonadvocacy fact tank that informs the public about the issues, attitudes and trends shaping the world. It does not take policy positions. The Center conducts public opinion polling, demographic research, computational social science research and other data-driven research. It studies politics and policy; news habits and media; the internet and technology; religion; race and ethnicity; international affairs; social, demographic and economic trends; science; research methodology and data science; and immigration and migration. Pew Research Center is a subsidiary of The Pew Charitable Trusts, its primary funder.

© Pew Research Center 2026

Table of contents

  • About Pew Research Center
  • Obama Leadership Image Takes a Hit, GOP Ratings Decline
  • Section 1: Views of Obama
  • Section 2: The 2012 Election
  • Section 3: Congress, the Political Parties and the Tea Party
  • Section 4: Anger and Distrust in Government
  • Section 5: Economic Ratings and Priorities
  • About the Surveys

Obama Leadership Image Takes a Hit, GOP Ratings Decline

Continued Dissatisfaction with Republican Field

Overview

The public is profoundly discontented with conditions in the country, its government, political leadership and several of its major institutions. Fully 79% are dissatisfied with the way things are going in the country. Even more (86%) say they are frustrated or angry with the federal government. Favorable ratings for both political parties are in negative territory and have declined since the beginning of the year.

Just 22% approve of the job performance of Republican congressional leaders, down from 36% in February. Ratings for Democratic leaders are only somewhat better (29% approve). More generally, the Republican Party’s favorable rating has declined from 43% in early February to 34% currently. At 43%, the Democratic Party is viewed more favorably than the GOP, but it too was rated a bit better earlier in the year (47% in February).

The latest national survey by the Pew Research Center for the People & the Press, conducted Aug. 17-21 among 1,509 adults, finds that Barack Obama’s job approval rating has declined markedly since the killing of Osama bin Laden in early May. For the first time in his presidency, significantly more disapprove than approve of the way Obama is handling his job as president (49% vs. 43%), and the margin of strong disapproval over strong approval has widened; currently, 38% strongly disapprove of Obama’s job performance while 26% strongly approve.

There also has been a substantial erosion of Obama’s leadership image. Since May, the percentage saying Obama is able to get things done has fallen from 55% to 44%, while the percentage viewing Obama as a strong leader has declined from 58% to 49%. Fewer Democrats and independents now view Obama as a strong leader than did so in May (down 10 points, eight points, respectively).

Democrats also want Obama to get tougher in his dealings with congressional Republicans. Currently, 57% of Democrats say Obama should challenge the Republicans more often, while 32% say he is handling relations with the GOP about right. In early April, just 39% of Democrats said Obama should do more to challenge Republicans and 47% said

he was handling things about right.

The better news for Obama is that he continues to be seen by majorities as someone who stands up for what he believes in (71%), as caring (63%) and trustworthy (59%). Moreover, his 43% job approval rating, while much lower than his rating just a few months ago, is relatively strong given the widespread dissatisfaction with national conditions, increasingly negative views of the economy, and broad distrust of government. And Obama’s approval rating continues to be much higher than those for congressional leaders of both parties.

Obama continues to run even in a 2012 matchup against a generic Republican presidential candidate. Currently, 43% of registered voters say they would like to see Obama reelected while 40% would prefer a Republican. That is little changed from a month ago (41% Obama, 40% Republican), but in May Obama held an 11-point lead in the generic ballot.

Voters remain unimpressed by the GOP field. As was the case in late May, prior to the Ames straw poll and Rick Perry’s entry into the presidential race, only about a quarter of voters (26%) say they have an excellent or good impression of the possible GOP candidates. Most (64%) say as a group the candidates are only fair or poor.

Republican and Republican-leaning voters continue to express mixed views of the GOP candidates (49% excellent or good, 44% only fair or poor). In May, 44% of Republican voters said the party’s presidential field was excellent or good, while 43% said it was only fair or poor.

Of the party’s best-known possible candidates, only Mitt Romney and Rick Perry have broad potential appeal: 54% of registered voters who have heard of Romney say there is a good chance (16%) or some chance (38%) they would vote for the former Massachusetts governor. Nearly half (47%) say there is at least some chance they would vote for Perry, though an identical percentage (47%) says there is no chance they will support Perry.

Fewer say there is at least some chance they would vote for Ron Paul (42%) or Michelle Bachmann (39%). Substantial majorities of those who have heard of Sarah Palin and Newt Gingrich have ruled out voting for them; 67% say there is no chance they would vote for Palin while 66% say there is no chance they would vote for Gingrich.

Among Republican and Republican-leaning voters who have heard of each of the candidates, Perry generates a little more enthusiasm than Romney: 37% say there is a good chance they would vote for Perry while 40% say there is some chance. By comparison, 28% of GOP voters say there is a good chance they would vote for Romney and 47% say some chance.

As many Republican and Republican-leaning voters say there is a good chance they would vote for Bachmann as for Romney (28% each). But more Republican voters say there is no chance they would vote for Bachmann (31% vs. 21% for Romney). Higher percentages of Republican voters say there is no chance they would vote for Palin (41%) and Gingrich (48%).

The survey also finds that amid widespread dissatisfaction with national conditions, the public is taking a more negative view of national institutions. The percentage saying they can trust the government always or most of the time has declined by 10 points since early March (from 29% to 19%) and is at one of its lowest points in half a century. The percentage saying they are angry at the federal government has nearly doubled since March (from 14% to 26%) and is at a historic high.

And favorable views of both business corporations and labor unions have fallen. Just 38% now have a favorable opinion of business corporations, the lowest favorable rating for business in more than a quarter century of Pew Research Center surveys. About the same percentage (41%) have a favorable opinion of labor unions, which equals a low in Pew Research Center surveys.

Other Major Findings:

Tea Party Image Slips. As the Tea Party movement has gotten better known, its image has become much more negative. In February 2010, 33% had a favorable opinion of the Tea Party, 25% an unfavorable one; today 36% have a favorable view, while 43% have an unfavorable opinion.

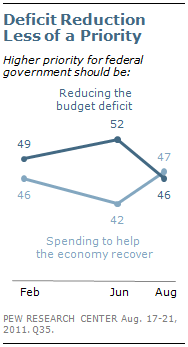
Changing Economic Priorities. As many Americans (47%) place a higher priority on spending to help the economy recover as on reducing the budget deficit (46%). In June, 52% said reducing the deficit was the higher priority while 42% said spending to help the economy recover was the higher priority.

Disgruntled Democrats. Currently, 61% of Democrats and Democratic leaners say their party is doing only a fair or poor job of standing up for its traditional positions, such as protecting the interests of minorities and helping the poor. Last fall, shortly after the midterm election, 50% said the party was doing only a fair or poor job in supporting the party’s traditional positions.

Perry and the Tea Party. Nearly half (49%) of Republican and Republican-leaning voters who agree with the Tea Party (and have heard of Perry) say there is a good chance they would support him. Far fewer Tea Party Republicans (29%) say there is a good chance they would vote for Romney. And nearly twice as many GOP Tea Party supporters think Perry has a better chance to defeat Obama than say that about Romney (34% vs. 18%).

Section 1: Views of Obama

Barack Obama’s public image has eroded in recent months. His overall job approval rating is now, on balance, significantly negative for the first time in his presidency, and his rating on the economy has continued to decline. Nevertheless, even as public impressions of Obama on traits related to leadership have declined significantly, Americans continue to rate the president positively on many other personal traits. And increasing numbers both blame Republican leadership for the lack of cooperation in Washington and say they would like to see Obama challenge Republican leadership.

Obama’s Ratings Slide

About half (49%) of Americans now disapprove of the job Obama is doing, while just 43% approve. This is little changed from last month (48% disapprove, 44% approve), but reflects a substantial drop from the period following the killing of Osama bin Laden in May.

Republican assessments of Obama—already negative—have continued to sour. Today, just 9% say they approve of the job Obama is doing, down from 15% last month.  Obama’s ratings among independents and Democrats are little changed since last month. Still, just 39% of independents approve of his handling of the job, while 52% disapprove. About three-quarters of Democrats (77%) continue to approve of Obama.

More Strong Disapproval of Obama

As disapproval of Obama’s job performance has grown, an intensity gap also has emerged. Americans are now significantly more likely to say they very strongly disapprove of Obama’s performance than to say they very strongly approve (38% vs. 26%). From early 2010 through March of this year, about as many strongly approved of the president’s performance as strongly disapproved.

Nearly three-quarters of Republicans (73%) strongly disapprove of Obama, and this rises to 81% among conservative Republicans (compared with 54% among moderate and liberal Republicans). Far fewer Democrats (53%) strongly approve of the way Obama is handling his job as president; 60% of liberal Democrats strongly approve, as do 48% of conservative and moderate Democrats. By about two-to-one (39% to 20%), more independents strongly disapprove than strongly approve of Obama’s performance).

Most African Americans (64%) continue to strongly approve of Obama’s performance. By contrast, just 19% of whites and 26% of Hispanics strongly approve of Obama’s job performance. People younger than 30 are the only age group in which about as many strongly approve of Obama’s job performance as strongly disapprove (30% and 21%, respectively). Among older age groups far more strongly disapprove than strongly approve.

Most Continue to Approve of Obama on Terrorism

Public evaluations of Obama’s handling of the economy and the budget deficit have also grown more negative in recent months. Today, six-in-ten (60%) disapprove of his performance on each of these issues. Americans’ ratings of Obama’s handling of the threat of terrorism continue remain more positive: 56% currently approve, about the same percentage as throughout much of his presidency. Obama received a significant bump on this measure, which has since receded, the day following the announcement of the killing of Osama bin Laden.

About three-in-ten independents approve of Obama’s handling of the economy (30%) and the budget deficit (28%). Roughly half of independents (53%) approve of Obama’s job dealing with terrorist threats.

Very few Republicans (7% each) approve of Obama’s handling of the economy or the budget deficit; more Republicans (33%) have positive views of Obama’s handling of terrorism. Among Democrats as well, Obama gets much better ratings on terrorism (82%) than for his handling of the economy (64%) or the budget deficit (58%).

Obama’s Leadership Image Slips

Americans continue to have positive personal impressions of Barack Obama along most dimensions. Majorities say he stands up for what he believes in (71%), cares about people like them (63%), and most view him as a good communicator (75%), well-informed (63%) and trustworthy (59%). Public assessments of these traits are relatively unchanged in recent months.

But evaluations of Obama’s leadership have dropped off in recent months. Today, the public is divided over whether Obama is a strong leader (49% strong leader, 47% not a strong leader), and more now say he is not able to get things done than say he is (50% not able, 44% able).

Among independents, the balance of opinion on these dimensions has shifted. Today, more say Obama is not a strong leader than say he is (51% vs. 44%); in May, that balance was reversed (52% strong leader, 41% not strong). And a majority of independents (55%) now say Obama is not able to get things done; in May, just 43% said this.

Views of Obama’s ability to get things done have also declined among Republicans (20% now say he can get things done, compared with 31% in May) and Democrats (67% today, 79% in May). And although three-quarters of Democrats (75%) continue to say Obama is a strong leader, this has dropped 10 points since May. Among Democrats, liberal Democrats continue to rate Obama more highly on these characteristics than do conservative and moderate Democrats.

Wide Partisan Gaps in Views of Obama’s Personal Traits

Across the board, Democrats express much more positive views of Obama’s traits and personal qualities than do Republicans. The partisan gap is particularly pronounced in opinions about whether Obama is trustworthy.

Nearly nine-in-ten Democrats (88%) and a majority of independents (57%) view Obama as trustworthy. That compares with just 29% of Republicans; 68% say Obama is not trustworthy. The partisan gaps in views of Obama’s personal traits are nearly as wide in opinions about whether Obama is a strong leader (51 points) cares about people like me (50 points) and able to get things done (47 points).

Nonetheless, Republicans have positive views of some of Obama’s traits. Majorities see Obama as a good communicator (60%), as someone who stands up for what he believes in (58%) and as warm and friendly (52%).

Plurality Wants Obama to Challenge GOP

A 37% plurality now contends that Obama should challenge the Republicans in Congress more often; 25% say Obama should go along with GOP leaders more frequently, while about the same percentage (26%) say he is handling the situation about right. In April, fewer (27%) said Obama should challenge GOP congressional leaders more often.

Democrats, in particular, are now more likely to say Obama should challenge Republicans in Congress more often. Today, a majority of

Democrats (57%) say Obama should challenge the GOP more frequently; in April, just 39% said this.

And there is little difference among Democrats on this question. Liberal Democrats and their conservative and moderate counterparts are about equally likely to want to see Obama stand up more to Republicans (60%, 55% respectively).

Little Partisan Cooperation Seen

Fully 75% of the public says that Obama and Republican congressional leaders are not working together to address the important issues facing the country. Just 21% say the two sides are cooperating. The view that Obama and Republican leaders are not working together has grown in recent months. In February, 65% said they were not working together, 27% said they were.

The public continues to place greater blame for the lack of cooperation on Republican leaders (37%) than on Barack Obama (21%), though about one-in-ten (12%) volunteer that both are responsible.

Both Republicans and Democrats are more likely to place the blame on the opposing party’s leadership than on their own. About six-in-ten Democrats (59%) blame GOP leadership, while about half of Republicans (47%) blame Obama.

However, Republicans are more likely than Democrats to assign at least some of the blame to their own party for the lack of cooperation. Three-in-ten Republicans say Republican congressional leaders are either mostly (12%) or partially (18%) to blame; by contrast, fewer than one-in-ten Democrats say Barack Obama is either mainly (5%) or partially (3%) to blame.

Section 2: The 2012 Election

Barack Obama continues to run even with a generic Republican candidate in the 2012 general election. Among registered voters, 43% say they would like to see Obama reelected while 40% say they would prefer that a Republican candidate win the election. Voter preferences are little changed from July, but Obama has lost the advantage he held over a Republican candidate in the spring of this year.

Independent voters are divided over their preference in the 2012 general election. As many say they would like to see Obama reelected (38%) as say they prefer a Republican candidate to win (36%). In May, Obama enjoyed a seven-point edge among independents (42%-35%). In July, just 31% of independents backed Obama while 39% preferred to see a Republican win.

About eight-in-ten Democrats (82%) say they want Obama to be reelected; liberal Democrats (91%) are more likely to take this view than are conservative and moderate Democrats (76%). By comparison, 87% of Republicans say they prefer a GOP candidate to win, including 91% of conservative Republicans.

Obama continues to perform well among young people, blacks and low-income households. Women also support Obama over a generic Republican by a 50%-34% margin.

Among whites, Obama trails a Republican candidate 47%-36% and he performs particularly poorly among white men (53%-29% GOP candidate) and whites without a college degree (50%-29% GOP candidate).

Voters View the GOP Field

In evaluating possible Republican candidates, most voters (54%) say there is at least some chance they would vote for Mitt Romney, among those who have heard of the former Massachusetts governor. Recent entry Rick Perry also ranks comparatively well among the GOP field. While Perry is not as well known as Romney, 47% of those who have heard of Perry say there is at least some chance they would vote for him.

Other highly visible Republicans garner less potential support from voters. In particular, roughly two-thirds of those familiar with Sarah Palin and Newt Gingrich say there is no chance they would vote them. Somewhat smaller majorities say there is no chance they would vote for Michele Bachmann (56%) or Ron Paul (53%). Herman Cain, Rick Santorum and Jon Huntsman are still unfamiliar to a majority of voters, and receive limited support even from those who have heard of them.

Michele Bachmann has become much more visible in recent months. However, she garners no greater potential support from voters who have heard of her now than three months ago. In May, slightly more than half of voters (54%) had heard of Michele Bachmann. In the current survey, that number has risen to 84%. Yet of those who have heard of her, the share who would consider voting for her has remained unchanged: 40% in May, compared with 39% in the current survey.

Republican Views of GOP Candidates

Republican and Republican-leaning voters offer a positive initial response to Rick Perry’s candidacy. Eight-in-ten (80%) have heard of Perry and about three-quarters (77%) of those who have heard of him say there is a least some chance they would vote for him. Mitt Romney is somewhat better known than Perry (94% have heard of him) and receives similar potential

support with 75% of those who have heard of him saying there is at least some chance they would vote for him.

While overall support for Romney and Perry is similar, slightly more say there is a good chance they would vote for Perry (37%) than say the same for Romney (28%).

Herman Cain is known by 51% of Republican voters, placing him among the least visible GOP candidates. However, he receives strong support from those who have heard of him – 68% say there is at least some chance they would vote for him, including 36% who say there is a good chance.

Nearly all Republican and Republican-leaning voters have heard of Sarah Palin (99%) and more than eight-in-ten recognize Michele Bachmann (89%) and Ron Paul (85%). However, these highly visible potential candidates receive somewhat less support than Perry and Romney. About two-thirds (65%) of GOP voters who have heard of Bachmann say there is at least some chance they would vote for her, while 31% say there is no chance they would back her. Smaller majorities (58% each) of Republican voters say there is some chance they would vote for Palin and Paul.

Newt Gingrich is known by 93% of Republican and Republican-leaning voters. About as many say there is no chance they would vote for Gingrich (48%) as say there is at least some chance (50%). Jon Huntsman is the least visible major candidate (just 44% of Republican and Republican-leaning voters have heard of him), and also draws only modest support from those familiar with him.

Tea Party Republicans’ Views of GOP Field

While Rick Perry and Mitt Romney have similar levels of support among GOP voters overall, Perry receives particularly strong support among those who agree with the Tea Party.

More than eight-in-ten Tea Party Republicans who have heard of Rick Perry say there is at least some chance they would vote for him (86%), including 49% who say there is a good chance. Mitt Romney also receives strong potential support (78% of Tea Party Republicans say there is some chance they would vote for him) but far fewer Tea Party Republicans say there is a good chance they would vote for Romney (29%). Since May, the percentage of Tea Party Republicans who say there is a good chance they would vote for Romney has slipped nine points.

Michele Bachmann is one of several GOP candidates who fare better among Tea Party Republicans than among Republicans who disagree with or have no opinion of the Tea Party. About eight-in-ten Tea Party Republicans (79%) say there is at least some chance they would vote for her, 40% say there is a good chance. By comparison, 49% of non-Tea Party Republicans say there is at least some chance they would vote for her, just 15% say there is a good chance.

About seven-in-ten Tea Party Republicans (69%) say there is at least some chance they would vote for Sarah Palin, including 31% who say there is a good chance.

Herman Cain remains less well-known among Tea Party Republicans than most other candidates (64% have heard of him), but those who can rate him offer strong potential support. About three-quarters say there is at least some chance they would vote for him (77%), including 47% who say good chance.

Bachmann and Perry Most Visible Candidates

Following his entry into the Republican presidential contest, Perry joined Bachmann as the most visible candidates in the race. When asked what possible candidate they’ve heard the most about in the news recently, 23% say Bachmann and 22% name Perry. Far fewer (7%) name Romney. None of the other candidates is mentioned by more than 4% of the public.

One month ago – before Perry joined the race –Bachmann was the most visible GOP candidate. In a July 21-24 poll, about a quarter (23%) mentioned Bachmann, 13% named Romney and 3% offered Perry.

Currently, Perry and Bachmann also are about equally visible among Republicans and Republican-leaning independents. Three-in-ten (30%) say Perry is the candidate they have been hearing most about, while 23% who say that candidate is Bachmann. Another 12% name Romney.

But Perry is far and away the most visible candidate among Republicans and GOP-leaning independents who say they are following campaign news very closely. More than half of this group (53%) say they have been hearing the most about Perry; 21% say they have been hearing most about Bachmann and 12% say Romney. Among those following less closely, 25% say they have been hearing the most about Bachmann, 18% say Perry and 13% say Romney.

Following Bachmann’s victory in the Iowa straw poll and the entrance of Perry into the race on August 13, interest in the campaign has grown.  In the most recent News Interest Index survey, about one-in-four (27%) report following news about the campaign very closely. That is a high point for the year.

Who Can Beat Obama?

When asked which GOP candidate has the best chance of defeating Obama, more voters name Mitt Romney than any other candidate. But Rick Perry is seen as having the best chance to

win by Republican voters who agree with the Tea Party and by Republicans who have given a lot of thought to 2012.

Overall, 24% of voters say Mitt Romney is the potential GOP candidate with the best chance of defeating Barack Obama. Rick Perry (18%) is the second most mentioned candidate. No other GOP candidate is mentioned by more than 8% of voters.

Perry is seen as having the best chance to defeat Obama by Republican voters who agree with the Tea Party movement and by Republican voters who have given a lot of thought to the candidates running in 2012. About a third (34%) of Tea Party Republicans say Perry has the best chance of winning next year’s election, significantly fewer (18%) say Romney. Similarly, 39% of Republican and Republican-leaning voters who have given a lot of thought to 2012 say Perry has the best chance of defeating Obama, 20% say Romney has the best chance.

Voter Engagement Edges Higher

About two-thirds of voters (64%) have given at least some thought to the candidates who may be running for president in 2012, including 32% who say they have given 2012 “a lot” of thought. Overall, thought given is up eight points from July and the change has come entirely from those who say they have given the 2012 candidates “a lot” of thought (24% in July, 32% in the current survey).

Republican and Republican-leaning voters continue to express somewhat more interest in the 2012 candidates than do their Democratic counterparts. Nearly seven-in-ten Republican voters (74%) have given at least some thought to 2012 compared with 60% of Democratic voters.

Tea Party Republicans are especially engaged: 84% of Republican voters who agree with the Tea Party movement have given at least some thought to the candidates running in 2012, compared with 62% of Republican voters who do not agree with the movement.

Ratings of Overall GOP Field

At this early stage of the nomination process, Republican voters continue to offer tepid ratings of the overall GOP field.  No more than half (49%) call the group of candidates running for the GOP nomination excellent (9%) or good (40%), nearly as many (44%) say they are only fair (38%) or poor (6%) candidates.

Tea Party Republican voters remain more favorable toward the GOP field than do non-Tea Party Republicans. Six-in-ten Tea Party Republicans (60%) call the GOP candidates excellent or good, compared with 37% of those who do not agree with the Tea Party. Republican voters who have given a lot of thought to the candidates running in 2012 also express favorable views of the field: 59% call the GOP candidates excellent or good, compared with 43% of Republicans who have given less thought to the election.

Section 3: Congress, the Political Parties and the Tea Party

Just a quarter of Americans (25%) say they have a favorable opinion of Congress, while 70% have an unfavorable view. This is among the lowest favorable ratings for Congress in more than two decades of Pew Research Center surveys.

The number expressing a favorable opinion of Congress has fallen by nine points since March (from 34% to 25%), with nearly equal declines among Republicans, Democrats and independents.

The current rating is identical to April 2010 (25%), a period of highly negative views toward both the federal government and politicians. (See “Distrust, Discontent, Anger and Partisan Rancor,” April 18, 2010.)

Democrats have much less favorable opinions of Congress than they did last year, when their party controlled both the House and Senate. In July 2010, for instance, nearly half of Democrats (48%) had a favorable opinion of Congress; that compares with just 28% in the current survey.

Republicans’ views of Congress became more positive after their party won the House in last fall’s midterm. In March of this year, 38% of Republicans felt favorably toward Congress, up from 22% in July 2010. But the percentage of Republicans with favorable opinions of Congress has fallen to 29% in the new survey.

Republican Leaders Lose Support from GOP Base

The public also continues to express highly negative views of the way congressional leaders from both parties are handling their jobs. Just 22% approve of the job performance of Republican congressional leaders; 69% disapprove. The approval rating for Democratic leaders is not much better (29% approve/63% disapprove).

Ratings for GOP leaders have fallen sharply among the Republican base – and the change has been particularly dramatic among Republicans and Republican leaning-independents who agree with the Tea Party. Among all Republicans, 46% now approve of the job performance of Republican leaders, down 23 points from January.

In January, Republicans and Republican leaners who agree with the Tea Party approved of GOP leaders’ job performance by an overwhelming 74% to 9% margin. Today, just 37% of Tea Party Republicans approve of the way Republican leaders are handling their jobs while 59% disapprove.

In the past month alone, following the debt ceiling agreement between President Obama and Republican leaders, the approval rating for GOP leaders has fallen by 14 points – from 51% to 37% – among Republicans and Republican leaners who agree with the Tea Party.

Views of the Parties

Both political parties also are viewed less favorably than they were earlier this year. But the decline in the GOP’s image has been more pronounced: Currently, 34% say they have a favorable opinion of the Republican Party while 59% view the GOP unfavorably. The percent expressing an unfavorable opinion of the Republican Party has risen by 11 points (from 48%) since February.

The current balance of opinion toward the Democratic Party also is unfavorable (43% favorable vs. 50% unfavorable). In February, about as many said they had a favorable (47%) as unfavorable (46%) opinion of the Democratic Party.

Still, the Democrats are more viewed more favorably than the GOP (43% to 34%). The Democrats’ advantage is far narrower than at the start of the Obama administration. In January

2009, 62% said they had a positive view of the Democratic Party compared with just 40% who said the same about the GOP.

Just 29% of independents now have a favorable opinion of the Republican Party, while 63% have an unfavorable view. The percentage of independents holding a favorable view of the GOP has declined by 12 points, from 41% in February.

While job approval ratings for GOP leaders have declined among Republicans (particularly those who agree with Tea Party), Republicans continue to express favorable overall views of their party. More than three-quarters of Republicans (77%) express favorable views of the GOP, which is largely unchanged from February (83%). However, Republicans and Republican leaners who agree with Tea Party have a less favorable view of the GOP than they did in February (68% today, 81% in February).

Democrats More Unhappy with Their Party

Democrats express fairly positive views of their party’s congressional leaders – 53% approve of their job performance. But Democrats are increasingly critical of the party’s advocacy of its traditional positions, such as protecting the interests of minorities, helping the poor and needy and representing working people.

Currently, just 38% of Democrats and Democratic leaders say the party is doing an excellent or good job of standing up for its traditional positions; 61% say the party has done only a fair or poor job. Last November, following the party’s dismal showing in the midterm elections, Democrats and Democratic leaners expressed more positive views of how well the party was standing up for its traditional positions (48% excellent or good/ 50% only fair or poor).

Republicans and Republican leaners currently give about the same negative evaluations as Democrats of their party’s advocacy of its traditional positions – in the GOP’s case, on such things as reducing the size of government, cutting taxes and promoting conservative social values. Only about four-in-ten Republicans (39%) give their party excellent or good marks, while 59% say it has done only a fair or poor job. That represents little change from November 2010 (40% excellent/good, 52% only fair/poor).

Generic Ballot for Congress

With still more than a year to go before the 2012 elections, voters are divided in their vote for Congress: 48% say if the election were held today they would vote for the Democrat in their district or lean Democratic, while 44% say they would vote for the Republican or lean Republican.

Notably, independent voters, whose support for Republicans was critical in their 2010 midterm victories, are now evenly divided: 44% favor the Republican candidate or lean Republican in their district and virtually the same percentage (42%) say they would vote for the Democrat.

Republicans and Democrats both overwhelmingly say they will vote for their party’s candidates. And while Tea Party Republicans have become more critical of GOP congressional leaders, 98% of Republican and Republican-leaning voters who agree with the Tea Party plan to vote for the Republican candidate in their district.

Voters 65 and older also are divided (45% Republican vs. 49% Democrat). In the Pew Research Center’s final pre-election survey, voters 65 and older supported the Republican candidate by a 12-point margin (50% to 38%). (See “GOP Likely to Recapture Control of House,” Oct. 31, 2010.)

Tea Party Loses Favor

The Tea Party has become much better known since the beginning of last year. And as the Tea Party has become more familiar, its image has grown less positive.

In the new survey, 36% say they have a favorable opinion of the Tea Party movement while 43% have an unfavorable view; 20% are unfamiliar with the Tea Party or express no opinion of the movement.

In February 2010, about the same percentage as today (33%) had a favorable opinion of the Tea Party but just a quarter (25%) had an unfavorable opinion; far more (42%) were unable to rate the Tea Party.

In February 2010, college graduates were evenly divided in opinions of the Tea Party (34% favorable, 32% unfavorable). Today, about the same percentage of college graduates has a favorable opinion (32%) while 58% say they have an unfavorable impression. Opinions about the Tea Party have shown less negative movement among those with less education. Among independents, unfavorable opinions of the Tea Party have increased by 17 points (from 24% to 41%) while favorable opinions are largely unchanged (36% today, 34% then).

Conservative Republicans are one of the only groups in which favorable views of the Tea Party have increased since early last year – 73% have a favorable opinion now, compared with 59% then. Unfavorable opinions among conservative Republicans have not increased over this period (14% now, 11% then).

The public continues to be divided over whether Republican leaders in Congress are paying too much, the right amount or too little attention to the Tea Party. Currently, 30% say GOP leaders are paying too much attention to the Tea Party while about the same percentage (31%) says they are paying too little attention to the Tea Party; 20% say they are giving the right amount of attention to the group. These views are little changed from early April (27% too much, 32% too little, 23% right amount).

Section 4: Anger and Distrust in Government

When asked to describe their feelings about the federal government, 86% say either that they are frustrated (60%) or angry (26%). Just 11% say they are basically content with the federal

government, by far the lowest percentage in a measure that dates to 1997. The share of Americans who describe themselves as angry with the federal government has nearly doubled since March, from 14% to 26%, while those who say they are basically content has fallen by half, from 22% to 11%.

Anger with government had waned substantially earlier this year – in March just 14% of Americans said they were angry with government, including just 16% of Republicans, 15% of independents, and 10% of Democrats. Today, 28% of Republicans, 30% of independents, and 19% of Democrats say they feel angry at the federal government.

In this regard, the current spike in public anger is notably broad-based. When anger rose to 20% in the fall of 2006, it was concentrated predominantly among liberal Democrats, with very few conservative Republicans expressing such strongly negative views. When anger rose to 23% in the fall of 2010, this pattern was reversed, with people on the right

expressing the most anger. But today, this emotion is more broadly distributed. There is certainly more anger among conservative Republicans (32% angry) than among liberal Democrats (12%). But compared with a year ago, the political gap has narrowed as anger has risen among Democrats and remained high among Republicans. Across these three periods independents have grown consistently angrier, from 21% in 2006 to 27% a year ago to 30% today.

Similarly, public trust in government, which had recovered slightly earlier this year, has once again returned to deeply negative territory. In the current survey, 80% say they trust the

government to do what is right only some of the time or never. Just 19% say the government can be trusted just about always or most of the time. When this question was first asked on the American National Election Study in 1958 nearly three-quarters (73%) of Americans said they always or mostly trusted the government to do what is right. Across all updates of this question over the past 53 years by the ANES, Gallup, ABC/Washington Post, CBS/New York Times, CNN and Pew Research Center, the all time low mark for trust in government is 17%, measured by CBS and the New York Times in October 2008 and by Gallup in June 1994.

To be sure, when the public is distressed, the government is not the only institution to be viewed negatively. With just 17% of Americans satisfied with the state of the nation, and 7% rating economic conditions favorably, the public’s

frustration has broad implications beyond the government and elected officials. For example, both labor unions and business corporations are receiving the lowest favorability ratings on record. The current poll finds just 38% saying they feel favorably toward business corporations, and just 41% saying the same about labor unions. Majorities felt favorably toward both of these groups as recently as 2007.

And over the course of the past few years, these declining ratings for business and labor have crossed party lines. While Republicans continue to hold a more positive view of business corporations than Democrats, favorability has fallen significantly among both groups. And independent ratings of business continue to track with the views of

Democrats.

Labor union ratings have also slipped across party lines, though the partisan divide here has grown substantially. Far fewer Republicans today offer a favorable assessment of labor unions than in 2007 (27%, down from 47%).  The slippage among Democrats has been far more modest (60%, down from 70%). Independent views fall in between, having slipped from 54% favorable in 2007 to 36% favorable today.

For more on views of labor and business see “Labor Unions Seen as Good for Workers, Not U.S. Competitiveness“.

Section 5: Economic Ratings and Priorities

Just 7% of Americans say the U.S. economy is in excellent (1%) or good (6%) shape, while 93% say economic conditions are only fair (37%) or poor (56%). Poor ratings of the economy have jumped 10 points from June.

At the same time, about two-thirds of Americans (68%) do not expect the economy to improve in the next year. Half (50%) expect economic conditions to be the same as now in a year’s time and 18% expect conditions to be worse. Just three-in-ten (29%) expect U.S. economic conditions to be better a year from now.

Combined, these figures show the gloomiest economic outlook since the start of the economic downturn. While the economy was clearly seen as in worse shape at times during late 2008 and early 2009, the public was far more optimistic about a turnaround at that time. Today, roughly two-in-three (65%) Americans say the economy is in only fair or poor shape and say it will get no better over the coming year. While little changed from June of this year, this is the highest since the Pew Research Center began asking this combination of questions in early 2004.

Public Less Focused on Deficit Reduction

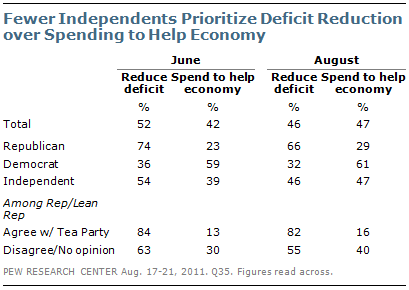
Americans are now evenly divided over whether the federal government should prioritize spending to help the economy recover or reducing the budget deficit: 47% say spending to help the economy should be the higher priority, while 46% say reducing the budget deficit. In June, 52% viewed reducing the deficit as the higher priority compared with 42% who prioritized spending to help the economy. In February, the public was, as now, more evenly divided.

Democrats remain far more likely to prioritize spending on the economy (61%), than deficit reduction (32%), and their views are largely unchanged from two months ago. But the balance of opinion among independents has shifted markedly. In June, independents prioritized deficit reduction by a 15-point margin (54% vs. 39%). Today, independents are split evenly over this tradeoff (46% deficit reduction, 47% spending to help the economy).

Republicans and Republican leaning independents who agree with the Tea Party movement remain overwhelmingly committed to deficit reduction (82% today, 84% in June). But Republicans and Republican leaners who do not agree with the Tea Party are more divided today than they were in June. Two months ago, they favored deficit reduction over stimulus spending by 33 points (63% to 30%). Today, that margin has narrowed to 15 points (55% to 40%).

Satisfaction Remains Low

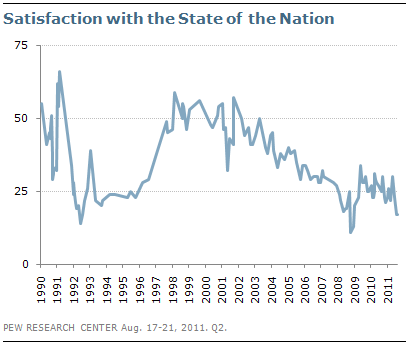
Just 17% of Americans are satisfied with the way things are going in the country today, while 79% are dissatisfied. These figures are unchanged from July before the debt-ceiling showdown and ensuing market fluctuations. Satisfaction is now at its lowest point since late 2008.

Older Americans are much less likely to say they are satisfied than are their younger counterparts. Just 5% of those 65 and older say they are satisfied with the state of the nation, compared with 31% of adults under age 30.

Democrats are somewhat more likely to say they are satisfied (21%) than are independents (15%) or Republicans (11%).

About the Surveys

Most of the analysis in this report is based on telephone interviews conducted August 17-21, 2011, among a national sample of 1,509 adults 18 years of age or older living in the continental United States (905 respondents were interviewed on a landline telephone, and 604 were interviewed on a cell phone, including 268 who had no landline telephone). The survey was conducted by interviewers at Princeton Data Source under the direction of Princeton Survey Research Associates International. A combination of landline and cell phone random digit dial samples were used; both samples were provided by Survey Sampling International. Interviews were conducted in English and Spanish. Respondents in the landline sample were selected by randomly asking for the youngest adult male or female who is now at home. Interviews in the cell sample were conducted with the person who answered the phone, if that person was an adult 18 years of age or older. For detailed information about our survey methodology, see https://alpha.pewresearch.org/pewresearch-org/politics/methodology/

The combined landline and cell phone sample are weighted using an iterative technique that matches gender, age, education, race, Hispanic origin, region, and population density to parameters from the March 2010 Census Bureau’s Current Population Survey. The sample also is weighted to match current patterns of telephone status and relative usage of landline and cell phones (for those with both), based on extrapolations from the 2010 National Health Interview Survey. The weighting procedure also accounts for the fact that respondents with both landline and cell phones have a greater probability of being included in the combined sample and adjusts for household size within the landline sample. Sampling errors and statistical tests of significance take into account the effect of weighting. The following table shows the sample sizes and the error attributable to sampling that would be expected at the 95% level of confidence for different groups in the survey:

Sample sizes and sampling errors for other subgroups are available upon request.

In addition to sampling error, one should bear in mind that question wording and practical difficulties in conducting surveys can introduce error or bias into the findings of opinion polls.

Some of the analysis in this report is based on telephone interviews conducted August 18-21, 2011, among a national sample of 1,007 adults 18 years of age or older living in the continental United States (603 respondents were interviewed on a landline telephone, and 404 were interviewed on a cell phone, including 195 who had no landline telephone). The survey was conducted by interviewers at Princeton Data Source under the direction of Princeton Survey Research Associates International. A combination of landline and cell phone random digit dial samples were used; both samples were provided by Survey Sampling International. Interviews were conducted in English. Respondents in the landline sample were selected by randomly asking for the youngest adult male or female who is now at home. Interviews in the cell sample were conducted with the person who answered the phone, if that person was an adult 18 years of age or older. For detailed information about our survey methodology, see:  https://alpha.pewresearch.org/pewresearch-org/politics/methodology/.

The combined landline and cell phone sample are weighted using an iterative technique that matches gender, age, education, race, Hispanic origin, region, and population density to parameters from the March 2010 Census Bureau’s Current Population Survey. The sample also is weighted to match current patterns of telephone status, based on extrapolations from the 2010 National Health Interview Survey. The weighting procedure also accounts for the fact that respondents with both landline and cell phones have a greater probability of being included in the combined sample and adjusts for household size within the landline sample. Sampling errors and statistical tests of significance take into account the effect of weighting. The following table shows the sample sizes and the error attributable to sampling that would be expected at the 95% level of confidence for different groups in the survey:

Sample sizes and sampling errors for other subgroups are available upon request.

In addition to sampling error, one should bear in mind that question wording and practical difficulties in conducting surveys can introduce error or bias into the findings of opinion polls.