Pew Research Center

FOR RELEASE JULY 7, 2011

Public Wants Changes in Entitlements, Not Changes in Benefits

GOP Divided Over Benefit Reductions

FOR MEDIA OR OTHER INQUIRIES:

Communications Department
202.419.4372
www.pewresearch.org

RECOMMENDED CITATION

Pew Research Center, July 2011, "Public Wants Changes in Entitlements, Not Changes in Benefits"

About Pew Research Center

Pew Research Center is a nonpartisan, nonadvocacy fact tank that informs the public about the issues, attitudes and trends shaping the world. It does not take policy positions. The Center conducts public opinion polling, demographic research, computational social science research and other data-driven research. It studies politics and policy; news habits and media; the internet and technology; religion; race and ethnicity; international affairs; social, demographic and economic trends; science; research methodology and data science; and immigration and migration. Pew Research Center is a subsidiary of The Pew Charitable Trusts, its primary funder.

© Pew Research Center 2026

Table of contents

  • About Pew Research Center
  • Public Wants Changes in Entitlements, Not Changes in Benefits
  • Section 1: Impressions of Entitlement Programs
  • Section 2: Entitlements vs. Deficit Reduction
  • Section 3: Views of Medicare
  • Section 4: Views of Medicaid
  • Section 5: Views of Social Security
  • About the Surveys

Public Wants Changes in Entitlements, Not Changes in Benefits

GOP Divided Over Benefit Reductions

Overview

As policymakers at the state and national level struggle with rising entitlement costs, overwhelming numbers of Americans agree that, over the years, Social Security, Medicare and Medicaid have been good for the country.

But these cherished programs receive negative marks for current performance, and their finances are widely viewed as troubled. Reflecting these concerns, most Americans say all three programs either need to be completely rebuilt or undergo major changes. However, smaller majorities express this view than did so five years ago.

The public’s desire for fundamental change does not mean it supports reductions in the benefits provided by Social Security, Medicare or Medicaid. Relatively few are willing to see benefit cuts as part of the solution, regardless of whether the problem being addressed is the federal budget deficit, state budget shortfalls or the financial viability of the entitlement programs.

The latest national survey by the Pew Research Center for the People & the Press, conducted June 15-19 among 1,502 adults, finds that Republicans face far more serious internal divisions over entitlement reforms than do Democrats. Lower income Republicans are consistently more likely to oppose reductions in benefits – from Medicare, Social Security or Medicaid – than are more affluent Republicans.

On the broad question of whether it is more important to reduce the budget deficit or to maintain current Medicare and Social Security benefits, the public decisively supports maintaining the status quo. Six-in-ten (60%) say it is more important to keep Social Security and Medicare benefits as they are; only about half as many (32%) say it is more important to take steps to reduce the budget deficit.

Half (50%) of Republicans say that maintaining benefits is more important than deficit reduction; about as many (42%) say it is more important to reduce the budget deficit. More independents prioritize maintaining benefits over reducing the deficit (by 53% to 38%). Democrats overwhelmingly view preserving current Social Security and Medicare benefits as more important (by 72% to 21%).

The public also opposes making Medicare recipients more responsible for their health care costs and allowing states to limit Medicaid eligibility. About six-in-ten (61%) say people on Medicare already pay enough of their own health care costs, while only 31% think recipients need to be responsible for more of the costs of their health care in order to make the system financially secure.

When it comes to Medicaid, just 37% want to allow states to cut back on who is eligible for Medicaid in order to deal with budget problems, while 58% say low-income people should not have their Medicaid benefits taken away. And most say it is more important to avoid future cuts in Social Security benefits than future increases in Social Security taxes (56% vs. 33%). On Social Security and Medicare, there are substantial differences of opinion by age. People age 65 and older are the only age group in which majorities say these programs work well; seniors also overwhelmingly say it is more important to maintain Social Security and Medicare benefits than to reduce the budget deficit. Those 50 to 64 also broadly favor keeping benefits as they are. Younger Americans support maintaining Social Security and Medicare benefits, but by smaller margins than older age groups.

Lower income people are more committed to maintaining benefits across all three major entitlement programs. This income gap is particularly wide when it comes to allowing states to cut back on Medicaid eligibility: 72% of those with family incomes of less than $30,000 oppose allowing states to limit Medicaid eligibility to deal with budget problems, compared with 53% of those with higher incomes.

GOP Base Divided over Entitlement Changes

The GOP’s internal divisions over entitlement changes are seen particularly in views of whether it is more important to maintain Social Security and Medicare benefits or to take steps to bring down the deficit.

Among Republicans and Republican-leaning independents, 63% of those with family incomes of $75,000 or more say it is more important to take steps to reduce the budget deficit; a nearly identical percentage (62%) of Republicans with incomes of $30,000 or less say it is more important to maintain Social Security and Medicare benefits as they are.

The income gap among Republicans and Republican leaners is about as large as the difference between GOP supporters of the Tea Party and non-supporters. Among Republicans and Republican leaners who agree with the Tea Party, 57% view deficit reduction as more important than preserving Social Security and Medicare benefits as they are. Among Republicans and leaners who do not agree with the Tea Party, just 36% say that reducing the deficit is more important than maintaining benefits.

Democrats face no such internal divisions, as both high- and low-income Democrats prioritize maintaining benefits over deficit reduction; there also are no ideological differences among Democrats over this issue. Notably, the balance of opinion among low-income Republicans is similar to how Democrats view the issue.

Section 1: Impressions of Entitlement Programs

Majorities say that Medicare, Medicaid and Social Security need to be completely rebuilt or undergo major changes. However, even larger numbers say that other systems and policies are in need of major changes.

Two-thirds (67%) say that immigration policy needs to be completely rebuilt (24%) or undergo major changes (43%). Nearly as many say the same about the nation’s educational system (66% completely rebuilt or major changes). And roughly six-in-ten think that the tax system (62%) and criminal justice system (60%) need at least major changes.

Among the entitlement programs, 54% say either that Medicare should be completely rebuilt (21%) or changed in a major way (33%). Comparable percentages say the same about the Medicaid system (54%) and Social Security system (52%).

For each of the entitlement programs, the view that major change or a complete overhaul is needed is more widely held among Republicans than Democrats. About six-in-ten Republicans say each entitlement needs major changes or more, compared to about half of Democrats and about 55% of independents. While there are similar partisan gaps regarding changes to immigration policy (Republicans +17) and the criminal justice system (Democrats +12), there are narrower divisions when it comes to opinions about other policy areas.

Support for Major Changes Declines

The public’s support for changing entitlement programs, while broad, has declined since February 2006. At that time, 70% of Americans said Medicare needed to be completely rebuilt or undergo major changes; today, 54% say the same. Support for major changes to Social Security has also declined, from 62% in 2006 to 52% today.

Support for major changes to both Medicare and Social Security is significantly higher among those under 50 than it is among older Americans. About six-in-ten (61%) of those younger than 50 say Social Security requires major changes or a complete overhaul, compared with 50% of those 50 to 64 and just 30% of those 65 and older.

Age and Entitlement Views

Older Americans give both Social Security and Medicare higher marks for performance, with sizable majorities saying each does an excellent or good job serving the people they cover. By contrast, most Americans under age 65 say the programs do only a fair job or a poor job serving their recipients.

Those living in households receiving Medicare or Social Security benefits also are more likely to rate the quality of the services provided positively. About half of those with participants in the household rate Social Security (49%) and Medicare (53%) as excellent or good at serving the people it covers compared with about a third of those without program participants in their households. A similar gap is evident in views of Medicaid’s performance between recipient households and non-recipient households; 46% of those in households receiving Medicaid say it does an excellent or good job of serving the people it covers compared with 34% of those in households that do not receive Medicaid.

Section 2: Entitlements vs. Deficit Reduction

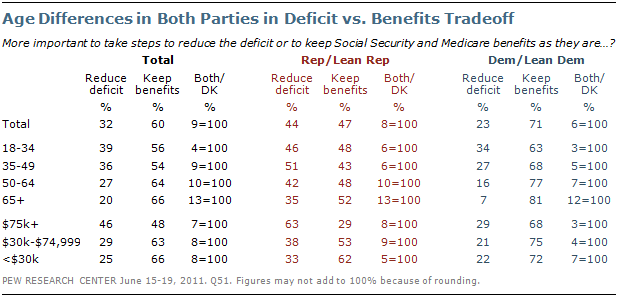
Despite rising public concern about the federal budget deficit, Americans favor keeping Social Security and Medicare benefits as they are rather than taking steps to reduce the budget deficit (by 60% vs. 32%).

Republicans are twice as likely as Democrats to say deficit reduction is the higher priority (42% vs. 21%), yet even among Republicans the prevailing view (50%) is that maintaining benefits is the bigger priority. The balance of opinion among independents is far closer to that of Republicans than Democrats, with 38% prioritizing the deficit and 53% prioritizing benefits.

The public has shifted slightly from where it stood 16 years ago, when deficit reduction was being debated between then President Bill Clinton and the new Republican majority in Congress. In February 1995, 70% prioritized keeping benefits as they were, while just 24% said deficit reduction was more important. And then as now, Republicans were twice as likely as Democrats to prioritize the deficit (33% vs. 16%).

Age Gaps in Both Parties

While majorities in all age groups say maintaining current benefits is more important than deficit reduction, this sentiment is strongest among people over 50. About two-thirds of those 50 and older (65%) say keeping benefits as they are is the priority; that compares with 55% of those younger than 50.

These generational differences produce some degree of disagreement within each party’s base. Notably, Republicans and Republican leaners who are 65 and older prioritize benefits over deficit reduction (52% vs. 35%), while those under age 50 are divided on the issue. The generation gap is even wider among Democrats and Democratic-leaning independents. Fully 81% of Democrats and Democratic-leaners who are 65 and older say keeping benefits as they are should take precedence, as do 77% of those age 50-64.  While roughly two-thirds (65%) of Democrats under 50 share this view, a substantial minority – 31% – says deficit reduction should take precedence.

Although the generational gaps are large, partisanship plays a much larger role in these opinions. Even the youngest Democrats are more supportive of maintaining benefits than the oldest Republicans (63% vs. 52%).

The GOP’s Income Divide

By more than two-to-one, people with household incomes under $30,000, as well as those earning between $30,000 and $75,000, say keeping benefits as they are is more important than deficit reduction. Only among those with annual incomes over $75,000 is there a division of opinion, with as many prioritizing deficit reduction (46%) as benefits (48%).

Among Republicans and Republican-leaners, this income divide is even more pronounced: Higher-income Republicans ($75,000+) overwhelmingly prioritize the deficit over benefits (by 63% vs. 29%) while low-income Republicans (less than $30,000) say it is more important to preserve benefits (by 62% vs. 33%).

By contrast, there are no differences in the views of Democrats across income categories. Sizable majorities of Democrats and Democratic leaners in every income group say that keeping benefits as they are is more important than deficit reduction.

Views of Specific Entitlement Changes

The public’s unwillingness to see Social Security and Medicare benefits cut in the interest of deficit reduction is evident when specific benefit reforms are tested.

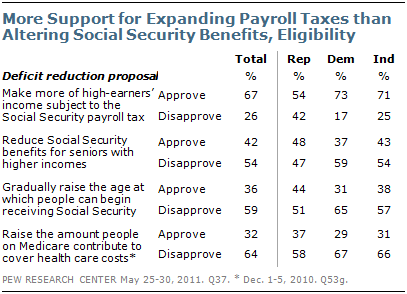
In May, the Pew Research Center asked about 12 deficit reduction proposals; only one proposal related to entitlement programs received majority support, and it is a proposal linked to Social Security taxes, not benefits (For more, see “More Blame Wars than Domestic Spending or Tax Cuts for Nation’s Debt,” June 7, 2011.) By a 67% to 26% margin, most Americans approve of making more of high-earners’ income subject to the Social Security payroll tax. This includes seven-in-ten Democrats and independents, and even a slim majority of Republicans.

But the same poll found continued disapproval of raising the Social Security retirement age, or means-testing Social Security benefits. And a similar test in December 2010 found deep opposition to raising the amount Medicare recipients pay to cover their health care costs.

Section 3: Views of Medicare

Nearly nine-in-ten (88%) give Medicare positive marks for its contributions to the country over the years, and these positive assessments cross party lines. There also is general agreement over the job Medicare does serving the people it covers (41% of Americans say it does an excellent or good job), and its financial shape (just 18% say it is in excellent or good financial condition).

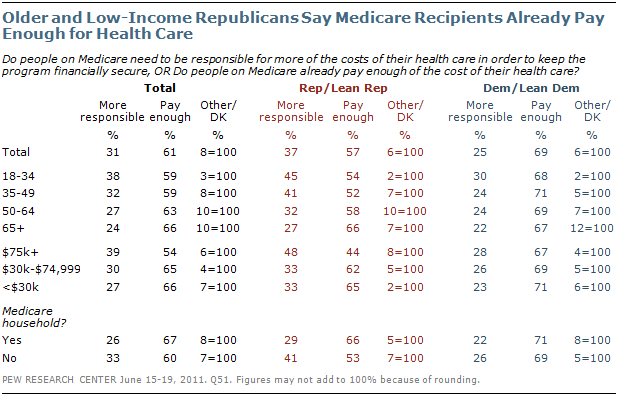
A partisan gap does emerge, however, when presented with the tradeoff of whether Medicare recipients should be more responsible for the costs of their health care in order to keep the program financially secure or whether Medicare recipients already pay enough of their costs.

Majorities of Republicans (53%), Democrats (72%) and independents (58%) say that people on Medicare already pay enough of the cost of their health care. But 41% of Republicans say recipients should bear more of the costs, compared with 32% of independents and just 23% of Democrats.

Within the general public, opinions on this issue show modest variations by age and income. Democratic opinions, in particular, are relatively uniform. However, younger and more affluent Republicans are more likely than other Republicans to say Medicare participants should shoulder additional responsibility for the cost of their health care:  45% of Republicans and Republican leaners under 35 say people need to be more responsible, while just 27% of those 65 and older share this view. Nearly half (48%) of Republicans and Republican leaners with family incomes of $75,000 or more advocate more individual responsibility for the costs of Medicare, compared with just 33% among those with annual incomes below $30,000.

Public Doesn’t See Medicare Overused

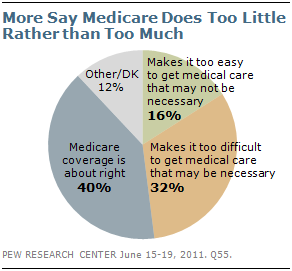
A broader debate among Medicare analysts and policymakers is whether the system encourages the overutilization of medical treatments, driving up the overall cost of the program. While the extent of the problem may be debated in policy and economic circles, it has little resonance with the general public. Just 16% of Americans say that Medicare makes it too easy to get medical care and treatments that may not be necessary. Twice as many (32%) are of the view that Medicare in fact makes it too difficult to get medical care and treatments that may be necessary for patients.

The plurality view, held by 40%, is that current Medicare coverage is about right in this regard. This is the assessment of 61% of people age 65 and older, very few of whom think Medicare goes too far (12%) or not far enough (12%).

Section 4: Views of Medicaid

In contrast to opinions about Medicare and Social Security, there are clear partisan differences in assessments of Medicaid. About three-quarters of the public (77%) say the program has been good for the country, but that percentage rises to 91% of Democrats and falls to 68% of Republicans; 75% of independents say it has been good for the country.

Ratings of how well Medicaid serves its constituents are considerably lower across the board (36% say it does an excellent or good job), with Democrats giving slightly better evaluations than Republicans and independents.

And while there is little partisan variation in the positive ratings for the program’s financial condition (about 15% of all groups say it is in excellent or good shape), both Republicans and independents are significantly more likely than Democrats to say the program is in poor fiscal shape (45% of Republicans and 42% of independents, compared with 26% of Democrats).

A deep partisan divide is evident in the current debate over state funding for the Medicaid program. Just 24% of Democrats would allow states to cut back on Medicaid eligibility in order to deal with their budget problems, while 73% say low income people should not lose their benefits. By contrast, a majority of Republicans (56%) say states should be able to cut their Medicaid rolls. More independents say lower income people should not lose their benefits than say states should be able to cut back on eligibility (58% vs. 38%).

Nearly three-quarters (72%) of lower-income Americans oppose allowing states to reduce Medicaid eligibility. Smaller majorities of middle-income (54%) and higher-income (51%) people take this position.

More than six-in-ten (64%) Republicans and Republican-leaners with family incomes of $75,000 or more say states should be able to cut their Medicaid eligibility rolls to deal with state budget problems; 56% of Republicans and leaners with incomes between $30,000 and $75,000 say the same. But among Republicans and leaners with annual incomes under $30,000, opinion is reversed: 61% say low-income people should not lose their Medicaid benefits and just 35% say states should be able to cut back on eligibility. By contrast, two-thirds or more of all Democratic and Democratic-leaning income groups say low-income people should not lose their benefits.

Section 5: Views of Social Security

As with Medicare, an overwhelming majority (87%) says that Social Security has been good for the country. At the same time, however, just 39% say it does an excellent or good job serving the people it covers and only 18% say the program is in excellent or good financial condition. There is little variation in these evaluations by party, but Republicans and Democrats differ in their views about the program’s future.

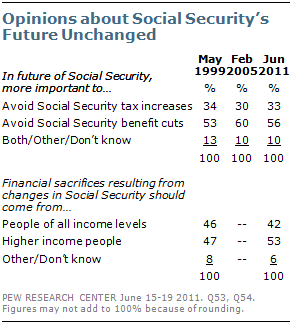
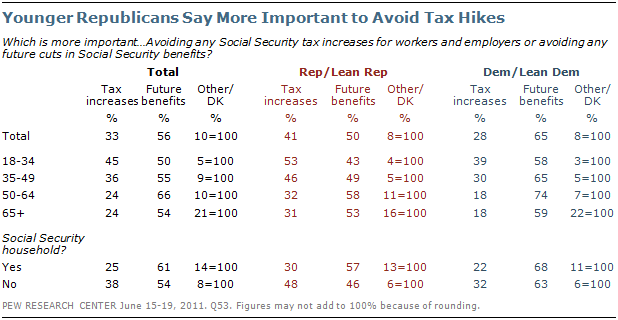
Most Americans say avoiding future cuts to the program is more important than avoiding increases in Social Security taxes for workers and employers (by 56% to 33%). Two-thirds of Democrats (67%) say avoiding benefit cuts is more important; that compares with 55% of independents and 49% of Republicans.

Opinions on this issue are little changed since either 2005 or 1999. Democratic and Republican opinions are nearly identical to opinions in 2005. However, independents are now less likely to prioritize avoiding benefit cuts (55% today, compared with 63% in 2005).

There has been a small shift in opinion about whether the costs associated with changes in Social Security should be borne by all income groups or by those with higher incomes since 1999. Today, a slim majority (53%) says that higher income people should make these financial sacrifices. Twelve years ago, public opinion was evenly split (47% higher income people, 46% people of all income levels). This is primarily driven by changing attitudes among Democrats; 70% of Democrats now say the costs should fall to higher-income people, up from 51% in 1999.

About the Surveys

Most of the analysis in this report is based on telephone interviews conducted June 15-19, 2011 among a national sample of 1,502 adults 18 years of age or older living in the continental United States (1,001 respondents were interviewed on a landline telephone, and 501 were interviewed on a cell phone, including 200 who had no landline telephone). The survey was conducted by interviewers at Princeton Data Source under the direction of Princeton Survey Research Associates International. A combination of landline and cell phone random digit dial samples were used; both samples were provided by Survey Sampling International. Interviews were conducted in English and Spanish. Respondents in the landline sample were selected by randomly asking for the youngest adult male or female who is now at home. Interviews in the cell sample were conducted with the person who answered the phone, if that person was an adult 18 years of age or older. For detailed information about our survey methodology, see https://alpha.pewresearch.org/pewresearch-org/politics/methodology/

The combined landline and cell phone sample are weighted using an iterative technique that matches gender, age, education, race, Hispanic origin, region, and population density to parameters from the March 2010 Census Bureau’s Current Population Survey. The sample also is weighted to match current patterns of telephone status and relative usage of landline and cell phones (for those with both), based on extrapolations from the 2010 National Health Interview Survey. The weighting procedure also accounts for the fact that respondents with both landline and cell phones have a greater probability of being included in the combined sample and adjusts for household size within the landline sample. Sampling errors and statistical tests of significance take into account the effect of weighting. The following table shows the sample sizes and the error attributable to sampling that would be expected at the 95% level of confidence for different groups in the survey:

Sample sizes and sampling errors for other subgroups are available upon request.

Some of the analysis in this report is based on telephone interviews conducted June 16-19, 2011 among a national sample of 1,003 adults 18 years of age or older living in the continental United States (670 respondents were interviewed on a landline telephone, and 333 were interviewed on a cell phone, including 128 who had no landline telephone). The survey was conducted by interviewers at Princeton Data Source under the direction of Princeton Survey Research Associates International. A combination of landline and cell phone random digit dial samples were used; both samples were provided by Survey Sampling International. Interviews were conducted in English. Respondents in the landline sample were selected by randomly asking for the youngest adult male or female who is now at home. Interviews in the cell sample were conducted with the person who answered the phone, if that person was an adult 18 years of age or older.

The combined landline and cell phone sample are weighted using an iterative technique that matches gender, age, education, race, Hispanic origin, region, and population density to parameters from the March 2010 Census Bureau’s Current Population Survey. The sample also is weighted to match current patterns of telephone status, based on extrapolations from the 2010 National Health Interview Survey. The weighting procedure also accounts for the fact that respondents with both landline and cell phones have a greater probability of being included in the combined sample and adjusts for household size within the landline sample. Sampling errors and statistical tests of significance take into account the effect of weighting. The following table shows the sample sizes and the error attributable to sampling that would be expected at the 95% level of confidence for different groups in the survey:

Sample sizes and sampling errors for other subgroups are available upon request.
In addition to sampling error, one should bear in mind that question wording and practical difficulties in conducting surveys can introduce error or bias into the findings of opinion polls.


© Pew Research Center, 2011