Pew Research Center

FOR RELEASE MAY 4, 2011

Beyond Red vs. Blue: The Political Typology

Overview With the economy still struggling and the nation involved in multiple military operations overseas, the public’s political mood is fractious. In this environment, many political attitudes have become more doctrinaire at both ends of the ideological spectrum, a polarization that reflects the current atmosphere in Washington. Yet at the same time, a growing number […]

FOR MEDIA OR OTHER INQUIRIES:

Communications Department
202.419.4372
www.pewresearch.org

RECOMMENDED CITATION

Pew Research Center, May 2011, "Beyond Red vs. Blue: The Political Typology"

About Pew Research Center

Pew Research Center is a nonpartisan, nonadvocacy fact tank that informs the public about the issues, attitudes and trends shaping the world. It does not take policy positions. The Center conducts public opinion polling, demographic research, computational social science research and other data-driven research. It studies politics and policy; news habits and media; the internet and technology; religion; race and ethnicity; international affairs; social, demographic and economic trends; science; research methodology and data science; and immigration and migration. Pew Research Center is a subsidiary of The Pew Charitable Trusts, its primary funder.

© Pew Research Center 2026

Table of contents

  • About Pew Research Center
  • Beyond Red vs. Blue: The Political Typology
  • Typology Group Profiles
  • Section 1: The Political Typology
  • Section 2: Value Divides Within Party Coalitions
  • Section 3: Demographics and News Sources
  • Section 4: The Recession, Economic Stress and Optimism
  • Section 5: Views of Government, Constitution, American Exceptionalism
  • Section 6: Obama, 2012, and the Tea Party
  • Section 7: The Budget Deficit, Taxes, Spending and Entitlements
  • Section 8: Domestic Issues and Social Policy
  • Section 9: Foreign Policy and National Security
  • About the Political Typology
  • About the Surveys

Beyond Red vs. Blue: The Political Typology

Overview With the economy still struggling and the nation involved in multiple military operations overseas, the public’s political mood is fractious. In this environment, many political attitudes have become more doctrinaire at both ends of the ideological spectrum, a polarization that reflects the current atmosphere in Washington. Yet at the same time, a growing number […]

Overview

With the economy still struggling and the nation involved in multiple military operations overseas, the public’s political mood is fractious. In this environment, many political attitudes have become more doctrinaire at both ends of the ideological spectrum, a polarization that reflects the current atmosphere in Washington.

Yet at the same time, a growing number of Americans are choosing not to identify with either political party, and the center of the political spectrum is increasingly diverse. Rather than being moderate, many of these independents hold extremely strong ideological positions on issues such as the role of government, immigration, the environment and social issues. But they combine these views in ways that defy liberal or conservative orthodoxy.

For political leaders in both parties, the challenge is not only one of appeasing ideological and moderate “wings” within their coalitions, but rather holding together remarkably disparate groups, many of whom have strong disagreements with core principles that have defined each party’s political character in recent years.

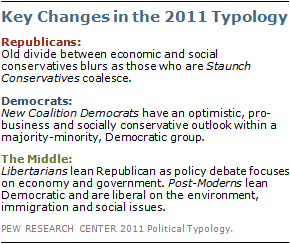
The most visible shift in the political landscape since Pew Research’s previous political typology in early 2005 is the emergence of a single bloc of across-the-board conservatives. The long-standing divide between economic, pro-business conservatives and social conservatives has blurred. Today, Staunch Conservatives take extremely conservative positions on nearly all issues – on the size and role of government, on economics, foreign policy, social issues and moral concerns. Most agree with the Tea Party and even more very strongly disapprove of Barack Obama’s job performance. A second core group of Republicans – Main Street Republicans – also is conservative, but less consistently so.

On the left, Solid Liberals express diametrically opposing views from the Staunch Conservatives on virtually every issue. While Solid Liberals are predominantly white, minorities make up greater shares of New Coalition Democrats – who include nearly equal numbers 0f whites, African Americans and Hispanics – and Hard-Pressed Democrats, who are about a third African American. Unlike Solid Liberals, both of these last two groups are highly religious and socially conservative. New Coalition Democrats are distinguished by their upbeat attitudes in the face of economic struggles.

Independents have played a determinative role in the last three national elections. But the three groups in the center of the political typology have very little in common, aside from their avoidance of partisan labels. Libertarians and Post-Moderns are largely white, well-educated and affluent. They also share a relatively secular outlook on some social issues, including homosexuality and abortion. But Republican-oriented Libertarians are far more critical of government, less supportive of environmental regulations, and more supportive of business than are Post-Moderns, most of whom lean Democratic.

Disaffecteds, the other main group of independents, are financially stressed and cynical about politics. Most lean to the Republican Party, though they differ from the core Republican groups in their support for increased government aid to the poor. Another group in the center, Bystanders, largely consign themselves to the political sidelines and for the most part are not included in this analysis.

These are the principal findings of the political typology study by the Pew Research Center for the People & the Press, which sorts Americans into cohesive groups based on values, political beliefs, and party affiliation. The new study is based on two surveys with a combined sample of 3,029 adults, conducted Feb. 22-Mar. 14, 2011 and a smaller callback survey conducted April 7-10, 2011 with 1,432 of the same respondents.

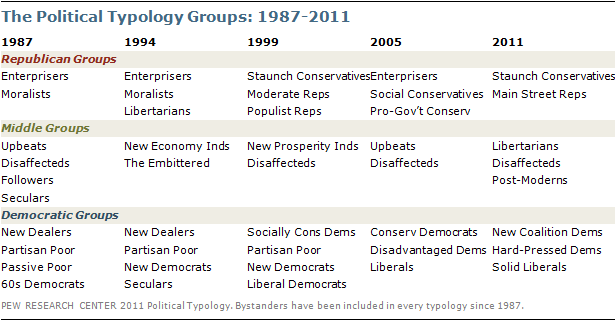
This is the fifth typology created by the Pew Research Center since 1987. Many of the groups identified in the current analysis are similar to those in past typologies, reflecting the continuing importance of a number of key beliefs and values. But there are a number of critical differences as well.

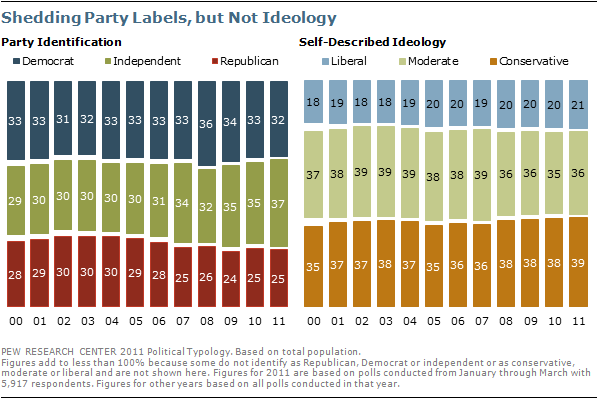
The new groupings underscore the substantial political changes that have occurred since the spring of 2005, when the previous typology was released. Today, there are two core Republican groups, compared with three in 2005, to some extent reflecting a decline in GOP party affiliation. However, Democrats have not made gains in party identification. Rather, there has been a sharp rise in the percentage of independents – from 30% in 2005 to 37% currently. Today, there are three disparate groups of independents, compared with two in 2005.

While Republicans trail the Democrats in party affiliation, they enjoy advantages in other areas: The two core GOP groups are more homogenous – demographically and ideologically – than are the three core Democratic groups. And socioeconomic differences are more apparent on the left: Nearly half of Solid Liberals (49%) are college graduates, compared with 27% of New Coalition Democrats and just 13% of Hard-Pressed Democrats.

The GOP still enjoys an intensity advantage, which proved to be a crucial factor in the Republicans’ victories in the 2010 midterm elections. For example, the GOP’s core groups – Staunch Conservatives and Main Street Republicans – express strongly negative opinions about last year’s health care legislation, while reactions among the Democratic groups are more mixed. Even Solid Liberals offer only tepid support for the bill – 43% say it will have a mostly positive impact on the nation’s health care, while somewhat more (51%) say it will have a mixed effect.

However, maintaining solid support among the GOP-oriented groups in the center of the typology represents a formidable challenge for Republicans. The cross-pressured Disaffecteds highlight this challenge. They were an important part of the GOP coalition in 2010, but were lackluster supporters of John McCain two years earlier.

Like the core GOP groups, most Disaffecteds (73%) view government as nearly always wasteful and inefficient. At the same time, a solid majority of Disaffecteds (61%) say the government should do more to help needy Americans even if that means going deeper into debt.

Libertarians, the other Republican-leaning group, overwhelmingly oppose expanding aid for the poor if it means increasing the nation’s debt. Yet on immigration and homosexuality, Libertarians’ views differ markedly from those of the core Republican groups. Fully 71% of Libertarians say homosexuality should be accepted by society; nearly as many Staunch Conservatives (68%) say it should be discouraged.
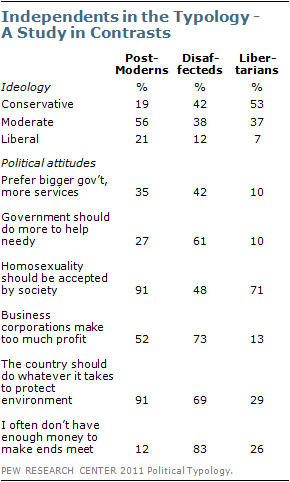
Many of the political values and attitudes of Post-Moderns, young, Democratically-oriented independents, fit awkwardly with those of core Democratic groups. Post-Moderns overwhelmingly voted for Obama in 2008, but their turnout fell off dramatically last fall, which contributed to the Democrats’ poor showing in the midterms. Compared with the core Democratic groups, Post-Moderns are less supportive of increased aid for the needy and are far less likely to view racial discrimination as the main obstacle to African American progress.

Partisan Dividing Line: Views of Government

The new typology finds a deep and continuing divide between the two parties, as well as differences within both partisan coalitions. But the nature of the partisan divide has changed substantially over time.

More than in the recent past, attitudes about government separate Democrats from Republicans, and it is these beliefs that are most correlated with political preferences looking ahead to 2012. In 2005, at the height of the Iraq war and shortly after an election in which national security was a dominant issue, opinions about assertiveness in foreign affairs almost completely distinguished Democrats from Republicans. Partisan divisions over national security remain, but in an era when the public’s focus is more inward-looking, they are less pronounced.

As in recent years, beliefs about the environment, business, immigration and the challenges faced by African Americans are important fissures between the parties, though to some extent within them as well.

In general, there is far more agreement across the two core GOP groups than the three core Democratic groups. Staunch Conservatives and Main Street Republicans express highly critical opinions about government performance and are both deeply skeptical of increased government aid to the poor if it means adding to the debt.
Yet Staunch Conservatives have much more positive opinions about business than do Main Street Republicans. Attitudes about the environment also divide the two core GOP groups: 92% of Staunch Conservatives say that stricter environmental laws cost too many jobs and hurt the economy; just 22% of Main Street Republicans agree.

The differences among core Democratic groups show up across a wider range of fundamental political values. Social and moral issues divide Solid Liberals, who are more secular, from other Democratic groups who are much more religious.

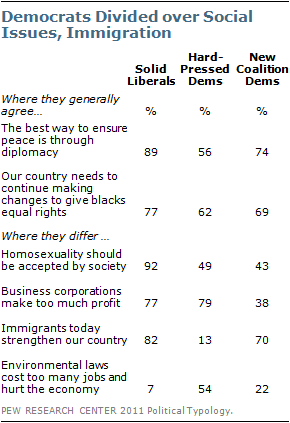
Opinions about business, immigration and the economic impact of environmental laws and regulations also divide the Democratic groups. For instance, more than half of Hard-Pressed Democrats (54%) say that stricter environmental laws and regulations cost too many jobs and hurt the economy; just 22% of New Coalition Democrats and 7% of Solid Liberals share this view.

Race and ethnicity are factors in some of the opinion differences among Democrats. New Coalition Democrats, who are roughly a quarter Hispanic, have positive views of immigrants. Fully 70% say immigrants strengthen the country because of their hard work and talents.
Hard-Pressed Democrats – who are mostly white and African American – take a dim view of immigrants’ contributions. Just 13% say immigrants strengthen the country, while 76% say they are a burden because they take jobs and health care.

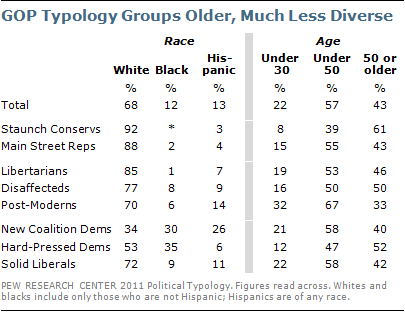
Age also is a factor in partisanship and political values. Younger people are more numerous on the left, and older people on the right. However, many young people think of themselves as independents rather than as Democrats. Post-Moderns, Democratic-oriented independents, are by far the youngest group in the typology, but they often deviate from traditional Democratic orthodoxy and are not consistent voters.

Older people, who have increasingly voted Republican in recent years, are found disproportionately in the Staunch Conservative bloc – 61% are 50 or older. And this group is highly politically engaged; 75% say they follow government and public affairs most of the time.

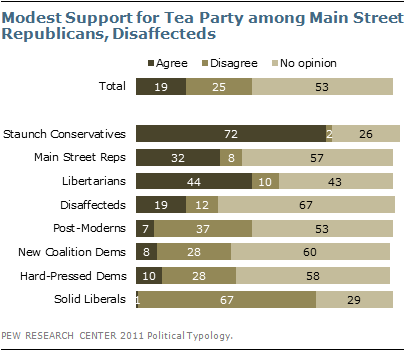
Staunch Conservatives also include by far the largest share of Tea Party supporters – 72% of Staunch Conservatives agree with the movement. The Tea Party’s appeal is deeper than it is wide. There is no other typology group in which a majority agrees with the Tea Party. Aside from Staunch Conservatives, Libertarians are most supportive (44% agree).

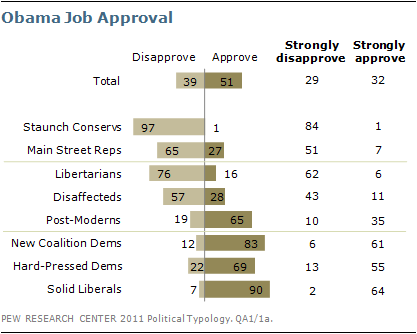
The survey suggests that while the Tea Party is a galvanizing force on the right, strong disapproval of Barack Obama is an even more powerful unifying factor among fervent conservatives. No fewer than 84% of Staunch Conservatives strongly disapprove of Obama’s job performance and 70% rate him very unfavorably personally. Ardent support for Obama on the left is no match for this – 64% of Solid Liberals strongly approve of him, and 45% rate him very favorably.

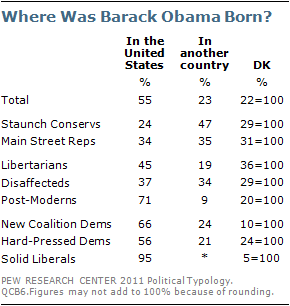
More than two years into office, Obama’s personal image is positive though his job approval ratings are mixed. Yet doubts about Obama’s background and biography persist. More than one-in-five Americans (23%) say, incorrectly, that Obama was born outside the United States; another 22% are not sure where Obama was born. Nearly half of Staunch Conservatives (47%) and 35% of Main Street Republicans say that Obama was born in another country. Only among Solid Liberals is there near total agreement that Obama was, in fact, born in the United States (95%). (NOTE: The survey was conducted before President Obama released his long-form birth certificate on April 27.)

Other Major Findings

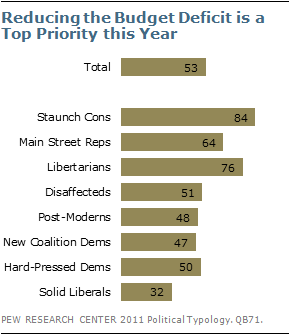
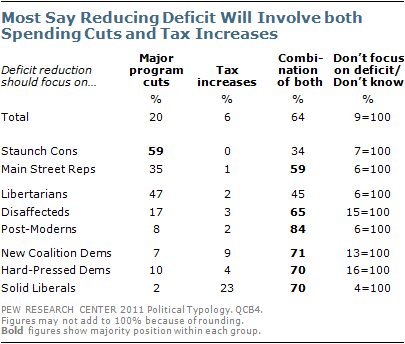
  • Majorities in most typology groups say the country will need both to cut spending and raise taxes to reduce the budget deficit. Staunch Conservatives are the exception – 59% say the focus should only be on cutting spending.
  • Core GOP groups largely prefer elected officials who stick to their positions rather than those who compromise. Solid Liberals overwhelmingly prefer officials who compromise, but the other two Democratic groups do not.
  • For Staunch Conservatives it is still “Drill, Baby, Drill” – 72% say that expanding exploration for and production of oil, coal and natural gas is the more important energy priority. In most other typology groups, majorities say developing alternatives is more important.
  • Republican groups say the Supreme Court should base rulings on its interpretation of the Constitution “as originally written.” Democratic groups say the Court should base its rulings on what the Constitution means today.
  • Main Street Republicans and GOP-oriented Disaffecteds are far more likely than Staunch Conservatives or Libertarians to favor a significant government role in reducing childhood obesity.
  • Solid Liberals are the only typology group in which a majority (54%) views democracy as more important than stability in the Middle East. Other groups say stable governments are more important or are divided on this question.
  • New Coalition Democrats are more likely than the other core Democratic groups to say that most people can make it if they are willing to work hard.
  • More Staunch Conservatives regularly watch Fox News than regularly watch CNN, MSNBC and the nightly network news broadcasts combined.
  • There are few points on which all the typology groups can agree, but cynicism about politicians is one. Majorities across all eight groups, as well as Bystanders, say elected officials lose touch with the people pretty quickly.
  • Staunch Conservatives overwhelmingly want to get tougher with China on economic issues. Across other typology groups, there is far more support for building stronger economic relations with China.
  • The allied airstrikes in Libya divide Democratic groups. Solid Liberals and New Coalition Democrats favor the airstrikes, but about as many Hard-Pressed Democrats favor as oppose the operation.
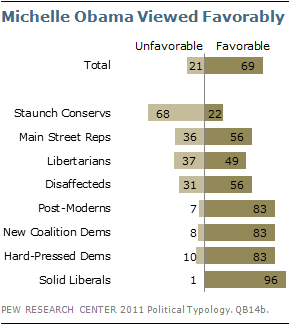
  • Michelle Obama is popular with Main Street Republicans, as well as most other typology groups. But Staunch Conservatives view the first lady unfavorably – and 43% view her very unfavorably.

Making the Typology

The 2011 typology divides the public into eight politically engaged groups, along with a ninth group of less engaged Bystanders. It is the fifth of its kind, following on previous studies in 1987, 1994, 1999 and 2005.

Using a statistical procedure called cluster analysis, individuals are assigned to one of the eight core typology groups based on their position on nine scales of social and political values – each of which is determined by responses to two or three survey questions – as well as their party identification. Several different cluster solutions were evaluated for their effectiveness in producing cohesive groups that are distinct from one another, substantively meaningful and large enough in size to be analytically practical. The final solution selected to produce the political typology was judged to be strongest from a statistical point of view and to be most persuasive from a substantive point of view. As in past typologies, a measure of political attentiveness and voting participation was used to extract the “Bystander” group, people who are largely not engaged or involved in politics, before performing the cluster analysis.

For a more complete description of the methodology used to create the typology, see About the Political Typology. For more information about the survey methodology seen About the Surveys.

Typology Group Profiles

Staunch Conservatives

9% OF ADULT POPULATION /11% OF REGISTERED VOTERS

Basic Description: This extremely partisan Republican group is strongly conservative on economic and social policy and favors an assertive foreign policy. They are highly engaged in politics, most (72%) agree with the Tea Party, 54% regularly watch Fox News, and nearly half (47%) believe that President Obama was born outside the U.S.

Defining values: Extremely critical of the federal government and supportive of sharply limited government. Pro-business and strongly opposed to environmental regulation. Believe that military strength is the best way to ensure peace. Highly religious; most say homosexuality should be discouraged by society.

Who they are: More than nine-in-ten (92%) non-Hispanic white and 56% male. The oldest of the groups (61% ages 50 and older). Married (79%), Protestant (72%, including 43% white evangelical), and financially comfortable (70% say paying the bills is not a problem).

Lifestyle notes: Many are gun owners (57%) and regular churchgoers (57% attend weekly or more often), and fully 81% are homeowners. More watch Glenn Beck (23%) and listen to Rush Limbaugh (21%) than any other group.

Main Street Republicans

11% OF ADULT POPULATION /14% OF REGISTERED VOTERS

Basic Description: Concentrated in the South and Midwest. Main Street Republicans differ from Staunch Conservatives in the degree of their conservatism and in their skepticism about business. They are socially and fiscally conservative but supportive of government efforts to protect the environment.

Defining values: Highly critical of government. Very religious and strongly committed to traditional social values. Generally negative about immigrants and mostly opposed to social welfare programs. But much less enamored of business than Staunch Conservatives, and less supportive of an assertive foreign policy.

Who they are: Predominantly non-Hispanic white (88%), with two-thirds living in the South (40%) or Midwest (27%). A majority are Protestant (65%, including 38% white evangelical). A large majority (69%) are generally satisfied financially.

Lifestyle notes: Most (84%) are homeowners. About half are gun owners (51%) and regular churchgoers (53% attend weekly or more often). Nearly a quarter (24%) follow NASCAR racing. About half (51%) watch network evening news.

Libertarians

9% OF ADULT POPULATION /10% OF REGISTERED VOTERS

Basic Description: This Republican-oriented, predominantly male group mostly conforms to the classic profile of the libertarian in its combination of strong economic conservatism and relatively liberal views on social issues. Much less religious than other GOP-oriented groups, Libertarians are relatively comfortable financially– nearly half (46%) say they are professional or business class, among the highest of the typology groups.

Defining values: Highly critical of government. Disapprove of social welfare programs. Pro-business and strongly opposed to regulation. Accepting of homosexuality. Moderate views about immigrants compared with other Republican-oriented groups.

Who they are: Most (85%) are non-Hispanic white and two-thirds (67%) are male. Well educated (71% have attended college) and affluent (39% have incomes of $75,000 or more).

Lifestyle notes: Less likely than other GOP groups to attend church weekly (26%). More than half (56%) use social networking sites, and 46% have a gun in the household. 54% currently have a U.S. passport. 36% trade stocks. 38% regularly watch Fox News and 17% regularly listen to NPR.

Disaffecteds

11% OF ADULT POPULATION /11% OF REGISTERED VOTERS

Basic Description: The most financially stressed of the eight typology groups, Disaffecteds are very critical of both business and government. They are sympathetic to the poor and supportive of social welfare programs. Most are skeptical about immigrants and doubtful that the U.S. can solve its current problems. They are pessimistic about their own financial future.

Defining values: A majority believe that the government is wasteful and inefficient and that regulation does more harm than good. But nearly all say too much power is concentrated in a few companies. Religious and socially conservative.

Who they are: About three-quarters (77%) are non-Hispanic white and two-thirds (66%) have only a high school education or less. Compared with the national average, more are parents (44%). Fully 71% have experienced unemployment in their household in the past 12 months. About half (48%) describe their household as “struggling.”

Lifestyle notes: Only 26% have a U.S. passport. 23% follow NASCAR. 41% did not vote in 2010.

Post-Moderns

13% OF ADULT POPULATION /14% OF REGISTERED VOTERS

Basic Description: Well-educated and financially comfortable. Post-Moderns are supportive of many aspects of government though they take conservative positions on questions about racial policy and the social safety net. Very liberal on social issues. Post-Moderns were strong supporters of Barack Obama in 2008, but turned out at far lower rates in 2010.

Defining values: Strongly supportive of regulation and environmental protection. Favor the use of diplomacy rather than military force to ensure peace. Generally positive about immigrants and their contributions to society.

Who they are: The youngest of the typology groups (32% under age 30); a majority are non-Hispanic white (70%) and have at least some college experience (71%). Nearly a third (31%) are unaffiliated with any religious tradition. Half live in either the Northeast (25%) or the West (25%). A majority (58%) lives in the suburbs.

Lifestyle notes: 63% use social networking. One-in-five (20%) regularly listen to NPR, 14% regularly watch The Daily Show, 10% read the New York Times. 31% trade stocks and 53% have a passport.

New Coalition Democrats

10% OF ADULT POPULATION /9% OF REGISTERED VOTERS

Basic Description: This majority-minority group is highly religious and financially stressed. They are generally upbeat about both the country’s ability to solve problems and an individual’s ability to get ahead through hard work.

Defining values: Generally supportive of government, but divided over expanding the social safety net. Reflecting their own diverse makeup, they are pro-immigrant. Socially conservative, about as many say homosexuality should be discouraged as say it should be accepted.

Who they are: Nearly equal proportions white (34%), black (30%) and Latino (26%); about three in ten (29%) are first- or second-generation Americans. 55% have only a high school education or less. Nearly a quarter (23%) are not registered to vote.

Lifestyle notes: Half (50%) are regular volunteers for charity or non-profit groups. More than a quarter (27%) are looking for work or would prefer a full-time job to the part-time job they currently hold. Only 34% read a daily newspaper. 25% regularly listen to NPR. 34% buy organic foods.

Hard-Pressed Democrats

13% OF ADULT POPULATION /15% OF REGISTERED VOTERS

Basic Description: This largely blue-collar Democratic group is struggling financially and is generally cynical about government. Nearly half (47%) expect that they will not earn enough to lead the kind of life they want. Socially conservative and very religious.

Defining values: Critical of both business and government. View immigrants as an economic burden and a cultural threat. Supportive of environmental protection in general but concerned about the economic impact of environmental laws and regulations.

Who they are: A sizable number are non-Hispanic African American (35%), while 53% are non-Hispanic white. About seven-in-ten live in the South (48%) or Midwest (23%). Most (61%) are female. Two-thirds (68%) have only a high school education or less.

Lifestyle notes: Only 28% have a U.S. passport. More than four-in-ten (43%) describe their household as “struggling.” About one-in-five (21%) are currently out of work and seeking a job. 23% follow NASCAR. 61% regularly watch network evening news and 44% watch CNN.

Solid Liberals

14% OF ADULT POPULATION /16% OF REGISTERED VOTERS

Basic Description: Politically engaged, Solid Liberals are strongly pro-government and hold liberal positions across the full range of political issues. They are one of the most secular groups. Two-thirds (67%) say they disagree with the Tea Party.

Defining values: Very supportive of regulation, environmental protection and government assistance to the poor. Socially tolerant, supportive of the growing racial and ethnic diversity of the country. A majority (59%) say that religion is not that important to them.

Who they are: Compared with the general public, more live in the Northeast (25%) and the West (28%). About half (49%) are college graduates , including 27% with post-graduate experience, the most of any group. 57% are female.

Lifestyle notes: Less likely than any other group to watch Fox News. About a third (34%) regularly listen to NPR, 21% regularly watch The Daily Show, 18% regularly read the New York Times. Six-in ten(60%) use social networking sites. 59% have a U.S. passport; 21% are first- or second-generation Americans. Many (42%) regularly buy organic foods.

Bystanders

10% OF ADULT POPULATION /0% OF REGISTERED VOTERS

Basic Description: Defined by their disengagement from the political process, either by choice or because they are ineligible to vote. They are highly unlikely to vote (61% say they seldom vote, and 39% volunteer that they never vote; none are currently registered to vote). Most follow government and public affairs only now and then (42%) or hardly at all (23%).

Who they are: Bystanders are overwhelmingly young (51% are under 30) and nearly half are Latino (38%) or black (9%). A third (33%) are first- or second-generation Americans. They are diverse in their political views though they lean Democratic, and their values more often align with the Democratic than the Republican groups. They also have much more favorable attitudes about the Democratic Party and its political figures than about the Republican Party. More than half (54%) have incomes under $30,000 annually. Nearly two-thirds (64%) report that they or someone in their household were unemployed in the past year; 72% have only a high school education or less.

Lifestyle notes: Only 24% regularly read a daily newspaper. About a third (35%) regularly watch network evening news. Only 33% own their home, while 36% are looking for work or would prefer a full-time job to a part-time job they currently hold. Compared with most other groups, relatively few (25%) have a gun in the household, trade stocks in the market (8%), or have a labor union member in the household (5%).

Section 1: The Political Typology

The 2011 Political Typology is the fifth of its kind, following on previous studies in 1987, 1994, 1999 and 2005. The events of the past six years have resulted in a substantial shift in the political landscape, producing new alignments within each of the two parties and in the middle. In particular, views about the role of government increasingly separate the Republican and Democratic groups, which represents a change from 2005 when national security was more strongly associated with partisanship. This is partly a result of the public’s attention turning more to domestic and economic issues. Other core values also continue to divide the public, including views of business, helping the poor, environmentalism and immigration.

One of the dominant trends in American politics over the past decade has been the continuing polarization of American politics. The political chasm between “Red” and “Blue” America that opened in the latter half of the Bush presidency has further widened since Barack Obama took office. Yet to view American politics solely through the lens of partisan strife overlooks significant differences within these partisan bases, as well as within the political center. While we are seeing more doctrinaire ideological consistency at each end of the spectrum, there is, if anything, even more diversity of values in the political center.

The typologies developed by the Pew Research Center are designed to provide a more complete and detailed description of the political landscape, classifying people on the basis of a broad range of value orientations rather than just on the basis of party identification or self-reported political ideology. As in the past, the new typology reveals substantial political and social differences within as well as across the two political parties. It also provides insights into the political and social values of independents, a growing part of the American electorate, but one that is far from unified in terms of values and ideological beliefs.

Some of the groups in this year’s typology share characteristics with those identified in previous typologies, reflecting the continued importance of key ideological positions among some segments of the electorate. Other groups are distinctly new and partly reflect the influx of younger voters and racial and ethnic minorities who are now influencing the political alignments. As new groups have emerged and the political and economic climate has changed, some groups identified in previous typologies have disappeared entirely.

An Evolving Landscape: The 2011 Typology

Perhaps the most notable change in the new typology is the realignment of the political right over the past six years. In 2005, and most previous studies, the Republican coalition was a sometimes uneasy mix of two main groups – one characterized by its economic conservatism and another by its social conservatism. Six years ago, there also was a third Republican group, “Pro-Government Conservatives,” who were critical to George W. Bush’s reelection in 2004. Pro-Government Conservatives were aligned with the other Republican groups on foreign policy and social issues. As their name suggests, they also were supporters of government programs, including the social safety net, environmental protection, and regulation of business.

Today, the classic division between economic and social conservatives is blurred, as Americans who are deeply conservative across the board have coalesced into a single, highly activated group of Staunch Conservatives. A second group of Main Street Republicans has nearly as strong a partisan identity, but is less politically active, and differs from the Staunch Conservatives on key dimensions such as business and the environment. A new Republican-oriented group of Libertarians believe in the same economically conservative principles as the Staunch Conservatives, but its members differ when it comes to social issues, where they are very secular. Disaffecteds, another GOP-leaning group, has been a part of Pew Research typologies since 1987.

The left side of the political spectrum has also seen realignment, most notably because of the diversity of views among minorities and younger Americans, who represent the growing segment of the Democratic Party’s base. As was the case in 2005, the foundation of the Democratic Party’s base is composed of Solid Liberals, who are mostly white and liberal across the board, and Hard-Pressed Democrats, a group that includes many minorities and whose members have generally lower incomes and more socially conservative views.

Coupled with these, past typology studies found a third group of socially conservative Democrats who were older, mostly white, and held traditional social values while supporting New Deal-type policies. This year, however, the balance has tipped toward a group of New Coalition Democrats, who are defined not only by their social conservatism, but by their ethnic diversity and optimism in the face of the recession. The appearance of the New Coalition Democrats is further evidence that while African-Americans and Hispanic-Americans continue to overwhelmingly align with the Democratic Party, they are hardly unified blocks in terms of ideology and values.

A group of independently-minded Post-Moderns, who have voted overwhelmingly Democratic in the past two elections, are the youngest of all the typology groups. This mostly secular group agrees with Solid Liberals on social issues, immigration and the environment, but is not engaged with the traditional liberal rallying cries of the New Deal or Great Society. Instead, this group tends to be more supportive of Wall Street and business interests, and skeptical of broad-based social justice programs aimed at helping African-Americans and the poor.

More Independent, But Not More Moderate

In recent years, the public has become increasingly averse to partisan labels. Pew Research Center polling over the first quarter of 2011 finds 37% of Americans identifying as independents, up from 30% in 2005 and 35% last year. Over the past 70 years, the only other time that independent identification reached a similar level was in 1992, the year when Ross Perot was a popular independent presidential candidate.

The growing rejection of partisan identification does not imply a trend toward political moderation, however. In fact, the number of people describing their political ideology as moderate has, if anything, been dropping. So far in 2011, 36% say they are moderate politically, which is unchanged from 2008 but slightly lower than in 2005 (38%).

Meanwhile, conservatives outnumber liberals by nearly two-to-one. The number identifying as conservative has edged up to 39% this year from 35% in 2005, while the number of liberals is little changed (21% now, 20% then).

Party Affiliation and the Typology Groups

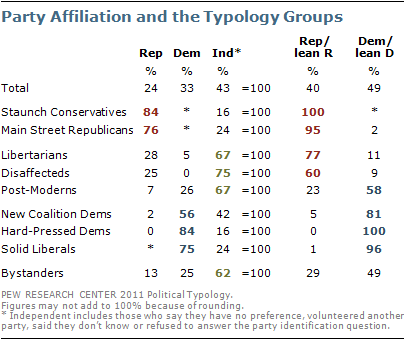
The new political typology finds two groups that are clearly Republican in their political orientation, three that are predominantly Democratic, and – reflecting the growing number of independents – four in which majorities eschew party labels. Within this broad political center are two Republican-leaning groups and one Democratic-leaning group, along with the politically uninvolved Bystanders.

On the right, Staunch Conservatives and Main Street Republicans overwhelmingly identify as Republicans. Similarly, on the left large majorities of Solid Liberals and Hard-Pressed Democrats consider themselves Democrats. While a majority of New Coalition Democrats identify with the Democratic Party, many consider themselves independents (though most say they lean toward the Democratic Party).

The middle is far more diverse. Although majorities in all of these groups identify as political independents, 77% of Libertarians and 60% of Disaffecteds lean to the GOP while 58% of Post-M0derns lean to the Democratic Party. The politically disengaged Bystanders – who do not vote or follow politics – lean somewhat to the Democratic Party.

Lessons from 2008 and 2010

The voting behavior of the typology groups in the past two election cycles is consistent with each group’s underlying partisan leanings, but also reveals how tenuously each party’s winning coalition depends on candidates and circumstances.

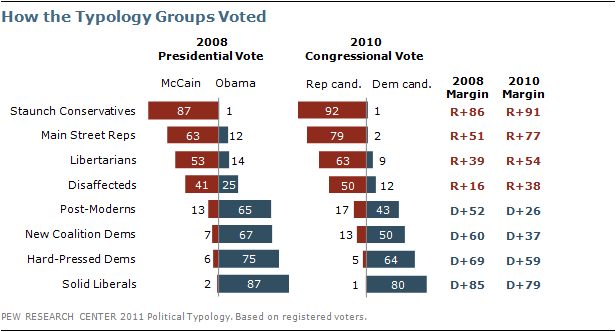
Barack Obama won the 2008 presidential election by solidifying the backing of not only the Solid Liberal and Hard-Pressed Democratic groups, but also by activating and appealing to New Coalition Democrats and Post-Moderns. Fully 87% of Obama’s votes came from these four key coalition sources, though he attracted a respectable 13% of his overall vote total by reaching out to Disaffecteds, Libertarians and Main Street Republicans as well. (Obama won virtually no support from Staunch Conservatives.)

The 2010 midterms revealed the fragility of this electoral base. While both Solid Liberals and Hard-Pressed Democrats remained solidly behind Democratic congressional candidates in 2010, support slipped substantially among New Coalition Democrats and Post-Moderns – not because Republicans made overwhelming gains in these groups, but because their turnout dropped so substantially. Where two-thirds of New Coalition Democrats came out to vote for Obama in 2008, just 50% came out to back Democrats in 2010. The drop-off in the Democratic vote was even more severe among Post-Moderns, 65% of whom backed Obama, but just 43% of whom came to the polls for Democrats in 2010.

Equally important was the shoring up of center groups by the GOP in 2010. In particular, Disaffecteds favored McCain over Obama by a 16-point margin (41% to 25%) in 2008, but backed Republicans by nearly five-to-one (50% to 12%) in 2010. Libertarians, too, were more likely to back GOP candidates in 2010 (63%), than McCain in 2008 (53%).

And while Staunch Conservatives voted solidly Republican in both years, the 2010 midterm was a far more crystallizing election for Main Street Republicans, with 79% backing Republican Congressional candidates compared with the 63% who came out to vote for McCain two years earlier. Overall, 89% of Republican votes cast in 2010 came from the four Republican-oriented voting blocs.

Looking toward 2012, these past two election cycles serve as a model of what the core party coalitions look like. The following sections will show how challenging the maintenance of these winning coalitions will be for political leaders on both sides of the aisle.

Creating the Typology

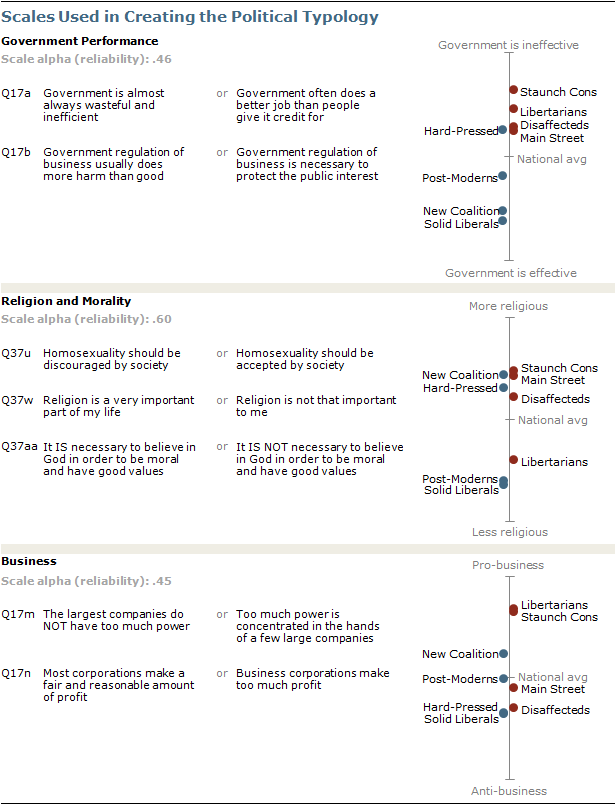
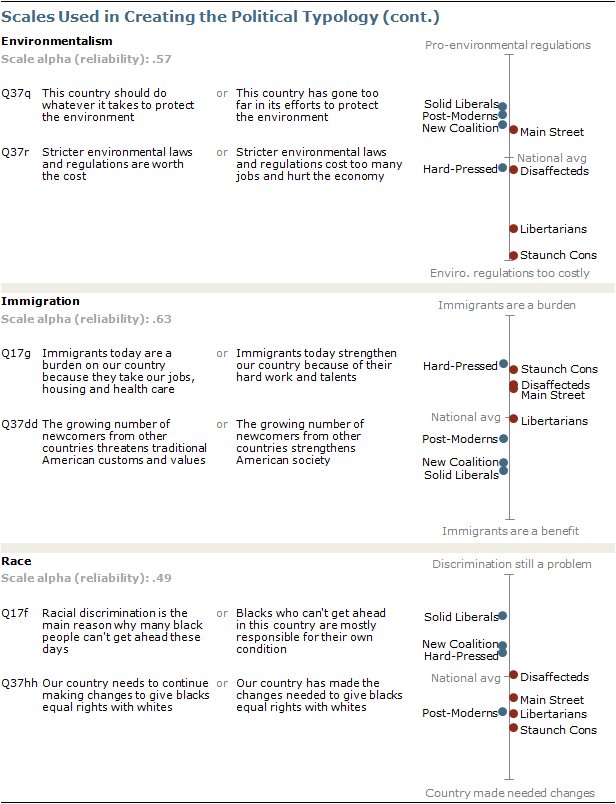
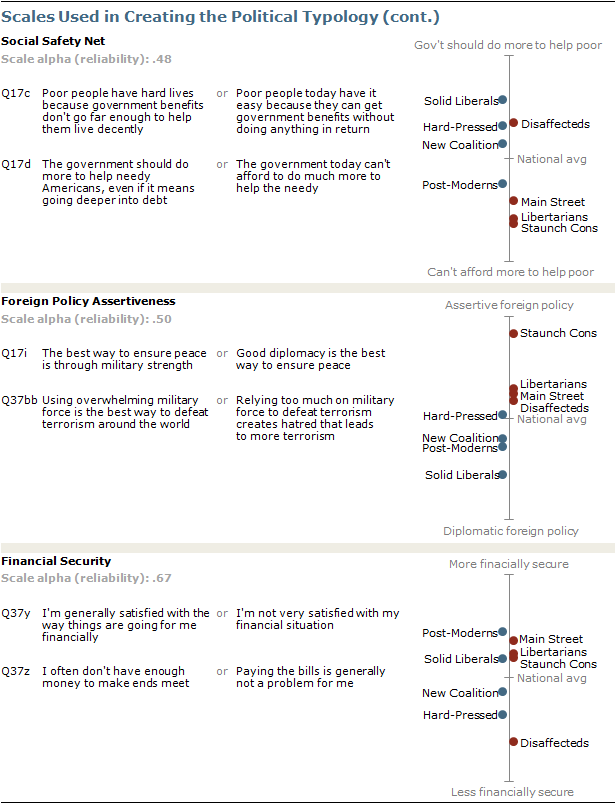
The 2011 typology divides the public into eight politically engaged groups, in addition to the Bystanders. These groups are defined by their attitudes toward government and politics and a range of other social, economic and religious beliefs. In addition to partisan affiliation and leaning, the typology is based on nine value orientations, each of which is reflected on a scale derived from two or more questions in the survey. The scales are as follows:

  • Government Performance. Views about government waste and efficiency and regulation of business.
  • Religion and Morality. Attitudes concerning the importance of religion in people’s lives, whether it is necessary to believe in God to be moral and views about homosexuality.
  • Business. Attitudes about the influence of corporations and the profits they make.
  • Environmentalism. Opinions on environmental protection and the cost and benefits of environmental laws and regulations.
  • Immigration. Views about the impact of immigrants on American culture, jobs and social services.
  • Race. Attitudes concerning racial discrimination and whether the country has made changes to give blacks equal rights with whites.
  • Social Safety Net. Opinions on the role of government in providing for the poor and needy.
  • Foreign Policy Assertiveness. Opinions on the efficacy of military strength vs. diplomacy and the use of force to defeat terrorism.
  • Financial Security. Level of satisfaction with current economic status and whether struggling to pay the bills.

These measures are based on broadly oriented values designed to measure a person’s underlying belief about what is right and wrong, acceptable or unacceptable, or what the government should or should not be involved in. The scales are not based on a person’s opinions about political leaders and parties or current issues.

Section 2: Value Divides Within Party Coalitions

The new political typology provides further evidence of deep and enduring partisan divisions over political attitudes and preferences. Yet an analysis of the typology groups’ fundamental political values also shows significant cleavages within both parties’ core groups and their broader coalitions over attitudes toward business, immigration, religion, the environment and other issues.

Looking at the broad Republican coalition, the core GOP groups and Republican-oriented independent groups are strongly critical of government. But the core Republican groups – Staunch Conservatives and Main Street Republicans – differ sharply in their opinions about business, the environment and foreign assertiveness. Republican-leaning Libertarians hold much more tolerant views on immigration and homosexuality, while Disaffecteds stand out for their support for government aid to the poor.

On the Democratic side, Solid Liberals and Post-Moderns are less religious than the Hard-Pressed and New Coalition Democrats and are more accepting of homosexuality. Hard-Pressed Democrats stand out for their critical views of government and negative attitudes about immigrants. The Democratic-leaning Post-Moderns are far less supportive of government help for the poor and of making more changes to give blacks equal rights with whites.

Fully 68% of Hard-Pressed Democrats – financially struggling Democratic loyalists – say that government is almost always wasteful and inefficient. On this measure, Hard-Pressed Democrats find more in common with the GOP coalition than with other Democratic groups and the Democratic-leaning Post-Moderns.

Large majorities of both Solid Liberals (74%) and New Coalition Democrats (66%) say that government often does a better job than people give it credit for. Just 22% in each group say that government is usually wasteful and inefficient. Post-Moderns are divided, with about as many saying government deserves more credit (50%) as say it is often wasteful and inefficient (45%).

All four groups in the broad GOP coalition express overwhelmingly negative opinions about government performance. While the Republican groups agree on the government’s performance, they differ over government’s role – specifically when it comes to aiding the poor and needy. On this issue, the Disaffecteds – by far the lowest-income group in the GOP coalition – break with other Republican and Republican-oriented groups.

A majority of Disaffecteds (61%) say that the government should do more to help needy Americans even if means going deeper into debt; 27% say the government today cannot afford to do much more to help the needy. Three-quarters or more in the other three groups in the Republican coalition say the government cannot afford to provide more help for the poor.

Among groups in the Democratic coalition, Post-Moderns stand out for their negative view of increased government help for the poor – fully 66% say the government cannot afford to do more. This is consistent with the Post-Moderns’ support for smaller government – 55% prefer a smaller government with fewer services, a higher proportion than in any of the Democratic groups.

Moreover, Post-Moderns are the only group within the broad Democratic coalition in which a majority (54%) thinks that poor people today have it easy because they can get government benefits without doing anything in return. And just as Disaffecteds break from other groups in the Republican coalition in their support for increased aid to the needy, so too do they diverge in their view of the poor’s reliance on the government. Large majorities in the two core Republican groups, as well as among the GOP-leaning Libertarians, say the poor have it easy, but just 22% of Disaffecteds agree.

Views of Business Divide GOP

Solid Liberals and Hard-Pressed Democrats overwhelmingly say that business corporations make too much profit. On the right, large proportions of Staunch Conservatives and Libertarians disagree.

Yet the other typology groups divide over this issue. Among GOP groups, 73% of Disaffecteds view corporate profits as excessive, as do 58% of Main Street Republicans. This is a rare instance where Main Street Republicans fundamentally disagree with Staunch Conservatives.

New Coalition Democrats differ with other Democratic groups in opinions about corporate profits. A majority (53%) says corporations make a fair and reasonable amount of profit, while 38% say profits are too high.

There is greater agreement across the typology that a few large businesses have too much power. Large majorities in six of the eight main typology groups say there is too much power concentrated in the hands of a few large companies. This view is not as prevalent among Staunch Conservatives and Libertarians; still about half of each group says that a few huge companies have amassed too much power (51% of Staunch Conservatives, 50% of Libertarians).

Democratic Coalition Divides Over Race

The Democratic coalition is deeply divided over political values relating to race. Solid Liberals and Post-Moderns – both mostly white and relatively upscale – have very different attitudes about the factors limiting black progress and whether further efforts are needed to achieve racial equality.

Most Solid Liberals (61%) say that racial discrimination is the main reason why many black people can’t get ahead these days; they are the only typology group in which a majority expresses this view.

By contrast, Post-Moderns overwhelmingly reject the idea that racial discrimination is the main barrier to black progress (just 9% say this). Nearly eight-in-ten (79%) say that blacks who can’t get ahead in this country are mostly responsible for their own condition. On this measure, the opinions of Post-Moderns are close to those of the four groups in the GOP coalition, where majorities say that blacks who cannot get ahead are responsible for their own condition.

Hard-Pressed Democrats and New Coalition Democrats also say on balance that blacks who are unable to get ahead are responsible for their fate. About half in each group expresses this view, while fewer think racial discrimination is the biggest reason that many blacks cannot get ahead.

Post-Moderns are the only group in the Democratic coalition who reject the idea that the country needs to continue making changes to give blacks equal rights with whites. Nearly seven-in-ten Post-Moderns (69%) say the country has made the changes needed to give blacks equal rights with whites. By contrast, clear majorities of Solid Liberals (77%), New Coalition Democrats (69%) and Hard-Pressed Democrats (62%) say that more changes are needed in order to achieve racial equality.

Immigration Divides Both Partisan Coalitions

Opinions about immigrants and their impact on the country divide both partisan coalitions. On the Democratic side, Hard-Pressed Democrats are the only group in which a majority views immigrants as a “burden” because of their impact on jobs and social services, and says that the growing number of newcomers to the U.S. threaten traditional customs and values. The three other groups in the Democratic coalition express much more positive views of immigrants’ impact on the country.

Among GOP-oriented groups, Libertarians express more positive opinions about immigrants. A majority (52%) of Libertarians say the growing number of newcomers strengthen American society; Libertarians are divided over whether immigrants strengthen the United States or are a burden. Majorities in the other GOP groups express more negative views of immigrants; most say that the increasing number of newcomers threaten traditional customs and values, and that immigrants are a burden because of their impact on jobs, housing and health care.

Libertarians Break From GOP on Religion, Homosexuality

As was the case in 2005, social and religious issues continue to divide the core Democratic groups more sharply than the core Republican groups. But looking at the broader GOP coalition, Libertarians stand out for their more moderate views on social issues and relatively low level of religiosity.

About half (53%) of Libertarians say that religion is a very important part of their life. That compares with 91% of Main Street Republicans, 90% of Staunch Conservatives and 84% of Disaffecteds, the other group of GOP-leaning independents.

Moreover, a large majority of Libertarians (71%) say that homosexuality should be accepted by society. By contrast, 68% of Staunch Conservatives and 60% of Main Street Republicans say that homosexuality should be discouraged by society. Disaffecteds are divided; 48% say society should accept homosexuality and 41% say it should be discouraged.

The core Democratic groups are split over the importance of religion and in their acceptance of homosexuality. Nine-in-ten New Coalition Democrats (92%) and nearly as many Hard-Pressed Democrats (86%) say religion is very important personally, compared with just 38% of Solid Liberals. Democratic-oriented Post-Moderns are closer to Solid Liberals than the other two groups – 42% say religion is very important in their life.

The differences are nearly as wide in views of societal acceptance of homosexuality. While 92% of Solid Liberals favor acceptance of homosexuality, just 49% of Hard-Pressed Democrats and 43% of New Coalition Democrats agree.

Post-Moderns also are in sync with Solid Liberals in views of homosexuality; 91% of the Post-Moderns say homosexuality should be accepted by society. These two groups also stand out for their overwhelming support of same-sex marriage: 85% of Solid Liberals and 80% of Post-Moderns say gays and lesbians should be allowed to marry legally, by far the highest proportions among the typology groups.

Little Consensus on Environmental Regulation

Republican groups in the political typology have long been divided in their views of the environment and that remains the case today. Staunch Conservatives and Libertarians are the only groups in which majorities say the U.S. has gone too far in its efforts to protect the environment. In all other groups – including Main Street Republicans and the GOP-leaning Disaffecteds – most say that this country should do whatever it takes to protect the environment.

The question of how far to go in protecting the environment becomes more complicated when the potential economic costs of environmental protection are mentioned. Three of four groups in the broad GOP coalition, including a slight majority of Disaffecteds, say that stricter environmental laws cost too many jobs and hurt the economy. But Main Street Republicans overwhelmingly disagree– 67% say that stricter environmental laws are worth the cost.

In three of the four groups in the broad Democratic coalition, large majorities say that tougher environmental laws are worth the economic cost. But just 39% of Hard-Pressed Democrats agree, while 54% say such laws and regulations cost too many jobs and harm economic growth.

Views of Military Assertiveness

The 2005 typology survey, which was conducted amid contentious debates over the Iraq war, found greater differences between the partisan coalitions in opinions about military assertiveness than within them. But today, the Republican groups in the political typology differ over a fundamental precept in security policy – whether military strength or good diplomacy is the best way to ensure peace.

Roughly three-quarters (76%) of Staunch Conservatives say the best way to ensure peace is through military strength, but only 39% of Main Street Republicans agree. Among the other two groups in the broad Republican coalition, 48% of Libertarians and 40% of Disaffecteds say that military strength is the best way to guarantee peace.

Democrats are more unified in their belief that good diplomacy provides the best way to ensure peace. Majorities in the three core Democratic groups – as well as 76% of Post-Moderns – say that peace is best ensured through effective diplomacy rather than military strength.

There also are differences in opinions about whether using overwhelming military force is the best way to defeat terrorism around the world or whether relying too much on military force creates hatred that leads to more terrorism. Fully 88% of Staunch Conservatives say that overwhelming force is the best way to defeat terrorism. A narrow majority (53%) of Main Street Republicans agree as do 48% of Libertarians and 45% of Disaffecteds.

As is often the case, Solid Liberals express the opposite view from Staunch Conservatives: 90% say that relying too much on the use of force creates hatred that leads to more terrorism. Smaller majorities of Post-Moderns (69%), New Coalition Democrats (57%) and Hard-Pressed Democrats (52%) express this view.

Section 3: Demographics and News Sources

The nine typology groups differ not just in the defining components of the typology—their values and attitudes—but also in their demographic makeup. In many cases, groups with similar ideological and political interests are fundamentally different when it comes to demographics, while other groups with differing beliefs share key demographic markers.

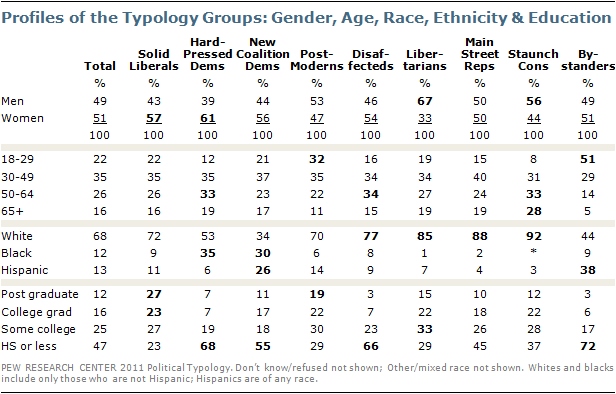
Staunch Conservatives stand out as the oldest group in the typology (61% are 50 or older) and also are the most likely to be married. By contrast, Post-Moderns are distinguished by their youth: 67% are younger than 50, including 32% who are younger than 30. (Bystanders, who are defined by characteristics strongly associated with age, also are very young—80% are younger than 50.) And while Libertarians are overwhelmingly male (67%), Hard-Pressed Democrats (61%) and Solid Liberals (57%) are majority female.

Though there is little racial or ethnic variation among Republican groups (each is three-quarters or more white non-Hispanic), Democratic groups differ considerably in their ethnic composition. Solid Liberals are overwhelmingly white (72%), while Hard-Pressed Democrats are more racially mixed—53% are white and 35% are African American. New Coalition Democrats are majority-minority: 34% white, 30% black and 26% Hispanic. This group also consists of more first- or second-generation Americans than most other groups: 29% of New Coalition Democrats are either themselves immigrants or are the children of immigrants. Overall, 18% of Americans say they are immigrants or children of immigrants.

Educational experiences of groups within the same partisan coalitions also are varied. For instance, half of Solid Liberals (50%), the most educated group, have college degrees. They are joined in the Democratic base by one of the groups with the least amount of educational experience, Hard-Pressed Democrats (68% of whom have a high school degree or less). And the two Republican-oriented independent groups are another study in contrasts when it comes to education—66% of Disaffecteds have no more than a high school education, while 70% of Libertarians have attended at least some college.

Where They Live

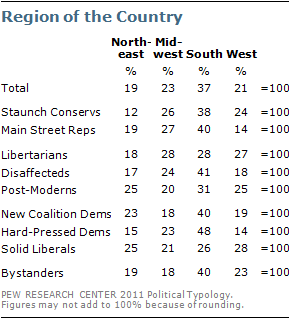
Individuals from all typology groups can be found in regions and communities across the country, but some groups are more concentrated than others. For example, Hard-Pressed Democrats are particularly likely to live in the South (48% live there), while very few Staunch Conservatives can be found in the Northeast (just 12% live there).

Most Solid Liberals (53%) live in either the Northeast or the West, as do half (50%) of Post-Moderns (compared with 40% of the public overall). Fully two-thirds (67%) of Main Street Republicans live in either the Midwest or the South; few live in the West (14%).

Four-in-ten (40%) Solid Liberals live in urban areas, significantly more than any group other than New Coalition Democrats (35% urban) and Bystanders (34%). Hard-Pressed Democrats are the Democratic group most likely to be found in rural areas (where 23% live). And Post-Moderns are the only majority suburban group – 58% live in suburban areas.

Religion and the Typology Groups

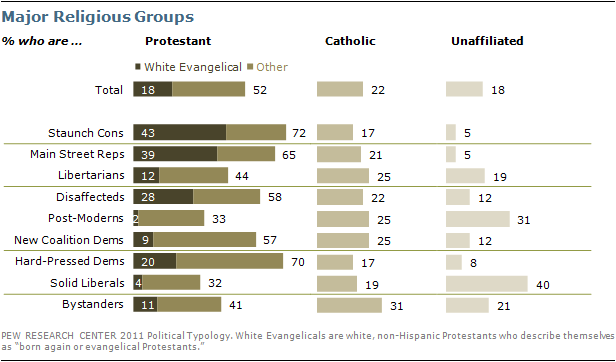
Just more than half of Americans say they are Protestants (52%), but substantially more Staunch Conservatives (72%), Main Street Republicans (65%) and Hard-Pressed Democrats (70%) are Protestants. Solid Liberals, Post-Moderns and Libertarians are less likely than the general public to be Protestant.

Roughly 18% of Americans are white evangelical Protestants, but this doubles to roughly four-in-ten of the two core Republican groups. The Republican-leaning Disaffecteds also are more likely to be white evangelicals than the general public, but this does not hold true for Libertarians, just 12% of whom are white evangelicals.

Very few Solid Liberals (4%) or Post-Moderns (2%) are white evangelical Protestants. Instead, these two groups are the most likely to be religiously unaffiliated (atheist, agnostic, or no religious affiliation) – 40% of Solid Liberals and 31% of Post-Moderns, compared with 18% of Americans overall.

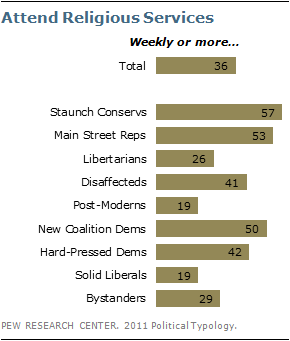
Accordingly, these groups also are the least likely – along with Libertarians – to attend religious services regularly. Just 19% of Solid Liberals and Post-Moderns, and 26% of Libertarians do so. In contrast, Staunch Conservatives (57%), Main Street Republicans (53%) and New Coalition Democrats (50%) stand out for their high levels of religious attendance.

Voting and Political Activity

Voter registration rates are particularly high among Staunch Conservatives (93% say they are registered to vote) and Main Street Republicans (90%). Two Democratic groups (Hard-Pressed Democrats and Solid Liberals) also have high levels of registration; New Coalition Democrats are less likely than other Democrats to be registered (just 71% are registered). Among the independent groups, Disaffecteds are the least likely to be registered (75%).

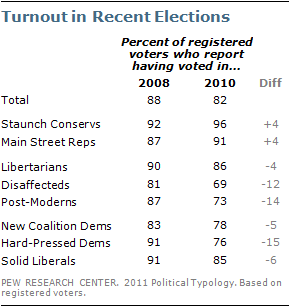
But even among those who are registered, groups differ in their voting rates in recent elections. Nearly all Staunch Conservatives (96%) and 91% of Main Street Republicans who are registered to vote say they voted in the 2010 midterms, on par with reported turnout in the 2008 presidential election. Solid Liberals turned out at similar rates to Staunch Conservatives in 2008, but in 2010 their participation rates lagged behind those of their ideological opposites.

Lower turnout rates in 2010 compared with 2008 were seen among Hard-Pressed Democrats, Disaffecteds, and Post-Moderns.

Though different in nearly every aspect of their political beliefs, Solid Liberals and Staunch Conservatives together stand out as the most politically attentive and active typology groups.

Three-quarters of Staunch Conservatives (75%), two-thirds of Libertarians (67%) and about six-in-ten Solid Liberals (61%) say they follow what is going on in government and public affairs most of the time. Nearly four-in-ten (37%) Solid Liberals and 32% of Staunch Conservatives say they have participated in a political campaign, meeting, or rally over the past five years, far more than in other typology groups.

News Habits of the Typology Groups

Pew Research Center news consumption studies have consistently found that television remains the most widely used source of news about national and international events. In the current survey, 43% say they regularly watch network evening news, 30% say they regularly watch Fox News Channel, 24% say they regularly watch CNN and 16% report regularly watching MSNBC. The typology groups have sharply different TV news preferences.

Staunch Conservatives stand out for their use of Fox News for much of their news consumption. Roughly half (54%) say they regularly watch Fox News, and 81% watch at least sometimes. Staunch Conservatives are among the least likely to regularly watch Fox News’ competitors: CNN (8%) and MSNBC (6%).

By comparison, about four-in-ten of those in the other Republican and Republican-leaning groups watch Fox News regularly, though not nearly as exclusively, as a number also watch the other cable channels, as well as network evening news, regularly.

CNN is most popular with Hard-Pressed Democrats (44% watch regularly), many of whom also watch Fox News (35%). New Coalition Democrats and Post-Moderns are more varied in their cable news diets: Those in these groups are about equally likely to watch CNN or Fox News but are somewhat less likely to watch MSNBC. About a quarter of Solid Liberals say they are regular CNN viewers (27%), while 19% say they regularly watch MSNBC and 11% say they watch Fox News regularly.

While half-or-more Hard-Pressed Democrats (61%), Disaffecteds (52%) and Main Street Republicans (51%) say they regularly watch the nightly network news on CBS, ABC, or NBC, far fewer Solid Liberals (38%), Post-Moderns (38%), Bystanders (35%), Libertarians (35%) or Staunch Conservatives (30%) get regular news from the broadcast networks’ flagship news programs. Almost half of New Coalition Democrats (47%) say they regularly watch evening network news.

That just 30% of Staunch Conservatives regularly watch the “big three” newscasts is particularly noteworthy because of their age profile. The network news audience is relatively older than other news audiences, and Staunch Conservatives are the oldest typology group.

About one-in-six (16%) Americans regularly get their news from NPR. Solid Liberals (34% regularly listen) and New Coalition Democrats (25%) stand out for their reliance on NPR. Notably, 17% of Republican-leaning Libertarians also are regular listeners. By comparison, relatively few Hard-Pressed Democrats (6%) and Staunch Conservatives (8%) listen to NPR regularly.

Local daily newspapers are a regular source of news for about half in most typology groups. New Coalition Democrats diverge significantly from other groups; just 34% regularly read a daily paper. And Solid Liberals read The New York Times at higher rates than other groups; 18% say they are regular readers. By contrast, just 1% of Staunch Conservatives, and 1% of Libertarians, say they read the Times regularly.

Some of the broadest gulfs between typology groups in terms of media consumption can be found for specific programs. Staunch Conservatives are more than twice as likely as any other typology group to say they regularly watch or listen to Glenn Beck (23%) and Rush Limbaugh (21%). At the same time, 21% of Solid Liberals and 14% of Post-Moderns are regular viewers of the Daily Show with Jon Stewart, the highest percentages among any typology groups.

Social Networking

About six-in-ten Post-Moderns (63%) and Solid Liberals (60%) use social networking sites like Facebook or Twitter, as do 56% of Libertarians.

Typology groups with higher proportions of older people, particularly the less affluent Hard-Pressed Democrats, are less likely to use these sites (just 34% of Hard-Pressed Democrats are social networkers).

Section 4: The Recession, Economic Stress and Optimism

The Great Recession has had a major impact on certain segments of the political typology. The varying levels of financial stress that different groups face play a role in shaping their views on issues and policy debates. Beyond the recession’s tangible impact, there are differences in the economic outlook of different segments of the electorate. New Coalition Democrats were hit hard by the recession, but remain fundamentally upbeat about their personal financial situation and future. Others, like the Disaffecteds and Hard-Pressed Democrats, have a far more skeptical outlook.

Financial Stress and the Recession

Disaffecteds, Hard-Pressed Democrats and New Coalition Democrats stand out from the other groups in their level of personal financial stress. Fully 83% of Disaffecteds, 68% of Hard-Pressed Democrats, and 57% of New Coalition Democrats say they often don’t have enough money to make ends meet. The other groups do not generally struggle to make ends meet. Two-thirds or more in the five other typology groups say paying the bills is generally not a problem.

In particular, the predominantly independent Post-Moderns have emerged from the recession largely unscathed. Only 15% of Post-Moderns say the recession had a major effect on their finances that they have not yet recovered from, well below the 40% of Americans overall who say this. Four-in-ten Post-Moderns say they have mostly recovered from the recession, and 44% say the recession didn’t really have a major effect on their financial situation.

Two of the groups were hit particularly hard by the recession and are still struggling. Majorities of Disaffecteds (63%) and Hard-Pressed Democrats (53%) say the recession had a major effect on their personal economic situation and their finances have still not recovered. Further evidence of the recession’s impact on these typology groups is in their reported experiences with unemployment; 71% of Disaffecteds and 63% of Hard-Pressed Democrats say they or someone else in their household has been out of work and looking within the past year.

While most New Coalition Democrats live on tight budgets, and more than half have faced unemployment in their household this past year, they are far less likely than these other financially pressed groups to see the recession as a major factor. Just 41% – about the national average – say the economy had a major effect on their finances that they haven’t recovered from. Most say they either got through the recession unscathed (40%) or were hit hard but have recovered (16%).

Income and Employment

Roughly half of Disaffecteds, New Coalition Democrats and Hard-Pressed Democrats have household incomes below $30,000 a year. Fewer than a quarter in any of the other five groups are in this income range.

But the employment situation across the three lower-income groups differs widely. Just 36% of Hard-Pressed Democrats are currently employed – fewer than in any other typology group; one-in-five (21%) are currently unemployed and looking for work. By comparison, roughly half in the other financially stressed typology groups – the New Coalition Democrats and Disaffecteds – are working. Libertarians and Post-Moderns have the highest employment levels among typology groups, with roughly two-thirds of each group currently working.

The Optimism Gap

While three of the typology groups – Disaffecteds, Hard-Pressed Democrats and New Coalition Democrats – face significantly higher economic stress than the others, what sets New Coalition Democrats apart is their financial optimism. About a third (35%) of New Coalition Democrats say they currently have enough income to lead the kind of lives they want, compared with just 10% of Disaffecteds and 19% of Hard-Pressed Democrats. This contrast is just as stark in terms of pessimism about the future: Roughly half of Disaffecteds (51%) and Hard-Pressed Democrats (47%) say that they will probably never have enough income to lead the kind of lives that they want. Only a quarter (26%) of New Coalition Democrats are so pessimistic.

Half or more in each of the five typology groups with higher household incomes say that they currently have enough income to live the kind of life they want. Among these groups, Post-Moderns are the most optimistic about their long term economic outlook. Three-in-ten (30%) Post-Moderns say they will someday have enough income to live the kind of life they want; while just 15% say they won’t have enough in the future. Among the other four groups, this balance is more even, if not negative.

The American Dream

A majority of the public (62%) says most people can get ahead if they’re willing to work hard while 34% say hard work and determination are no guarantee of success. A clear majority of the core Republican groups as well as Libertarians and Post-Moderns think that most people can get ahead if they are willing to work hard.

New Coalition Democrats also are more likely than Hard-Pressed Democrats and Disaffecteds to say that people who work hard can get ahead. By a two-to-one margin more New Coalition Democrats say people can get ahead if they work hard (64%) than say hard work and determination do not guarantee success (32%). Hard-Pressed Democrats and Disaffecteds have a much more divided view with only about half saying hard work can guarantee success.

Solid Liberals are among the most skeptical that everyone has it in their power to succeed in life. Half say hard work and determination are no guarantee of success, while 45% say most people can get ahead if they are willing to work hard.

Section 5: Views of Government, Constitution, American Exceptionalism

The public continues to favor smaller government and remains critical of government performance. However, some of the anger at government that was evident during the 2010 election campaign has subsided.

Overall, 50% say they want a smaller government providing fewer services, while 42% say they would rather have a bigger government providing more services. A majority (55%) also says the government is almost always wasteful and inefficient, compared with 39% who think that government often does a better job than people give it credit for.

Not surprisingly, feelings about government divide sharply along party lines, yet there are substantive divisions within the two parties’ broad electoral coalitions as well. And while preferences about the scope of government often correlate with beliefs about the efficiency of government, this is not always the case.

Divergent Perspectives on Government

Most groups on the right (Staunch Conservatives, Main Street Republicans, and Libertarians) both want to see the size of government shrink and say government is almost always wasteful. Conversely, most Solid Liberals and New Coalition Democrats say they would rather have a bigger government providing more services, and say that government often does a better job than people give it credit for.

In contrast to other groups in the Republican constituency, however, Disaffecteds are more divided on the question of size of government. Like other Republican-oriented groups, they overwhelmingly say the government is nearly always wasteful and inefficient (73%). But when it comes to the size of government, they are nearly as likely to favor bigger government as smaller government (42% vs. 50%).

These questions also highlight some key distinctions between Hard-Pressed Democrats and other Democratic groups. In stark contrast to these other groups, about two-thirds of Hard-Pressed Democrats (68%) say the government is wasteful, and while a slim majority favors a bigger government (53%), they are more divided about government’s size than their co-partisans.

Among Democratic and Democratic-leaning groups, Post-Moderns are the only one in which a majority (55%) favors a smaller government providing fewer services. However, Post-Moderns are not highly critical of government performance: 50% say the government often does a better job than people give it credit for while 45% say it is almost always wasteful and inefficient.

Most Groups Distrustful of Government

The anger with government that marked the tone of the 2010 elections has ebbed to some extent: Currently, 14% say they are angry with the federal government, down from 23% in September 2010. (See “Fewer Are Angry at Government, But Discontent Remains High,” March 3, 2011.)

Still, high percentages across all typology groups say they are distrustful of government. Levels of trust vary considerably across the typology. While Post-Moderns are no fans of bigger government, they are relatively trusting: They are the only group in which nearly half (46%) say they trust the government in Washington to do what is right always or most of the time.

At the other extreme, nearly all Staunch Conservatives (97%) say they trust the government only some of the time or never. Trust in government is also relatively low among other groups on the right: Just 14% of Libertarians and 19% of Disaffecteds trust the federal government always or most of the time. Main Street Republicans’ views of government are somewhat less negative, but only 28% say they trust the government at least most of the time.

On the left, Hard-Pressed Democrats diverge from other Democratic groups in their relatively low level of trust in the federal government; 25% trust government most or all of the time, compared with 40% of New Coalition Democrats and 38% of Solid Liberals.

Feelings about the federal government follow a similar pattern, with Staunch Conservatives significantly more likely than any other group to say they are angry with the federal government (32% say this). At the same time Post-Moderns, New Coalition Democrats and Solid Liberals are the most likely to say they are basically content with the federal government (about a third of each group says this). Hard-Pressed Democrats are distinguished from other Democratic groups by their lower levels of contentment with the government.

Negative Views of Politicians, Congress

As a whole, Americans are cynical about elected officials, with most saying politicians don’t care what average Americans think (69%) and that they lose touch with voters back home quickly (72%). As with trust and anger, most Democratic and Democratic-leaning groups are less cynical than the Republican groups. There are few significant differences across the Republican and Republican-leaning groups.

There is broad agreement about Congress – most groups view it negatively. Across seven of the eight groups, clear majorities give the institution an unfavorable rating. New Coalition Democrats are an exception in their slightly more favorable opinions; they are about equally likely to have a favorable (42%) as an unfavorable (44%) view of Congress.

The intensity of negative opinions of Congress varies across groups. Main Street Republicans are more temperate in their criticism than other groups on the right; 16% have a very unfavorable impression of Congress compared with a quarter or more of those in the other three Republican and GOP-leaning groups.

Among groups on the left, Hard-Pressed Democrats are the most likely to have very unfavorable views of Congress (27% compared with 17% or less among the other three Democratic and Democratic leaning groups).

Compromise Finds Little Support on the Right

Solid majorities in six of the eight typology groups say they prefer elected officials who stick to their positions over those who make compromises with people they disagree with. Not surprisingly, this is the overwhelming view of Staunch Conservatives who favor politicians with conviction over those who compromise by a 79%-to-17% margin.

In pronounced contrast to other groups, clear majorities of both Solid Liberals (70%) and Post-Moderns (60%) say they prefer politicians willing to compromise over those who stick to their positions.

Approach to the Constitution

While Americans as a whole are divided over whether the Supreme Court should base its rulings on what the Constitution means in current times (50%) or what it meant as originally written (45%), most typology groups have a clear preference for one of these approaches.

To varying degrees, all Republican and Republican-leaning groups favor an originalist approach. By more than eight-to-one, Staunch Conservatives say the Court should base its rulings on its understanding of the Constitution as originally written (88% vs. 10%). Most Main Street Republicans (64%) and Libertarians (70%) also clearly favor this position, although with less consensus. Disaffecteds are somewhat more divided; 55% favor an originalist approach while 36% say the Court should base its rulings on current understanding.

On the Democratic side of the political spectrum, Solid Liberals are the strongest proponents of the Court basing its rulings on its understanding of what the Constitution means in current times (81% say this; just 15% favor an originalist approach). The Democratic-leaning Post-Moderns also overwhelmingly favor interpreting the Constitution in the context of current times (70% vs. 27% originally written). New Coalition and Hard-Pressed Democrats are more divided. Slim majorities of both groups say the nation’s highest court should base its decisions on current understanding of the Constitution.

American Exceptionalism

The view that the United States is a great nation is widely held across all typology groups. About nine-in-ten Americans say the United States either stands above all other countries in the world (38%) or is one of the greatest along with some others (53%). Just 8% say there are other countries that are better than the U.S.

But Staunch Conservatives differ from other typology groups in their view that the United States is superior to all other countries. Two-thirds of Staunch Conservatives (67%) say the U.S. stands above all other nations; they are the only group in which a majority expresses this view.

Smaller percentages of Solid Liberals (19%) and Post-Moderns (27%) than those in other groups say the U.S. stands above all other countries. Still, majorities in both groups (62% of Solid Liberals and 65% of Post-Moderns) say the U.S. is one of the greatest countries along with some others.

For the most part, the public believes that as Americans we can always find ways to solve our problems and get what we want; 57% express this view. About four-in-ten (37%) say this country cannot solve many of its important problems.

Most groups are optimistic about Americans’ abilities to solve their problems, but Disaffecteds are particularly pessimistic: 56% say Americans cannot solve their problems while 37% say they can. Hard-Pressed Democrats also stand out; they are about equally likely to say that Americans cannot solve their problems (48%) as to say they can (44%).

Section 6: Obama, 2012, and the Tea Party

The typology groups divide sharply along partisan lines in their views of Barack Obama. The core Republican groups and GOP-oriented independent groups are highly critical of Barack Obama and would prefer to see a Republican defeat him next year. Democratic and Democratic-leaning groups largely support the president and favor his reelection.

Opinions about some other political matters are less clear-cut. At this early stage in the Republican nomination contest, there is no clear favorite among any of the GOP typology groups. And the Republican groups’ views of the Tea Party are far from uniform: The Tea Party draws extensive support from Staunch Conservatives, but that is the only typology group in which a majority agrees with the Tea Party.

Polarized Views of Obama

Nearly all (97%) Staunch Conservatives say they disapprove of Barack Obama’s job performance, with the vast majority (84%) saying that they disapprove strongly. Main Street Republicans are also critical of Obama, but this group’s disapproval is less pronounced – 65% disapprove, including a slim majority (51%) who do so strongly. About a quarter (27%) of Main Street Republicans approve of the job Obama is doing.

Notably, more Republican-leaning Libertarians (76%) than Main Street Republicans (65%) disapprove of the way Obama is handling his job. Disaffecteds are the group most divided in their assessments; this Republican-leaning independent group disapproves of Obama by about two-to-one (57% to 28%).

Obama’s strongest support can be found among two of the core Democratic groups: Solid Liberals (90% approve) and New Coalition Democrats (83% approve). Nonetheless, there is far more intense opposition to Obama on the right than there is strong support for him on the left. Whereas 84% of Staunch Conservatives say they strongly disapprove of the way Obama is handling his job, a more modest 64% of Solid Liberals strongly approve.

Hard-Pressed Democrats also approve of Obama’s job performance, but are more muted in their assessments (69% approve, 55% strongly). Nearly two-thirds of Post-Moderns (65%) approve of Obama’s job performance and 35% strongly approve.

Looking Ahead to 2012

In the 2012 presidential race, Barack Obama holds a 47%-to-37% lead over a generic Republican opponent among all registered voters, and preferences largely mirror Obama’s overall job approval ratings. A year-and-a-half ahead of Election Day, nearly every group either solidly backs or opposes Obama by substantial margins.

Solid Liberals are Obama’s strongest supporters: 95% say they would like to see the president reelected. Obama also enjoys overwhelming support from the other majority Democratic groups (78% among Hard-Pressed Democrats and 75% among New Coalition Democrats), and substantial support among the Democratic-leaning Post-Moderns (60% reelect Obama, 16% prefer a Republican).

Staunch Conservatives support a generic GOP candidate by about as wide a margin as Solid Liberals back Obama; 91% support a Republican candidate. Somewhat smaller majorities of Main Street Republicans (73%) and Republican-leaning Libertarians (70%) also prefer a Republican over Obama. The GOP-oriented Disaffecteds favor a GOP nominee over Obama by roughly two-to-one (48% vs. 22%).

In most cases, these early 2012 preferences mirror the way each of these groups voted in the Obama-McCain matchup in 2008. For example, Staunch Conservatives backed McCain over Obama by 87% to 1%, while Solid Liberals backed Obama over McCain by 87% to 2%. (For more on how typology groups voted in recent elections, see Section 1: The Political Typology.)

But there is one key independent voting bloc that has moved more firmly into the Republican camp since 2008: Libertarians. This group backed McCain over Obama by a 39-point margin in 2008 (53% to 14%), but prefer a generic Republican over Obama today by a 63-point margin (70% to 7%).

Evaluating the Possible GOP Field

In the race for the GOP nomination, several of the leading Republican contenders fare well across most –but not all – GOP groups. Mitt Romney’s weakest support is among Disaffecteds, while Libertarians are less likely than other groups to back Mike Huckabee or Sarah Palin. Newt Gingrich does his best among Staunch Conservatives but his support wavers within other groups; and support for Ron Paul is concentrated among Libertarians.

While Staunch Conservatives are the most firmly committed to voting Obama out of office, they have yet to agree on a preferred candidate: 22% say Huckabee would be their first choice, 20% Romney, 18% Gingrich, and 13% Palin. Palin and Gingrich garner less support among Main Street Republicans, 24% of whom name either Romney or Huckabee as their preferred nominee at this point.

To win in 2012, a Republican nominee will need to reach beyond these base groups and appeal to the Republican-leaning Libertarians and Disaffecteds as well. No GOP candidate at this point has broad appeal among both of these voting blocs. Romney leads among Libertarians (27% first choice), with Ron Paul also garnering significant support. By comparison, Disaffecteds prefer Palin or Huckabee over Romney and other potential Republican candidates.

Views of Tea Party

The Tea Party elicits strong reactions from the typology groups at either end of the spectrum: 72% of Staunch Conservatives agree with the Tea Party, while 67% of Solid Liberals disagree.

Among other groups, opinions about the Tea Party are more mixed. This is the case even among other Republican and GOP-leaning groups: the Tea Party draws support from fewer than half of Libertarians (44%) and Main Street Republicans (32%), and very few Disaffecteds (19%), who were a critical component of the GOP’s 2010 victory.

Aside from Solid Liberals, most of those in the other Democratic and Democratic-oriented groups express no opinion of the Tea Party. Among those who do, the balance is much more negative than positive.

Presidential Favorability

When it comes to opinions of Barack Obama, George W. Bush and Bill Clinton, the clearest differences across typology groups fall out along partisan lines, with views of Barack Obama and George W. Bush particularly polarized. Notably, Democratic and Democratic-leaning groups view Obama and Clinton similarly, while Republican and Republican-leaning groups have more positive views of Clinton than they do of Obama.

Staunch Conservatives and Solid Liberals stand out for their diametrically opposed opinions about Obama and Bush. While about nine-in-ten Solid Liberals view Obama (93%) favorably, just 7% have a favorable opinion of Bush. Conversely, 84% of Staunch Conservatives rate Bush highly and only 7% have a favorable view of Obama. Clinton performs slightly better among Staunch Conservatives (26% favorable); still, he garners his lowest ratings from this group.

Main Street Republicans and Libertarians have less positive views of Obama than Clinton. In each group, about a quarter view Obama favorably, while roughly half view Clinton favorably. Large majorities of Main Street Republicans (77%) and Libertarians (67%) view Bush favorably.

Although Obama does better among Disaffecteds than among other groups in the Republican coalition, just 35% of Disaffecteds have a favorable opinion of the president. By comparison, six-in-ten (60%) view Clinton favorably and 52% have a positive opinion of Bush.

Both Obama and Clinton are seen positively by three-quarters or more of Post-Moderns, New Coalition Democrats and Hard-Pressed Democrats. About three-in-ten Post-Moderns (31%) and New Coalition Democrats (29%) view Bush positively. Hard-Pressed Democrats are more negative toward Bush: Just 18% give him a favorable rating.

Michelle Obama

As they have for the last two years, Americans continue to view Michelle Obama positively: 69% have a favorable opinion, 21% an unfavorable one. But among the typology groups, there is one group – Staunch Conservatives – in which opinion runs the other way. Just 22% of Staunch Conservatives view Michelle Obama favorably, while 68% say they have an unfavorable opinion, including 43% who say they have a very unfavorable opinion. Among each of the other Republican and Republican-leaning groups, only about half as many offer an unfavorable opinion of the first lady.

Nearly all (96%) Solid Liberals rate Michelle Obama positively, and 61% say their opinion is very favorable. Positive views are also prevalent among Hard-Pressed Democrats, New Coalition Democrats, and Post-Moderns (83% of each group favorable).

Obama’s Birthplace

Controversy about Barack Obama’s birthplace, a subject of continued media attention, divides many of the typology groups. When asked if Obama was born in the United States or in another country, nearly a quarter (23%) say the latter. This includes nearly half (47%) of Staunch Conservatives, and about a third of both Main Street Republicans (35%) and Disaffecteds (34%).1

But misunderstandings about Obama’s birthplace are not limited to those who oppose him politically. In fact, 24% of New Coalition Democrats, and 21% of Hard-Pressed Democrats also say Obama was born in another country. Only among Solid Liberals is there uniform clarity about Obama’s birthplace: 95% say he was born in the United States, and less than 1% say elsewhere.

The fact that confusion about Obama’s origins exists beyond those who dislike him is apparent in the views of those who say he was born in another country. Nearly three-in-ten (29%) people who say Obama was not born in the United States approve of the job he is doing as president, and roughly a quarter (23%) say they would like to see him reelected in 2012.

Rating the Parties

Not surprisingly, the two core Republican groups and the three core Democratic groups mostly confer positive ratings on their own party while rating the opposing party negatively. Though more muted, views within the independent groups also reflect underlying partisan leanings.

Three-quarters or more of both Staunch Conservatives (81%) and Main Street Republicans (75%) have favorable opinions of the GOP. Views of the Democratic Party among both groups are clearly negative, but Main Street Republicans are slightly less critical (14% favorable vs. just 1% favorable among Staunch Conservatives).

Within independent groups, about six-in-ten Libertarians (62%) and Disaffecteds (59%) have a positive opinion of the GOP. But just 6% of Libertarians have a very favorable opinion of the Republican Party compared with 17% of Disaffecteds. While few in either group give the Democratic Party good ratings, Democrats fare better among Disaffecteds (25% favorable vs. 12% of Libertarians). The Democratic-leaning Post-Moderns have a largely favorable view of the Democratic Party (58%), while just 25% view the GOP favorably.

Among each of the three core Democratic groups, about eight-in-ten hold favorable views of the Democratic Party. But Hard-Pressed Democrats are more likely than Solid Liberals to give the highest marks to their party (36% very favorable vs. 21% very favorable). Few among any of these groups have a positive assessment of the GOP, but Solid Liberals are more negative toward the opposition party than are those in either of the other core groups.

Section 7: The Budget Deficit, Taxes, Spending and Entitlements

With Republicans winning a majority in the U.S. House of Representatives on a wave of anti-government sentiment, the political focus in Washington has turned to government spending and deficit reduction. Yet while most Americans agree that deficit reduction should be a top priority this year, it is not universally seen as the most pressing economic problem. In particular, since the impact of the recession was not felt evenly across the typology groups, those who are still struggling to get back on their feet see the job situation and inflation as bigger concerns.

And there are even more substantial gaps over how deficit reduction should be pursued, both across party lines as well as within the partisan coalitions. On the right, there is an alignment of opinion between Staunch Conservatives and Libertarians that deficit reduction is the priority, and dramatic cuts, including changes to entitlement programs, should be the focus. But Main Street Republicans are less enthusiastic about these changes, and more willing to see tax increases included in a plan to reduce the deficit. Disaffecteds, who were a critical factor in the 2010 GOP gains, are even more deeply skeptical of deep spending cuts and entitlement reform, and both Main Street Republicans and Disaffecteds see little difference between the Republican Party and Obama when it comes to offering a deficit-reduction plan.

On the left there is more consensus that jobs and prices are a bigger worry than the deficit, with Solid Liberals, in particular, expressing the view that deficit reduction is not a top public policy priority this year. And while Democratic-oriented groups tend to agree that any deficit solution will need to include a combination of spending cuts and tax increases, they differ over whether the cuts should focus on domestic or defense spending, and how willing they are to see taxes rise. One stand-out group is the Democratic-leaning Post-Moderns, who are far more supportive of across-the-board spending cuts than most core Democratic groups, and see little difference between Obama and the GOP in terms of who is offering the best approach to the issue.

More Concern about Jobs and Prices than Deficit

While most see addressing the deficit as a top priority, concern about jobs and prices remains more widespread among the general public. In fact, only among Staunch Conservatives and Libertarians do even half rate the budget deficit as the economic issue that worries them most (50% and 49%, respectively). While 34% of Main Street Republicans rate the deficit as their top concern – which is higher than the national average – about half cite either jobs (24%) or rising prices (26%) as their top concern.

Not surprisingly, given how hard they were hit by the recession, Disaffecteds are mostly concerned about the job situation (43%) and rising prices (36%) – just 9% cite the deficit as their top concern. Similarly, nearly as many Hard-Pressed Democrats say the job situation (33%) worries them most as say rising prices (42%). New Coalition Democrats and Solid Liberals are more worried about the job situation than other national economic issues (42% and 46%, respectively).

Reducing the Budget Deficit

Nearly two-thirds (64%) of Americans say that the best way to reduce the federal budget deficit would include a combination of both cutting major programs and increasing taxes. Just 20% say the focus should be mostly on spending cuts, and just 6% say it should be mostly on tax increases.

Staunch Conservatives are the only group where a majority (59%) says the approach to deficit reduction should focus mostly on cutting major programs. Nearly half (47%) of Libertarians agree that spending cuts should be the focus, while about as many (45%) think a combination of cuts and tax hikes are in order. Clear majorities in all other groups say the best way to reduce the deficit is through a combination of cutting major programs and increasing taxes.

At the other end of the spectrum, the only group where a substantial number want to see a focus on tax increases is Solid Liberals. But even here only 23% are of this opinion, while 70% believe a combination of spending cuts and tax increases should be the focus.

Spending, Entitlements and Taxes

While most Americans are willing to accept that tax increases may need to be part of a successful deficit reduction strategy, few explicitly favor tax hikes when offered as a specific option. While 61% of Americans favor lowering domestic spending as a way to reduce the budget deficit and 49% favor reducing defense spending, only 30% say they are in favor of raising taxes to reduce the deficit. And changes to Social Security and Medicare are equally unpopular (30% favor).

The ideological ends of the typology have strong opinions about deficit reduction. Staunch Conservatives overwhelmingly favor domestic spending cuts, and nearly half favor changes to entitlement programs as well. And they are overwhelmingly opposed to cutting defense spending and raising taxes. By contrast, Solid Liberals overwhelmingly favor defense cuts and tax increases, and oppose changing entitlements and cutting domestic spending.

Beyond these ideological extremes, there are widely diverse views on deficit reduction strategies. In keeping with the priority they place on the issue, Libertarians are open to nearly all approaches, except tax hikes. They align with Staunch Conservatives on domestic spending cuts (80% favor) and changes to Social Security and Medicare (56% favor), but nearly half (48%) also support cuts to defense spending. Main Street Republicans are substantially less committed to some of the GOP deficit reduction strategies – with 68% backing domestic spending cuts and 32% in favor of changes to entitlements.

Post-Moderns, too, back a relatively broad array of deficit strategies. They are the only group in which a majority backs both domestic and defense spending cuts (67% favor each), and a relatively high 40% favor increasing taxes as well.

On the left, both Hard-Pressed and New Coalition Democrats differ substantially from Solid Liberals in how they would like to see the deficit addressed. More than half of each supports domestic spending cuts, which a broad majority of Liberals oppose, and conversely where Solid Liberals overwhelmingly favor tax increases, both other Democratic groups overwhelmingly oppose this.

And reflecting their economic stress and the low priority they place on the issue, Disaffecteds offer relatively little support for any of the deficit reduction strategies tested compared with the general public.

Who Has a Better Approach?

The prevailing view, held by 52% of Americans, is that neither Obama nor Republicans in Congress have a clearly better approach to dealing with the federal budget deficit. The survey was conducted before the mid-April shutdown debate and before the release of deficit reduction plans by Rep. Paul Ryan and President Obama.

This is the opinion not only of predominantly independent groups like Disaffecteds and Post-Moderns, but also the view of 57% of Main Street Republicans and 63% of Hard-Pressed Democrats.

On the right, only Staunch Conservatives clearly believe the Republican approach to deficit reduction is better (73%). Many Libertarians (43%) agree, though they are equally likely to say there is no difference (49%). On the left, only among Solid Liberals does a majority (58%) say Obama has the better approach to deficit reduction.

By roughly two-to-one (34% to 18%) more Americans think making major cuts in government spending this year would hurt, rather than help, the job situation, with another 41% saying spending cuts won’t affect jobs. Only Staunch Conservatives are more likely to say that spending cuts will help the job situation than hurt it. By contrast, Solid Liberals are the only group where a plurality says that spending cuts will hurt the job situation.

But Solid Liberals are not the only ones to think that, if there is an effect, spending cuts would do more harm than good with respect to jobs. Among both Hard-Pressed and New Coalition Democrats, as well as among the predominantly independent Post-Moderns and Disaffecteds, at least twice as many say major spending cuts will hurt the job situation than say such cuts will help.

Section 8: Domestic Issues and Social Policy

Across a range of social policy and domestic issues, the broader Republican and Democratic coalitions often find themselves at odds – and, at times, poles apart. But there are also notable divides within coalitions on issues such as abortion, marijuana, and energy. And while less common, consensus across groups also emerges on some questions of social and domestic policy.

Health Care Law

Not surprisingly, the deep divisions over the passage of major health care reform legislation last year are clearly visible in the 2011 political typology groups. Fully 80% of Staunch Conservatives say the health care law passed by Obama and Congress last year will have a mostly bad effect on health care in the U.S., and not a single Staunch Conservative interviewed thinks it will have a good effect. Opinion is nearly as negative among Libertarians, 60% of whom think the health care law will do more harm than good. While about half (47%) of Main Street Republicans also take a negative view of the law, an equal number say the effect of the law will be mixed.

By contrast, there is no comparable unanimity that the law will have a mostly good effect among Democratic groups. Even among Solid Liberals, just 43% say the health care law will have a mostly good effect, while 51% say it will have a mix of good and bad effects on health care in the U.S.

Hard-Pressed Democrats, in particular, are not convinced that the new health care law has clear benefits – a 61% majority says the law will have a mix of good and bad effects on health care in the country, and among the rest, as many say the impact will be mostly bad as mostly good (16% each). Post-Moderns offer, on balance, the same assessment of the law’s impact, while New Coalition Democrats are somewhat more positive – while 56% think the law will have a mixed effect, more say it will make things better rather than worse by a 34%-to-5% margin.

Labor Unions and Wall Street

While more Americans express a favorable view of labor unions (47%) than an unfavorable one (39%), there is a deeply partisan cast to these evaluations. Equally wide majorities in all three core Democratic groups view labor unions favorably, as do about half of the mostly independent Post-Moderns. The vast majority of Staunch Conservatives and Libertarians hold an unfavorable opinion of labor unions, as do about half of Main Street Republicans. The depth of negative sentiment toward unions is particularly notable among Staunch Conservatives. Not only do 74% view them unfavorably, but 44% say they have a “very unfavorable” opinion of labor unions.

The public has a deeply ambivalent view of the impact Wall Street has on the American economy. Overall, 47% say Wall Street hurts the American economy more than helps it while 38% say it helps more that it hurts. Libertarians and Post-Moderns are the only groups where a majority says that Wall Street helps the economy more than it hurts. The groups that are the most likely to say that Wall Street hurts the economy more than it helps are Disaffecteds, Hard-Pressed Democrats and Solid Liberals – a majority in each group expresses this opinion. Views among Staunch Conservatives, Main Street Republicans and New Coalition Democrats are more divided.

The division of opinion on Wall Street’s impact among Staunch Conservatives stands in stark contrast to their overwhelmingly pro-business attitudes more generally. In a separate question, fully 78% of Staunch Conservatives say businesses make a fair and reasonable amount of profit, and Staunch Conservatives, along with Libertarians, are the least likely to say that there is too much power in the hands of large companies these days. (For more on views of business, see Section 2: Value Divides Within Party Coalitions.)
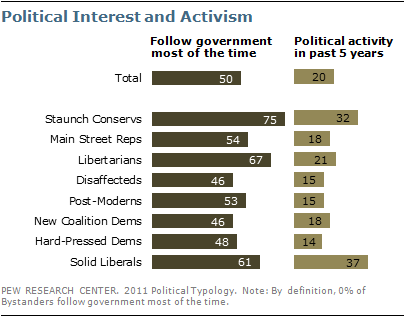
The reverse is true for Post-Moderns, who, along with Libertarians, are one of only two groups who have a predominantly positive view of Wall Street’s impact. Yet Post-Moderns tend to have negative views of business more generally, with 82% believing that large companies hold too much power in this country.

Abortion Divisive

A 54%-majority supports legal abortion in all or most cases, while slightly fewer (42%) say abortion should be illegal in all or most cases. There is agreement in the two predominantly Republican typology groups on this issue, with majorities of both Staunch Conservatives (72%) and Main Street Republicans (64%) saying abortion should be illegal in all or most cases. But the two Republican-leaning independent groups take differing views: Libertarians are more likely to say abortion should be legal in all or most cases (58%) than illegal (38%), while Disaffecteds are divided in their views (48% legal, 43% illegal).
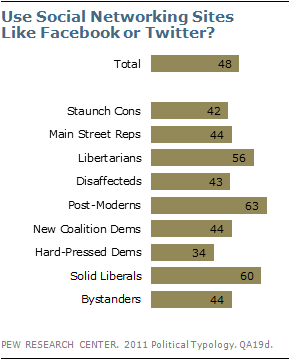
Solid Liberals overwhelmingly support legal abortion in all or most cases (84%), as do three-quarters (75%) of Democratic-leaning Post-Moderns. But Hard-Pressed Democrats (54% legal, 41% illegal) and New Coalition Democrats (40% legal, 51% illegal) are much more divided in their views.

Gay Marriage

Gay marriage divides the public, with 45% in favor of allowing gays and lesbians to marry legally and 46% opposed. And as with abortion, there are significant divisions within the Democratic base, as well as between Republican and Republican-leaning groups.

Only one of the core Democratic groups – Solid Liberals – favors gay marriage (85% to 13%), while most New Coalition Democrats and Hard-Pressed Democrats are opposed (51%-34% and 57%-32%, respectively). The Democratic-leaning Post-Moderns favor gay marriage by a wide 80%-14% margin, aligning themselves with Solid Liberals on this issue.

Broad majorities of both Staunch Conservatives (85% oppose) and Main Street Republicans (72% oppose) oppose gay marriage. By a less one-sided margin, more Disaffecteds also oppose (52%) than favor (34%) gay marriage. Libertarians are divided in their views; as many favor (43%) as oppose (45%) allowing gays and lesbians to marry legally.

Government and Morality

The question of the government’s role in protecting morality in society cuts across partisan typology groups. Overall, 54% of the public says the government is too involved in the issue of morality while 35% say the government should do more to protect morality in society. Just 11 points separate the views of Solid Liberals and Staunch Conservatives on this question; on balance, both groups say the government is too involved in morality (68% and 57%, respectively). Among all three independent-leaning groups, more say the government is too involved in the issue of morality than say it should be doing more to protect morality – including an overwhelming 77% of Libertarians.

By contrast, New Coalition Democrats are the only group in which a greater percentage say the government should to do more to protect morality (54%) than say it is too involved (36%).

Social Trends in Marriage, Family and Religion

In evaluating how three social trends – more gay and lesbian couples raising children, interracial marriage, and the practice of religions other than Christianity – affect the country, the two Republican typology groups show more cohesion than do the three Democratic groups. Staunch Conservatives and Main Street Republicans are united in viewing these changes as either a bad thing for society or as not making much difference – very few call these changes a good thing. Among the Democratic groups, Solid Liberals stand out for being more likely than New Coalition and Hard-Pressed Democrats to call these changes a good thing. In general, the three independent groups say most of these changes do not make much difference in American society.

Roughly a third (35%) of Americans say that the trend of more gay and lesbian couples raising children is a bad thing for American society, 14% say it is a good thing, and a

48%-plurality says this trend doesn’t make much difference. Republican typology groups are united in viewing this change as a bad thing: 71% of Staunch Conservatives say this as do 56% of Main Street Republicans. There is more division among Democratic groups. Solid Liberals are by far the most supportive of this trend – 40% say it is a good thing for society. But among both Hard-Pressed and New Coalition Democrats, far more call it a bad thing for society than a good thing.

As is the case on several other social issues, the predominantly independent Post-Moderns hold views that are more similar to the Solid Liberals than any other typology group. By a 20% to 9% margin, more Post-Moderns think more gay and lesbian couples raising children is good, not bad. Still, an overwhelming 66% say that this trend doesn’t make much difference for American society. Most Libertarians (59%) also say a trend toward gays raising children doesn’t make much difference. Disaffecteds divide between not much difference (49%) and a bad thing for society (40%).

When it comes to more people of different races marrying each other, the predominant view nationwide is neutral. About two-thirds (64%) say this trend does not make much difference for society, 25% call this a good thing and 9% a bad thing. This is the clear majority position across all typology groups –except Solid Liberals. Among that group, as many say this trend is a good thing for American society (47%) as say it doesn’t make any difference (50%). The view that more interracial marriage is good for society is also common among Post-Moderns (36%) and New Coalition Democrats (28%). Notably, four groups, including both of the predominantly Republican groups as well as the Disaffecteds and Hard-Pressed Democrats, are as likely to say a trend toward more racial intermarriage is bad for the country as to say it is a good thing.

About half (51%) of the public say more people practicing religions other than Christianity does not make much difference to American society; 24% call this a good thing, 22% a bad thing. As with other social trends, Solid Liberals stand out in viewing this trend positively: 47% say greater religious diversity is good for American society. But again, both Hard-Pressed and New Coalition Democrats are less optimistic about this trend, with at least as many describing it as bad for the country as good.

Majorities of all three independent groups say more people practicing religions other than Christianity does not make much difference. Among both Staunch Conservatives and Main Street Republicans, more see this as a bad thing for society than a good thing.

Views of Immigration

There is widespread support across most typology groups for both a path to citizenship for illegal immigrants currently in the country and for stronger enforcement of immigration laws and border security.

Majorities in seven of eight typology groups – all except Staunch Conservatives – favor providing a way for illegal immigrants in the U.S. to gain citizenship, if they pass background checks, pay fines and have jobs. Staunch Conservatives are evenly divided – with 49% in favor of a path to citizenship and the same number opposed.

Support for a path to citizenship is stronger among Solid Liberals (94% favor) than other typology groups. Hard-Pressed Democrats express far less support for a path to citizenship than do other groups in the broad Democratic coalition: 61% favor a path to citizenship and 35% are opposed.

While most Americans are open to reforming immigration laws to be more flexible toward illegal immigrants already in the country, the vast majority also supports stronger enforcement of immigration laws and border security. By a 78% to 19% margin, most Americans favor strengthening immigration enforcement.

On this question, Solid Liberals diverge from most other groups: 55% favor stricter enforcement of stronger enforcement of immigration laws and border security, while 43% are opposed.

Hard-Pressed Democrats support stronger enforcement by a wide margin (88% favor, 12% oppose), and as such are more in alignment with Republican groups than other Democratic groups. Most New Coalition Democrats favor stronger enforcement of immigration laws and border security, but their views are less one-sided (65% favor, 24% oppose).

Substantial majorities of Republican and independent typology groups favor stronger enforcement of immigration laws, including 95% of Staunch Conservatives and 93% of Libertarians.

Energy Priorities and Global Warming

Global warming remains a deeply partisan issue, but there is a consensus across six of the eight typology groups that developing alternative energy sources – as opposed to expanding the search for oil, coal, and natural gas – should be the priority for America’s energy supply.

Nearly two-thirds of Americans (63%) say developing alternative sources such as wind, solar and hydrogen technology should be the more important priority for addressing America’s energy supply; 29% say expanding exploration and production of oil, coal and natural gas should be the more important priority.

Staunch Conservatives are the only group in which a majority says expanding oil, coal and natural gas should be the priority; fully 72% say this should be the focus, while just 15% would emphasize alternative energy sources.

The divide within the Republican base is stark on this issue: fully 66% of Main Street Republicans say alternative energy development should be the focus of America’s energy policy, while just 26% would focus on expanding oil, coal and natural gas exploration. In this view, Main Street Republicans agree with the predominantly Democratic groups.

Support for developing alternative energy is particularly strong among Solid Liberals (88%) and Post-Moderns (79%). Libertarians are divided: 44% would focus on alternative energy and 40% on finding more oil, coal and natural gas.

Opinions on global warming are far more polarized, with typology groups hewing to their partisan positions.

Overall, 58% of the public says there is solid evidence that the average temperature on earth has been getting warmer over the past few decades while 34% say there is no solid evidence of warming. Just over a third (36%) say this warming is mostly because of human activity such as burning fossil fuels, while 18% say it is mostly because of natural patterns in the earth’s environment.

Among Democratic typology groups, broad majorities of Solid Liberals (84%), New Coalition Democrats (77%), and Hard-Pressed Democrats (74%) say there is solid evidence that the earth’s average temperature has increased. And more in each group say that this warming is human-caused rather than a result of the earth’s natural patterns. Solid Liberals are much more likely to say this than are New Coalition and Hard-Pressed Democrats (70% vs. 50% and 42%, respectively).

Opinion is the reverse among Staunch Conservatives and Main Street Republicans: Most say that there is no solid evidence of warming (75% and 55%, respectively). Among the minority that does see warming, just 5% and 17% respectively, see this warming as a result of human activity. Republican-leaning Libertarians share this perspective: 63% say the earth is not warming and hardly any say that warming exists and is being caused mostly by human activity (6%).

Disaffecteds are divided in their views: 51% say there is solid evidence of warming, 42% say there is not. Among those who see warming, 29% of Disaffecteds say it is caused by human activity, while 17% say the earth’s natural patterns are the cause. Post-Moderns are nearly twice as likely to say the earth’s temperature is warming (61%) as not (31%); 41% say this warming is human-caused, compared with fewer (17%) who say it is the result of natural patterns.

Views of Gun Control

The public is divided over which is the more important priority: protecting the right of Americans to own guns (48%) or controlling gun ownership (47%). On this question the Republican and Republican-leaning typology groups follow their partisan dispositions and favor protecting the right to own guns; the Democratic and Democratic-leaning groups generally express more support for controlling gun ownership, but display somewhat more variance in opinion across groups.

Overwhelming majorities of both Staunch Conservatives (86%) and Libertarians (77%) say that protecting the right of Americans to own guns is more important than controlling gun ownership. Significant majorities of Main Street Republicans (64%) and Disaffecteds (58%) agree.

Among Democratic groups, broad majorities of Solid Liberals (70%) and New Coalition Democrats (71%) support controlling gun ownership. Hard-Pressed Democrats are more divided: 41% say protecting the right to own guns is more important, 52% say controlling gun ownership. The Democratic-leaning Post-Moderns are similarly divided: 45% say protecting the right to own guns is more important, 54% say controlling gun ownership.

Marijuana Legalization Divides Independent, Democratic Groups

Half of Americans say the use of marijuana should be illegal, while nearly as many (45%) say it should be legal. The two Republican typology groups hold similar positions on this question with broad majorities opposed to legalization. Among the three independent and Democratic groups, there is more division of opinion.

Two-thirds (66%) of Solid Liberals say marijuana should be legal, compared with 31% who think it should be illegal. In only two other groups does the balance of opinion tip toward legalization: Post-Moderns, who favor legalization by a 62% to 34% margin, and Libertarians, by a slimmer 54% to 43% margin.

There is far less support for legalization among the two other Democratic groups. Hard-Pressed Democrats are divided, with 49% favoring legalization and 48% opposed. Among New Coalition Democrats, more think the use of marijuana should be illegal (56%) than legal (36%), placing them closer to the views of the core Republican groups.

Government’s Role in Fighting Obesity

Most (57%) say the government should play a significant role in reducing obesity among children, while 39% say it should not. The broader Democratic coalition is united in saying the government should play a role in reducing obesity among children, while there are divides in the Republican coalition on this question.

Wide majorities of Staunch Conservatives (78%) and Libertarians (72%) say the government should not play a significant role in combating childhood obesity. However, Main Street Republicans and Disaffecteds offer mixed views. About as many Main Street Republicans say the government should play a role (50%) as say it should not (49%). Similarly, 46% of Disaffecteds say the government should be involved in reducing obesity among children; about as many (49%) say it should not be.

Among Democratic coalition groups there is broad support for the government working to reduce obesity among children. Majorities of New Coalition Democrats (86%), Solid Liberals (71%), Hard-Pressed Democrats (64%), and Post-Moderns (62%) support a role for the government in reducing childhood obesity.

Banning Dangerous Books

Most (57%) say that public school libraries should be allowed to carry any books they want, while 39% say books with dangerous ideas should be banned from public schools. And this question, which draws on concerns about civil liberties, freedom of expression and security, does not cleave along traditional Democratic and Republican lines.

Majorities in four of the eight typology groups oppose the idea of banning dangerous books. Solid Liberals overwhelmingly say public school libraries should be able to carry any books they want (82%-15%). The Democratic-leaning Post-Moderns (72%) and Republican-leaning Libertarians (69%) also think school libraries should carry any books they want. And, in a rare instance of agreement between the two most ideologically opposed groups, a 54%-majority of Staunch Conservatives also takes this view.

Opinion is more divided in the four other typology groups. About equal percentages of Main Street Republicans say books with dangerous ideas should be banned (47%) as say school libraries should be able to carry any books they want (50%). Among Disaffecteds, 48% say dangerous books should be banned, while 44% say school libraries should carry what they want. New Coalition and Hard-Pressed Democrats are also split on this question – in contrast with Solid Liberals, they tilt slightly toward banning books with dangerous ideas from public school libraries (53%-45% and 54%-44%, respectively).

Section 9: Foreign Policy and National Security

While Americans hold disparate views on how the U.S. should pursue its military and foreign policy, these issues generally do not represent the deepest divides across typology groups. This stands in contrast to the findings of the previous political typology study in 2005, in which national security issues were among the most divisive – a shift that reflects the public’s increasing focus on domestic policy over foreign policy.

Democratic groups continue to be more internationalist and more focused on diplomacy over the use of force than their Republican counterparts, but the gaps are far narrower than previously. There remain deep ideological divisions, however, over China, Islam and the United Nations.

Reflecting their focus on domestic economic issues, 58% of the public says we should pay less attention to problems overseas and concentrate on problems here at home, 33% say it is best for the future of our country to be active in world affairs. Six years ago, 49% said we should concentrate on problems at home, while 44% supported being active in world affairs.

The broadest support for international engagement comes from Solid Liberals and, to a slightly lesser extent, Post-Moderns, both of whom are divided over whether it is better for the U.S. to be active in world affairs or to concentrate on problems here at home. In all other groups, clear majorities say dealing with domestic problems should come first.

This inward-looking sentiment is highest among Hard-Pressed Democrats and Disaffecteds; nearly three-quarters of both say the U.S. should concentrate on problems at home. This is consistent with previous typology studies in which the most economically stressed groups prioritize a focus on dealing with domestic problems.

Majorities in both of the predominantly Republican groups – the Staunch Conservatives and Main Street Republicans – favor focusing on problems at home over being active in the world (by 54%-37% and 53%-37%, respectively). By contrast, foreign engagement was deeply divisive on the right six years ago. In the 2005 typology study fully 73% of the politically conservative Enterprisers said it was best for the future of our country to be active in world affairs – the most among any of the 2005 typology groups and far more than among other GOP groups. This is a sentiment no Republican, or even Republican-leaning, groups express today.

Public Backs Multilateralism

A majority of the public (53%) says the U.S. should take into account the interests of its allies, even if it means making compromises with them; 36% say the U.S. should follow its own national interests even when its allies strongly disagree.

As in the past, Solid Liberals stand out for their support for multilateralism – 72% say we should take into account the interests of our allies in setting foreign policy. Majorities of New Coalition Democrats (61%) and Democratic-leaning Post-Moderns (60%) agree. However, views across the Democratic coalition are not uniform as Hard-Pressed Democrats are divided in their views: 44% say the U.S. should follow its own interests, 39% say it should consider its allies.

There is no group in which a majority favors a unilateralist approach to foreign policy. Even among the Staunch Conservatives – who tend to favor a more assertive military stance in general – 47% say we should follow our own interests even when allies strongly disagree, while 40% say we should make compromises with allies to account for their interests. And a 54% majority of Main Street Republicans also say allied interests should be addressed.

As with views of foreign engagement, this represents a substantial change on the right since the previous typology in 2005. Six years ago, nearly three-quarters (73%) of Enterprisers, one of the most conservative typology groups, favored the U.S. going its own way even when allies disagreed.

Stability – Not Democracy – Higher Priority in Middle East

In the Middle East, the public views regional stability as more important than the spread of democracy. A 52% majority says it is more important to have stable governments in the Middle East, even if there is less democracy in the region; 37% say it is more important to have democratic governments, even if there is less stability.

There is consistent agreement among the Republican and independent typology groups that regional stability is most important: between 55% and 61% of each of these typology groups prioritize stable governments in the Middle East over democratic governments; this includes 61% of the Democratic-leaning Post-Moderns. Only among Solid Liberals does a slim majority (54%) say democratic governments are more important even if there is less stability in the Middle East. New Coalition and Hard-Pressed Democrats express mixed views, with about as many prioritizing democratic governments as stable governments.

Mixed Reactions to Libya Airstrikes

On balance, the public says it was the right decision (45%) for the U.S. and its allies to conduct military air strikes in Libya, 37% call it the wrong decision.

Slim majorities in three Democratic and Democratic-leaning groups, the Solid Liberals (58%), the New Coalition Democrats (55%) and the Post-Moderns (53%), say taking action in Libya was the right decision. But views are mixed in the other five groups, including the Hard-Pressed Democrats (40% right, 32% wrong); a relatively large share of the Hard-Pressed (28%) offer no opinion.

Many Disaffecteds Want Quicker U.S. Exit from Afghanistan

Half the public (50%) says Barack Obama is handling the pace of U.S. troop withdrawals from Afghanistan about right, 30% think he will not remove troops quickly enough and just 12% say he will remove troops too quickly.

Staunch Conservatives fault Obama for drawing down U.S. forces from Afghanistan too quickly. About half (52%) of Staunch Conservative say they think Obama will remove troops too quickly – far more than any other typology group.

But many GOP-oriented Disaffecteds express the opposite concern: 44% say Obama is not removing U.S. troops from Afghanistan quickly enough, which is the highest among typology groups.

Majorities of Democratic and Democratic-leaning groups say Obama is handling the situation about right; pluralities of Libertarians (49%) and Main Street Republicans (48%) agree.

Dealing with China on Economic Issues

By a 53%-40% margin, the public views building a stronger relationship with China on economic issues as more important than getting tougher with China on economic issues. Staunch Conservatives stand out from all other typology groups on this question and overwhelmingly favor getting tougher with China on economic issues: 79% say this, just 16% echo the broader public and prioritize building a stronger relationship with China.

Among all other typology groups, opinion is mixed or supportive of building a better relationship with China. About as many Main Street Republicans say it is more important to build a stronger relationship with China (43%) as support getter tougher on economic issues (47%). Among independent groups, Libertarians are divided, with 53% favoring a stronger relationship with China and 43% wanting to get tougher. The balance of opinion among Disaffecteds and Post-Moderns favors building a stronger economic relationship with China (by 54%-38% and 57%-37%, respectively).

Among Democratic groups, about two-thirds of Solid Liberals (65%) and New Coalition Democrats (66%) say that building a stronger economic relationship with China is more important than getting tougher on economic issues. Hard-Pressed Democrats are divided: 48% say build a stronger economic relationship with China, 46% say get tougher on economic issues.

Free Trade Agreements

By 48% to 41%, more say free trade agreements between the U.S. and other countries are a good thing for the country than say they are a bad thing. Disaffecteds are the only group where a majority (57%) says free trade agreements are bad for the United States. Both Republican groups and Libertarians are divided in their views.

Majorities of Post-Moderns (54%), New Coalition Democrats (59%), and Solid Liberals (52%) say free trade agreements are a good thing for the country. Fewer Hard-Pressed Democrats (40%) express this view.

Polarized Views of the United Nations

The United Nations is viewed unfavorably by an overwhelming 72% of Staunch Conservatives – an opinion that places Staunch Conservatives 20 points away from the next most negative group. Libertarians also hold a negative view of the United Nations, but by a more modest 52%-26% margin. Main Street Republicans (37% unfavorable, 47% favorable) and Republican-leaning Disaffecteds (33% unfavorable, 42% favorable) offer much more tempered reactions to the U.N.

Solid Liberals are about as favorable toward the U.N. as Staunch Conservatives are unfavorable: 75% hold a favorable view, just 17% an unfavorable one. However, there is far more consensus among the broader Democratic coalition than there is among the broader Republican coalition. Solid Liberals are joined by majorities of New Coalition Democrats (69%), Post-Moderns (60%), and Hard-Pressed Democrats (54%) in expressing favorable views of the United Nations.

Islam and Violence: Widespread Disagreement across Groups

When it comes to the relationship between Islam and violence, as many say the Islamic religion is more likely than others to encourage violence among its believers (40%) as say it does not encourage violence more than other religions (42%).

Staunch Conservatives and Solid Liberals, however, take overwhelmingly one-sided – and opposing – views on the issue: fully 84% of Staunch Conservatives say the Islamic religion is more likely than other religions to encourage violence among its believers. Solid Liberals are almost as uniform in rejecting this idea (71%).

Opinion is less one-sided among other typology groups. Among the broader GOP coalition, majorities of Main Street Republicans (58%) and Libertarians (52%) say Islam is more likely than other religions to encourage violence; Disaffecteds are split (39% say Islam does encourage violence more, 35% say it does not). Among Democratic groups, most Post-Moderns (58%) say Islam does not encourage violence more than other religions. On balance, New Coalition Democrats also say that Islam is not more likely to encourage violence (by 44% to 26%), but Hard-Pressed Democrats are divided (46% say Islam does not encourage violence more, 37% say it does).

Most Unwilling to Trade Privacy for Security

Nearly seven-in-ten (68%) say that Americans should not have to give up privacy and freedom in order to be safe from terrorism; about a quarter (26%) say Americans need to be willing to give up privacy and freedom in order to be safe from terrorism. This is a rare question in which there is broad consensus across typology groups. In fact, at least 60% of all groups agree that Americans should not have to give up privacy and freedom in order to be safe from terrorism. Hard-Pressed Democrats (78%-17%) take this position by the widest margin, but there is little variance among other groups: Democratic, Republican and independent alike.

About the Political Typology

The 2011 typology divides the public into eight politically engaged groups, along with a ninth group of less engaged Bystanders. The assignment of individuals to one of the eight core typology groups is based primarily on their position on nine scales of social and political values – each of which is determined by responses to two or three survey questions – as well as their party identification.

The questions used to create the value scales are in a balanced alternative format where respondents choose which of two statements mostly closely reflects their own views (Q17 and Q37 in the topline). Scales were developed using factor analysis and tests of scale reliability to select the questions most strongly related to the underlying dimension being measured. Many of these value scales are similar to those in past typology studies. However, each update of the typology starts with a fresh analysis of American values to reflect any shifts in the political environment.

The typology groups are created using a statistical procedure called “cluster analysis” which accounts for respondents’ scores on all nine scales as well as party identification to sort them into relatively homogeneous groups.The tables on the following pages show each of the scales, its component questions, and the average placement of each of the eight typology groups (excluding bystanders) on each scale.

Cluster analysis is not an exact process. Different cluster solutions are possible using the same data depending on model specifications and even the order in which respondents are assessed. Several different cluster solutions were evaluated for their effectiveness in producing cohesive groups that were sufficiently distinct from one another, large enough in size to be analytically practical, and substantively meaningful. While each solution differed somewhat from the others, all of them shared certain key features. The final solution selected to produce the political typology was judged to be strongest from a statistical point of view, most persuasive from a substantive point of view, and was representative of the general patterns seen across the various cluster solutions.

As in past typologies, a measure of political attentiveness and voting participation was used to extract the “Bystander” group, people who are largely not engaged or involved in politics, before the remaining respondents were sorted into groups. Bystanders are defined as those who are: 1) Not registered to vote, 2) Say they seldom or never vote, and 3) Do not follow government and public affairs most of the time. They represent 10% of the overall population, and were held aside prior to scale development and assignment of the remaining 90% of respondents to their typology groups.

About the Surveys

Most of the analysis in the 2011 Typology Report is based on telephone interviews conducted February 22 – March 1, 2011 and March 8-14, 2011 among a national sample of 3,029 adults 18 years of age or older living in the continental United States (2,026 respondents were interviewed on a landline telephone, and 1,003 were interviewed on a cell phone, including 455 who had no landline telephone). In addition to the main survey, some results are based on a callback survey where an attempt was made to re-interview respondents to the original survey. This short follow-up survey, conducted April 7-10, 2011 obtained interviews with 1,432 respondents from the original typology survey.

The surveys were conducted by interviewers at Princeton Data Source under the direction of Princeton Survey Research Associates International. A combination of landline and cell phone random digit dial samples were used; both samples were provided by Survey Sampling International. Interviews for the main survey were conducted in English and Spanish. Interviews for the callback survey were conducted in English only. Respondents in the landline sample were selected by randomly asking for the youngest adult male or female who is currently at home. Interviews in the cell sample were conducted with the person who answered the phone, if that person was an adult 18 years of age or older.

The combined landline and cell phone sample for each survey is weighted using an iterative technique that matches gender, age, education, race, Hispanic origin, region and population density to parameters from the March 2010 U.S. Census Bureau’s Current Population Survey. The samples also are weighted to match current patterns of telephone status and relative usage of landline and cell phones (for those with both), based on extrapolations from the 2010 National Health Interview Survey. The weighting procedure also accounts for the fact that respondents with both landline and cell phones have a greater probability of being included in the combined sample and adjusts for household size within the landline sample. Sampling errors and statistical tests of significance take into account the effect of weighting.

The following table shows the sample sizes and the error attributable to sampling that would be expected at the 95% level of confidence for the total sample and for the typology groups in each survey:

In addition to sampling error, one should bear in mind that question wording and practical difficulties in conducting surveys can introduce error or bias into the findings of opinion polls.

Survey Methodology in Detail

The typical Pew Research Center for the People & the Press national survey selects a random digit sample of both landline and cell phone numbers in the continental United States. As the proportion of Americans who rely solely or mostly on cell phones for their telephone service continues to grow, sampling both landline and cell phone numbers helps to ensure that our surveys represent all adults who have access to either (only about 2% of households in the U.S. do not have access to any phone). We sample landline and cell phone numbers to yield a ratio of approximately two completed landline interviews to each cell phone interview. This ratio is based on an analysis that attempts to balance cost and fieldwork considerations as well as to improve the overall demographic composition of the sample (in terms of age, race/ethnicity and education). This ratio also ensures an adequate number of cell-only respondents in each survey.

The design of the landline sample ensures representation of both listed and unlisted numbers (including those not yet listed) by using random digit dialing. This method uses random generation of the last two digits of telephone numbers selected on the basis of the area code, telephone exchange, and bank number. A bank is defined as 100 contiguous telephone numbers, for example 800-555-1200 to 800-555-1299. The telephone exchanges are selected to be proportionally stratified by county and by telephone exchange within the county. That is, the number of telephone numbers randomly sampled from within a given county is proportional to that county’s share of telephone numbers in the U.S. Only banks of telephone numbers containing three or more listed residential numbers are selected.

The cell phone sample is drawn through systematic sampling from dedicated wireless banks of 100 contiguous numbers and shared service banks with no directory-listed landline numbers (to ensure that the cell phone sample does not include banks that are also included in the landline sample). The sample is designed to be representative both geographically and by large and small wireless carriers.

Both the landline and cell samples are released for interviewing in replicates, which are small random samples of each larger sample. Using replicates to control the release of telephone numbers ensures that the complete call procedures are followed for all numbers dialed. The use of replicates also improves the overall representativeness of the survey by helping to ensure that the regional distribution of numbers called is appropriate.

When interviewers reach someone on a landline phone, they randomly ask half the sample if they could speak with “the youngest male, 18 years of age or older, who is now at home” and the other half of the sample to speak with the “youngest female, 18 years of age or older, who is now at home.” If there is no eligible person of the requested gender at home, interviewers ask to speak with the youngest adult of the opposite gender, who is now at home. This method of selecting respondents within each household improves participation among young people who are often more difficult to interview than older people because of their lifestyles.

Unlike a landline phone, a cell phone is assumed in Pew Research polls to be a personal device. Interviewers ask if the person who answers the cell phone is 18 years of age or older to determine if the person is eligible to complete the survey. This means that, for those in the cell sample, no effort is made to give other household members a chance to be interviewed. Although some people share cell phones, it is still uncertain whether the benefits of sampling among the users of a shared cell phone outweigh the disadvantages.

Sampling error results from collecting data from some, rather than all, members of the population. For each of our surveys, we report a margin of sampling error for the total sample and often for key subgroups analyzed in the report. For example, the sampling error for a typical national survey of 1,500 completed interviews is plus or minus 3 percentage points with a 95% confidence interval. This means that in 95 out of every 100 samples of the same size and type, the results we obtain would vary by no more than plus or minus 3 percentage points from the result we would get if we could interview every member of the population. Thus, the chances are very high (95 out of 100) that any sample we draw will be within 3 points of the true population value. The sampling errors we report also take into account the effect of weighting.

At least 7 attempts are made to complete an interview at every sampled telephone number. The calls are staggered over times of day and days of the week (including at least one daytime call) to maximize the chances of making contact with a potential respondent. Interviewing is also spread as evenly as possible across the field period. An effort is made to recontact most interview breakoffs and refusals to attempt to convert them to completed interviews.

Response rates for Pew Research polls typically range from 5% to 20%; these response rates are comparable to those for other major opinion polls. The response rate is the percentage of known or assumed residential households for which a completed interview was obtained. The response rate we report is computed using the American Association for Public Opinion Research’s Response Rate 3 (RR3) method. Fortunately, low response rates are not necessarily an indication of nonresponse bias. Nonresponse in telephone interview surveys can produce biases in survey-derived estimates. Survey participation tends to vary for different subgroups of the population, and these subgroups are likely to also vary on questions of substantive interest. To compensate for these known biases, the sample data are weighted for analysis.

The landline sample is first weighted by household size to account for the fact that people in larger households have a lower probability of being selected. In addition, the combined landline and cell phone sample is weighted to account for the fact that respondents with both a landline and cell phone have a greater probability of being included in the sample. The sample is then weighted using population parameters from the U.S. Census Bureau for adults 18 years of age or older living in the continental United States. The parameters for age, education, race/ethnicity, and region are from the Current Population Survey’s March 2010 Annual Social and Economic Supplement and the parameter for population density is from the Decennial Census. These population parameters are compared with the sample characteristics to construct the weights. In addition to the demographic parameters, the sample is also weighted to match current patterns of telephone status and relative usage of landline and cell phones (for those with both), based on extrapolations from the 2010 National Health Interview Survey. The final weights are derived using an iterative technique that simultaneously balances the distributions of all weighting parameters.

Weighting cannot eliminate every source of nonresponse bias. Nonetheless, properly-conducted public opinion polls have a good record in achieving unbiased samples. In particular, election polling – where a comparison of the polls with the actual election results provides an opportunity to validate the survey results – has been very accurate over the years.

For more information about our survey methodology, see https://alpha.pewresearch.org/pewresearch-org/politics/methodology/.