Pew Research Center

FOR RELEASE APRIL 7, 2011

Economic Views Sag, Obama Rating Slips

Pocketbook Concerns: Prices Matter More than Jobs

FOR MEDIA OR OTHER INQUIRIES:

Communications Department
202.419.4372
www.pewresearch.org

RECOMMENDED CITATION

Pew Research Center, April 2011, "Economic Views Sag, Obama Rating Slips"

About Pew Research Center

Pew Research Center is a nonpartisan, nonadvocacy fact tank that informs the public about the issues, attitudes and trends shaping the world. It does not take policy positions. The Center conducts public opinion polling, demographic research, computational social science research and other data-driven research. It studies politics and policy; news habits and media; the internet and technology; religion; race and ethnicity; international affairs; social, demographic and economic trends; science; research methodology and data science; and immigration and migration. Pew Research Center is a subsidiary of The Pew Charitable Trusts, its primary funder.

© Pew Research Center 2026

Table of contents

  • About Pew Research Center
  • Economic Views Sag, Obama Rating Slips
  • Section 1: Views of Obama
  • Section 2: National Economy, Personal Finances
  • Section 3: Views of the Political Parties
  • Section 4: Congress at 100 Days
  • About the Survey

Economic Views Sag, Obama Rating Slips

Pocketbook Concerns: Prices Matter More than Jobs

With the public growing more anxious about the economy and concerned about overseas commitments, Barack Obama’s job rating has edged lower.
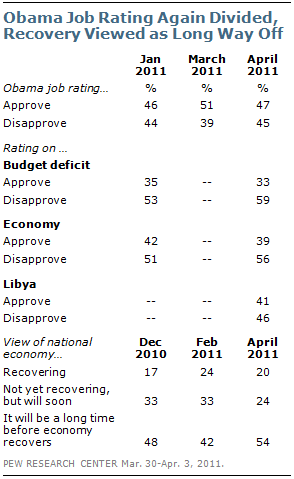
About as many now approve (47%) as disapprove (45%) of the way Obama is handling his job as president. In March, opinions about Obama’s job performance were more positive; 51% approved of his job performance and 39% disapproved. The current measure is similar to Obama’s ratings from last fall through early 2011.

On specific issues, Obama gets particularly negative ratings for his handling of the federal budget deficit (59% disapprove) and the overall economy (56% disapprove). He gets a mixed rating for his handling of the situation in Libya (41% approve, 46% disapprove). The survey also shows that an increasing number of Americans say the U.S. and its allies lack a clear goal in Libya. (See “Goal of Libyan Operation Less Clear to Public,” April 5.)

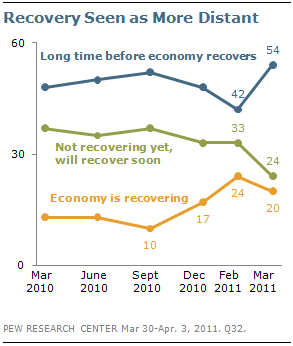
Despite recent signs of job growth, Americans are taking a more negative view of the national economy. The proportion rating economic conditions as “poor” has risen from 42% in February to 53% currently. Equally important, the public’s economic outlook has dimmed: 54% now say it will be a long time before the economy recovers, up 12 points from February. And there has been a rise in the percentage that expects their personal finances to get worse over the next year – from 26% in December to 33% currently.

The latest national survey by the Pew Research Center for the People & the Press, conducted March 30-April 3 among 1,507 adults, finds widespread concern about an array of financial problems – not just jobs, but also prices for gas and food.
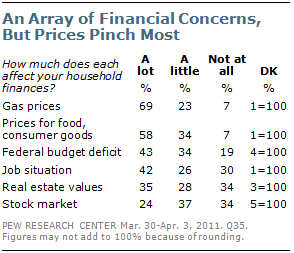
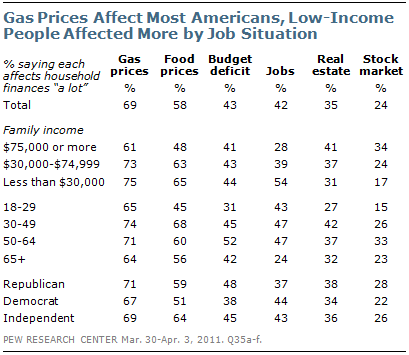
Fully 69% say that gas prices affect their household’s financial situation a lot; 58% say the same about prices for food and consumer goods. By comparison, 42% say the job situation has a major impact on their personal financial situation; about as many (43%) say the federal budget deficit affects their personal financial situation a lot.

(Pew Research’s Weekly News Interest Index, released April 6, found that while the percentage of Americans who say they are hearing mostly bad news about the job situation has declined, more are hearing bad news about prices. )

With the showdown on federal spending looming, Obama’s job rating continues to be much higher than those of Republican or Democratic leaders in Congress. Just 30%
approve of the job that Republican leaders in Congress are doing while twice as many (61%) disapprove. The job rating for Democratic congressional leaders is equally dismal (31% approve, 60% disapprove).

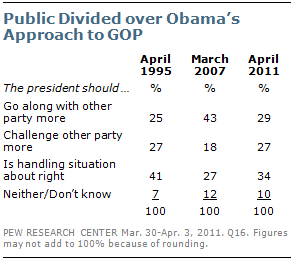
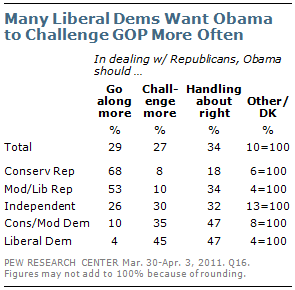
However, while Obama continues to attract overwhelming support from the Democratic base, many Democrats – particularly liberals – say he should challenge congressional Republicans more often. Among the general public, 29% say he should go along with Republicans more often, 27% say he should challenge them more often, and 34% say he is handling this about right.

Liberal Democrats are divided – 47% say he is handling relations with congressional Republicans about right, but nearly as many (45%) want him to challenge Republicans more often. Conservative and moderate Democrats, on balance, say Obama is handling this about right. Republicans, not surprisingly, would like to see Obama go along with the GOP more often.

The Republican Party has an advantage in views of which party can better handle the budget deficit – 46% say the Republicans can do better, compared with 34% who choose the Democrats. The two parties continue to run about even on most other issues, including jobs and health care. However, the Democratic Party holds leads over the Republicans on such traits as concern for average people (by 22 points), willingness to work with opposition leaders (17 points) and ethical governance (nine points).

The budget debate on Capitol Hill has focused in part on the possible impact of deep reductions in government spending on the nation’s job situation. In a separate survey conducted last month (March 8-14), 41% said that major cuts in spending this year would not have much of an effect on the job situation. Among those who did see an impact, nearly twice as many said deep cuts would hurt, rather than help, the job situation (34% vs. 18%). Pluralities of independents (45%) and Republicans (41%) said that major spending reductions would not affect the job situation; Democrats were divided, with 39% saying deep cuts would hurt the job situation and 35% saying they would not have much of an impact.

The new survey finds that as the Republican-led House approaches the 100-day mark of its tenure, about as many Americans say they are unhappy (44%) as happy (43%) that the GOP won control of the House last November. Just a third (33%) say they are keeping their campaign promises while 52% say they are not.

Comparatively, the Republican-led House gets less positive marks than did the Democratic-led Congress in March 2007 and the GOP-led Congress in April 1995. In both of those cases, however, the parties took control of both the House and Senate; the GOP currently has a majority in the House but not the Senate.

Section 1: Views of Obama

Currently, 47% approve of the way Obama is handling his job as president while 45% disapprove. Opinions about Obama’s job performance continue to be deeply divided along partisan

lines: 80% of Democrats approve of the way he is handling his job while 16% disapprove. Republicans’ views are the reverse – 16% approve and 81% disapprove. Among independents, 48% disapprove and 42% approve of the job Obama is doing. (For a detailed breakdown of Obama’s overall job rating, see the table at the end of this report.)

In terms of specific issues, Obama receives his highest rating for his handling of the environment (51% approve, 35% disapprove). On five other issues tested – Afghanistan, Libya, energy policy, the economy and budget deficit – Obama’s ratings are mixed or more negative than positive.

Among these issues, Obama gets his lowest ratings on the budget deficit and the economy. Currently, 59% disapprove of his handling of the budget deficit and 56% disapprove of his handling of the economy. These views have changed little since the summer of 2009.

Obama Faulted on the Deficit

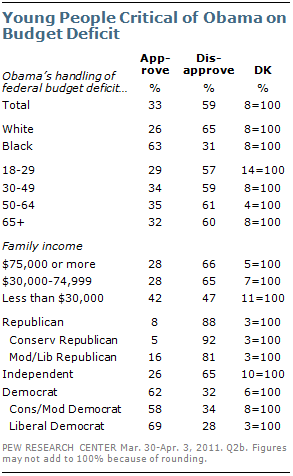
Even some groups that have generally positive opinions about Obama, such as young people, are critical of his handling of the federal budget deficit. Overall, more than half of those younger than 30 (54%) approve of Obama’s overall job performance – the highest percentage in any age group.

But nearly twice as many young people disapprove as approve of his handling of the federal budget deficit (57% to 29%). On this issue, the views of young people are similar to those in older age groups.

Nearly two-thirds of independents (65%) disapprove of Obama’s handling of the deficit, while just 26% approve. Even independents who lean to the Democratic Party give Obama only a mixed rating on this issue (48% approve, 43% disapprove).

How Should Obama Deal with Congress?

The public is divided over how President Obama should deal with Republicans in Congress. About as many say Obama should go along

with Republicans more often (29%) as say he should challenge Republicans more often (27%); 34% say he is handling things about right.

While mixed, opinion is far more favorable toward Obama than it was toward George W. Bush following the 2006 midterms. In March 2007, just 18% said Bush should challenge congressional Democrats more often – far more (43%) said he should go along with Democrats more often; about a quarter (27%) said he was handling things about right. The public’s views of Obama’s approach to Congress today is similar to opinions about Bill Clinton’s in the spring of 1995, following Democratic losses in the 1994 midterm election.

Section 2: National Economy, Personal Finances

The public’s views of the national economy began to move in a less negative direction late last year. The proportion rating the national economy as poor fell from 54% in October to 45% in December. That trend continued through February, when 42% said economic conditions were poor.

But in the new survey, the number saying economic conditions are poor has again climbed; currently, 53% say the economy is poor, up 11 points from February. Fewer people rate the economy as only fair (38% now, down from 45% in February). As has been the case for the past three years, very few (8%) say that economic conditions are excellent or good.

Negative views of economic conditions have increased among most demographic and political groups. But independents are especially gloomy about the state of the economy: 57% say economic conditions are poor, up from 43% in February. A comparable percentage of Republicans (59%) also views the economy as poor, which is little changed from February (51%). Democrats’ views of the economy have

shown less change and are more positive than those of Republicans or independents (41% poor now, 36% in February).

Since February, there also has been a decline in the number saying the economic recovery is already occurring or will kick in soon. Two months ago, a majority (57%) said the economy was recovering (24%) or that the economy would recover soon (33%).

Only about four-in-ten (42%) said it would be a long time before the economy recovered.

Today, more (54%) say the recovery is a long way off than say either it is already recovering (20%) or will recover soon (24%).

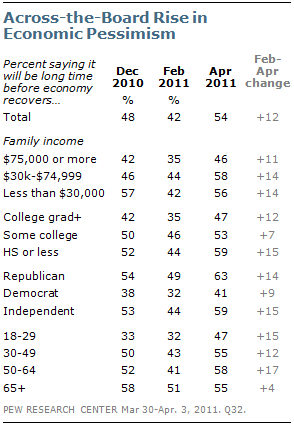
The rise in economic pessimism since February has come across nearly all political and demographic groups. And in most cases, people are about as likely to see recovery as a long way off as they did in December.

Just as independents’ views of current economic conditions are comparable to Republicans’ assessments, their economic expectations are similar as well. Currently, 59% of independents and 63% of Republicans say it will be a long time before the economy recovers; that compares with 41% of Democrats. In February, 49% of Republicans, 44% of independents and 32% of Democrats said the recovery was a long way off.

More Expect Family Financial Situation to Worsen

The public continues to give rather dour assessments of their own personal financial situation. Most rate their finances as either only fair (36%) or poor (26%); 29% say they are in good shape and just 7% say they are in excellent shape financially. Personal financial ratings have shown little change over the past several months.

At the same time, people’s financial outlooks for the next year have become somewhat more negative since December. Just over half (51%) say they expect their financial situation to improve a lot (7%) or some (44%) over the next year. However, the percentage saying they expect it to get a little or a lot worse has grown from 26% in December to 33% in the current survey.

The increase in financial pessimism has come entirely among those in middle- and lower-income groups. Currently, 35% of those with family incomes of between $30,000 and $75,000 expect their finances to get worse, up from 25% in December. There has been a similar increase among those with family incomes of less than $30,000 (from 29% to 39%).

By contrast, those earning $75,000 or more a year have experienced no change in expectations and remain far less likely to say they expect their situation to worsen (23% compared with 35% and 39%, respectively).

Republicans have also become more pessimistic about the outlook for their family’s finances over the next year. Roughly a third (36%) expects their situation to get worse over the next year up from 26% in December.  There have been no significant changes among Democrats or independents.

Gas Prices Top Household Financial Pressure

Gas prices affect the household finances of most Americans, regardless of their age, income or political affiliation. Fully 69% of the public and majorities across demographic and political groups say that gas prices affect their household finances a lot.

Aside from gas prices, however, there is less common ground in views of different financial pressures. While large majorities of those with low  (65% of those with less than $30,000) and middle family incomes (63% of those with $30,000 to $75,000) say their finances are affected a great deal by prices for food and other consumer goods, fewer of those with higher incomes agree. About half (48%) of those with incomes of $75,000 or more say their finances are affected a lot by food and consumer prices.

Jobs are a particular concern for those with lower incomes: 54% of those with incomes of below $30,000 say the job situation say their household finances are affected a lot by the job situation, the highest in any other income category. Conversely, the stock market is a greater concern for those with incomes of at least $75,000 than it is for those in lower income groups.

The budget deficit is generally viewed as a secondary financial concern, though more Republicans and independents than Democrats say the deficit affects their household finances. Nearly half of Republicans (48%) and 45% of independents say their household finances are affected a lot by the budget deficit; fewer Democrats (38%) express this view.

Section 3: Views of the Political Parties

The Republican Party now leads the Democrats by 12 points as the party better able to reduce the federal budget deficit: 46% say the GOP could do better compared with 34% who prefer the Democrats. A year ago, the two parties were rated about evenly on reducing the deficit (38% Republicans, 35% Democrats).

On most other issues, the two parties run about even. But on several, the GOP has made substantial gains in recent years. In August 2009, the Democratic Party held a 13-point lead on making wise decisions about foreign policy (44% to 31%). Today, 40% say the GOP could do better while about as many (38%) choose the Democrats. The GOP also has drawn even with the Democrats on health care and energy. The Democrats led by 10 points on health care last September and by 10 points on dealing with energy problems last October.

The Democrats continue to hold a substantial advantage as the party better able to improve education (46% to 32%). But the GOP has narrowed the Democrats’ lead since August 2009, when more than twice as many said the Democratic Party than the GOP could improve education (47% to 22%).

Democrats Lead on Key Traits

While Republicans have the advantage in views of which party can reduce the budget deficit and have made inroads on other issues, the Democratic Party still holds substantial leads on several key traits and characteristics.

Democrats continue to have better ratings than Republicans on traits such as concern for average people (by 54% to 32%) and governing in a more honest and ethical way (42% to 33). And far more view the Democratic Party than the Republican Party as more willing to with political leaders from the other party (49% to 32%).

In addition, somewhat more continue to say that the Republican Party, rather than the Democratic Party, is more influenced by lobbyists and special interests: 44% say the GOP is more influenced by lobbyists compared with 34% who say the Democrats.

The parties are now about even on the question of who can bring about changes the country needs (44% say Democrats, 41% say Republicans). In June, 2010 Democrats held a 12-point edge on this trait.

The public also is as likely to say Republicans (41%) are better able to manage the government as they are to say Democrats (39%). Just before the 2010 midterm elections Republicans held a small advantage over Democrats as the party seen as better able to manage the federal government (43% vs. 36%).

Independents Favor GOP on Managing Government

For the most part, independents’ views of the parties and their images mirror those of the general public. However, there is a notable exception to this pattern. Far more independents think the Republicans rather than the Democrats can better manage the federal government (by 47% to 28%).

Yet the Democratic Party holds clear advantages among independents on concern for average people (by 49% to 30%) and on willingness to work with political leaders from the other party

On issues, the GOP holds a lead among independents as the party better able to reduce the federal budget deficit (45% to 29%), while the Democrats are favored on improving the education system (43% to 30%). On other issues, the two parties run about even among independents.

Section 4: Congress at 100 Days

As the 112th Congress approaches the 100-day mark, most say Republicans in the House of Representatives are not keeping their campaign promises and fewer than half say they are happy the Republicans won control of the House in last November’s election.

Just a third (33%) say that that Republicans in the House are keeping the promises they made during the campaign, while 52% say they are not. Compared with other recent changes in power on Capitol Hill, House Republicans receive lower marks for delivering on campaign promises than did Democrats in 2007 and Republicans in 1995– though, in both 2007 and 1995 the party in power controlled both the House and Senate.

In March 2007, 40% said Democrats in Congress were keeping the promises they made during the campaign, while 38% did not. And in 1995, the public reacted even more positively to the new Republican Congressional leadership: 59% said they were keeping their promises, just 30% said they were not.

In the current survey, most Republicans (54%) say their representatives in the House are keeping their promises, while 33% say they are not. Conservative Republicans (61%) are much more likely than moderate and liberal Republicans (39%) to say that Republicans in the House have followed through on their promises.

Nearly six-in-ten (59%)  Republicans and Republican leaners who agree with the Tea Party movement say House Republicans are keeping their promises while 30% say they are not. Opinions are mixed among Republicans and Republican leaners who have no opinion of the Tea Party or disagree with the movement (42% keeping promises, 45% not keeping promises).

By wide margins, Democrats and independents say that House Republicans are not keeping their campaign promises. Nearly two-thirds of Democrats (65%) say that House Republicans are not keeping their promises while 23% say that they are; among independents, 54% say House Republicans are not keeping their promises while 30% say that they are.

Public Now Split Over Election Outcome

Shortly after the GOP won control of the House, the public expressed mixed reactions to the outcome; in Pew Research’s post-election survey, 48% said they were happy that the Republicans gained control of the House while 34% were unhappy. Reactions were far more positive to the Democrats winning control of the Congress in 2007 and the Republicans’ sweeping electoral victories in 1994. In both cases, however, those parties won control of both the House and the Senate.

In the new survey, the public is divided in reactions to the GOP’s victory in November; 43% say they are happy the Republican Party won control of the House while about the same percentage (44%) expresses unhappiness.

This follows a pattern from the Democratic congressional victory four years ago and the GOP’s big win in 1995: Public reactions to those power shifts were also somewhat less positive at about the 100-day mark than they were just after the election. Even so, narrow

majorities continued to express positive views of those election outcomes (54% happy in March 2007, 52% in April 1995).

Independents are now divided in their reaction to the election: 43% say they are happy the GOP won control of the House while 39% are unhappy. In November, independents by a wide margin (48% to 27%) expressed a positive reaction to the Republicans’ victory. The proportion of Democrats unhappy that the GOP won also has increased (from 73% to 84%). Republicans remain overwhelmingly happy that the GOP won control of the House (90% happy, 6% unhappy).

Boehner Job Approval Ratings

The public is split over the performance of Speaker of the House John Boehner, with many unable to offer a rating of the Republican leader. Boehner is no less visible than Nancy Pelosi was in the spring in 2007, but while Pelosi enjoyed a broadly positive balance of opinion, about as many say they approve of Boehner’s job performance (36%) as disapprove (34%); 29% cannot offer a rating.

In April 1995, Newt Gingrich also received mixed reviews from the public for his performance as Speaker of the House. However, Gingrich was far better known than either Pelosi or Boehner – just 15% could not offer a rating of Gingrich in the spring of 1995.

Tea Party Seen as Separate from the GOP

More continue to say that the Tea Party is a separate and independent movement from the Republican Party (50%) than say it is part of the GOP (36%). Opinion on this question is little changed since last November following the midterm elections (47% separate, 38% part of GOP).

Most Republicans (59%) and independents (54%) view the Tea Party as an independent movement. Democrats, however, are divided: 41% say it is a separate movement, 46% say it is part of the Republican Party.

Two-thirds (67%) of those who agree with the Tea Party say it is a separate and independent movement from the Republican Party. Among those who disagree with the Tea Party, more say it is part of the GOP (52%) than say it is a separate movement (41%).

Tea Party Republicans are dissatisfied with the amount of attention that the movement receives from Republican leaders. More than half (56%) of Republicans and Republican leaders who agree with the Tea Party movement say that Republican leaders pay too little attention to the Tea Party. Just 35% say Republican leaders are paying the right amount of attention, while 2% say the movement gets too much attention from GOP leaders.

By contrast, Republicans and Republican leaders who have no opinion of the Tea Party or disagree with the movement are divided: 33% say Republican leaders pay the right amount of attention to the Tea Party, 29% say too little and 15% say they pay too much attention to the movement.

By roughly two-to-one, more Democrats say GOP leaders are paying too much attention to the ideas of the Tea Party (46%) than too little (24%); 14% say they are paying the right amount of attention to the Tea Party.

Republicans are divided: 38% say that Republican leaders are paying too little attention to the Tea Party, while about as many (34%) say they are paying the right amount; just 10% of Republicans say GOP leaders are paying too much attention to the Tea Party. Among independents, 36% say Republican leaders are paying too little attention to the Tea Party, 24% say too much and the same percentage says the right amount.

About the Survey

The analysis in this report is based on telephone interviews conducted March 30-April 3, 2011 among a national sample of 1,507 adults 18 years of age or older living in the continental United States (1,001 respondents were interviewed on a landline telephone, and 506 were interviewed on a cell phone, including 215 who had no landline telephone). The survey was conducted by interviewers at Princeton Data Source under the direction of Princeton Survey Research Associates International. A combination of landline and cell phone random digit dial samples were used; both samples were provided by Survey Sampling International. Interviews were conducted in English. Respondents in the landline sample were selected by randomly asking for the youngest adult male or female who is now at home. Interviews in the cell sample were conducted with the person who answered the phone, if that person was an adult 18 years of age or older. For detailed information about our survey methodology, see https://alpha.pewresearch.org/pewresearch-org/politics/methodology/

The combined landline and cell phone sample are weighted using an iterative technique that matches gender, age, education, race, Hispanic origin, region, and population density to parameters from the March 2010 Census Bureau’s Current Population Survey. The sample also is weighted to match current patterns of telephone status and relative usage of landline and cell phones (for those with both), based on extrapolations from the 2010 National Health Interview Survey. The weighting procedure also accounts for the fact that respondents with both landline and cell phones have a greater probability of being included in the combined sample and adjusts for household size within the landline sample. Sampling errors and statistical tests of significance take into account the effect of weighting. The following table shows the sample sizes and the error attributable to sampling that would be expected at the 95% level of confidence for different groups in the survey:

Sample sizes and sampling errors for other subgroups are available upon request.

In addition to sampling error, one should bear in mind that question wording and practical difficulties in conducting surveys can introduce error or bias into the findings of opinion polls.