
Pew Research Center

FOR RELEASE DECEMBER 7, 2010

Mixed Views on Tax Cuts, Support for START and Allowing Gays to Serve Openly

Public's Views on Lame-Duck Issues

FOR MEDIA OR OTHER INQUIRIES:

Communications Department
202.419.4372
www.pewresearch.org

RECOMMENDED CITATION

Pew Research Center, December 2010, "Mixed Views on Tax Cuts, Support for START and Allowing Gays to Serve Openly"

About Pew Research Center

Pew Research Center is a nonpartisan, nonadvocacy fact tank that informs the public about the issues, attitudes and trends shaping the world. It does not take policy positions. The Center conducts public opinion polling, demographic research, computational social science research and other data-driven research. It studies politics and policy; news habits and media; the internet and technology; religion; race and ethnicity; international affairs; social, demographic and economic trends; science; research methodology and data science; and immigration and migration. Pew Research Center is a subsidiary of The Pew Charitable Trusts, its primary funder.

© Pew Research Center 2026

Table of contents

  • About Pew Research Center
  • Mixed Views on Tax Cuts, Support for START and Allowing Gays to Serve Openly
  • Section 1: Issues Before the Lame-Duck Congress
  • Section 2: Views of the Parties, Congress & Obama
  • Section 3: Afghanistan and the Korean Crisis
  • About the Surveys

Mixed Views on Tax Cuts, Support for START and Allowing Gays to Serve Openly

Public's Views on Lame-Duck Issues

Overview

With the public giving subpar approval ratings to President Obama and continuing to express negative views of Congress and the political parties, it goes its own way on many of the remaining issues before the lame-duck Congress.

In a survey conducted before Obama and GOP leaders agreed to temporarily extend all Bush-era tax cuts, most Americans (80%) favor preserving at least some of the tax cuts. However, just a third (33%) of Americans say they favor keeping all of the expiring tax cuts; 47% favor keeping just the tax cuts for income below $250,000, while just 11% want to end all of the tax cuts.

Only about one-in-five Democrats (18%) favor keeping all of the tax cuts, compared with 33% of independents and 53% of Republicans.

On another major pending issue before Congress, most Americans who have heard at least a little about the START treaty favor its ratification by the Senate: 54% favor ratification of the arms control treaty while 24% are opposed. Democrats and independents favor the treaty’s ratification by wide margins, while Republicans are evenly split.

And by greater than two-to-one (59% to 23%), the public favors allowing gays and lesbians to serve openly in the military. These views are little changed from last month, before the Pentagon released its major study on the impact of repealing the “don’t ask, don’t tell” policy. Those who are aware of the Pentagon’s report have about the same opinions as those who heard little about it. (See “Most Continue to Favor Gays Serving Openly in the Military,” Nov. 29.).

The latest national survey by the Pew Research Center for the People & the Press, conducted Dec. 1-5 amon
g 1,500 adults, finds that 45% approve of Obama’s job performance while about as many (43%) disapprove. Obama’s job ratings have changed little since September.

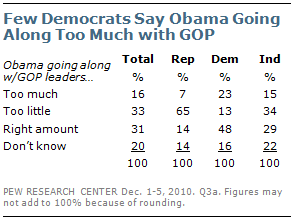
Obama’s job approval ratings among Democrats remain strong (77% approve), and there is little evidence that Democrats think he is going along too much with GOP leaders in Congress. Only about quarter of Democrats (23%) say he is going along too much, while about twice as many (48%) say he is going along the right amount.

However, Obama gets mixed ratings from Democrats and Democratic leaners for how well he stands up for his party’s traditional positions on such issues as protectin
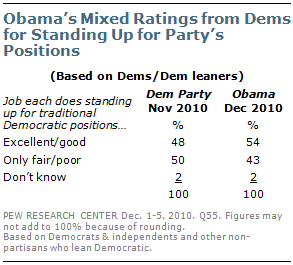
g the interests of minorities, helping the poor and needy and representing working people. Only about half of Democrats and Democratic leaners (54%) say Obama is doing an excellent or good job of advocating the party’s traditional positions, while 43% say he is doing only fair or poor. White Democrats and Democratic leaners are divided over Obama’s performance in standing up for the party’s traditional positions in these areas (51% excellent/good vs. 47% only fair/poor). By contrast, black Democrats and leaners offer much more positive assessments (70% vs. 29%).

Overall, Democrats and Democratic leaners give Obama only slightly better marks than the party itself for advocating traditional positions. In November, 48% said the party was doing an excellent or good job while 50% said it was doing only fair or poor.

The survey finds that opinions about Congress and the political parties have changed little since before the midterm elections. Just 31% say they have a favorable opinion of Congress, which is little changed from July (33%). Similarly, while 45% say they have a favorable impression of the Democratic Party, about the same percentage (41%) has a favorable opinion of the GOP
.

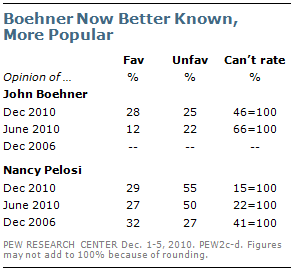
Nancy Pelosi, the outgoing speaker of the House, remains broadly unpopular. More than half (55%) say they have an unfavorable opinion of Pelosi while only 29% say they have a favorable opinion.

The balance of opinion is more positive toward John Boehner, who is expected to succeed Pelosi as House speaker next month. About as many say they have a favorable opinion of Boehner (28%) as an unfavorable view (25%). Boehner’s favorability ratings have increased in recent months, along with his visibility. In June, nearly twice as many expressed negative as positive views of Boehner (22% vs. 12%). Notably, Boehner’s current favorability ratings are about the same as Pelosi’s in December 2006, shortly before she became speaker (32% favorable/27% unfavorable).
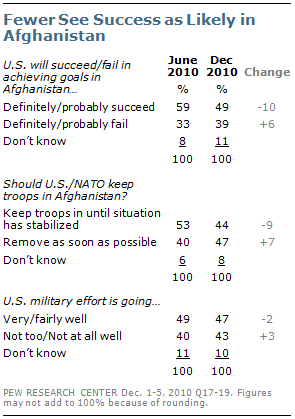
On foreign policy, the public has become less optimistic that the U.S. will succeed in achieving its goals in Afghanistan. Only about half (49%) say the U.S. will definitely or probably succeed while 39% say it will definitely or probably fail. In June, 59% said success in Afghanistan was at least probable.

Support for maintaining U.S. and NATO forces in Afghanistan also has slipped since June. Currently, 44% favor keeping troops in Afghanistan until the situation has stabilized while 47% want to remove troops as soon as possible. In July, opinion also was divided, but in June 53% favored keeping U.S. and NATO troops in Afghanistan while 40% wanted them removed as soon as possible.

The recent tensions on the Korean peninsula have drawn a tempered reaction from the public. Half (50%) of those who have heard about the recent North Korean artillery attack on a South Korean island say it is similar to other incidents that have happened from time to time in the past; fewer (41%) say the attack represents a major increase in hostilities.

Section 1: Issues Before the Lame-Duck Congress

Weeks before tax cuts passed during George W. Bush’s first term are set to expire, most of the public has heard either a lot (38%) or a little (43%) about the debate in Washington over how to handle these cuts. Much of this debate focuses on whether to extend all of the tax cuts or whether to extend the tax cuts only for annual income below a certain threshold – either $250,000 or $1,000,000.

When the threshold is set at $250,000, nearly half (47%) say they would like to see the cuts extended for income below $250,000 but allow the tax cuts to expire on income above that. A third (33%) would like to see all of the tax cuts remain in place, while just 11% say that all of the tax cuts should be allowed to sunset.

Public support for keeping some of the tax cuts while ending others declines when the threshold is set at $1 million; just 36% say they support this option. Support for maintaining all of the tax cuts (34%) or ending all of them (14%) remains nearly the same.

There continue to be substantial partisan differences in views about these tax cuts. About six-in-ten Democrats (61%) say they would like the tax cuts to remain in place for income below $250,000 but allow other cuts to expire, 18% would like all of the cuts to remain in place and 13% would like them all to expire.

By contrast, a majority of Republicans (53%) favor keeping all of the tax cuts in place; 28% of Republicans support maintaining them only for income below $250,000, and just 9% say they think all the cuts should be allowed to expire.

Mirroring overall public opinion, a plurality of independents (48%) want the cuts to be extended only on income below $250,000, a third (33%) want all the cuts to be extended, while 11% want all the cuts to end. The partisan patterns are similar when asked about the cuts above and below $1,000,000, although independent opinion is more divided; 34% favor keeping all of the cuts while 37% favor keeping them just for income below $1,000,000.

Support for Gays in Military Unchanged

Public support for allowing gays and lesbians to serve openly in the military has been largely unchanged following the release of a Defense Department study on the potential impact of gays serving openly. Currently, 59% favor allowing gays and lesbians to serve openly in the military, while 23% oppose this.

While support for allowing gays to serve openly has remained steady over the last several years, there has been some decline in opposition. Today, just 23% oppose allowing gays to serve openly, down four points from last month. And just 8% now say they strongly oppose allowing gays to serve openly; while that is little changed from November or February, it is the first time strong opposition has fallen below 10%.

Democrats overwhelmingly favor allowing gays to serve openly (74% favor, 13% oppose), while independents also favor this by nearly three-to-one (63% favor, 22% oppose). Republicans, by comparison, are divided (39% favor, 42% oppose). Partisan and demographic differences are little changed over the last month.

START Ratification Favored

The START treaty has not registered widely with the public: Just 16% say they have heard a lot about the treaty signed by Obama and the Russian president to reduce the number of nuclear weapons in both countries. Another 52% say they have heard a little about the treaty while nearly a third (31%) heard nothing at all.

Among those who have heard at least a little about START, many more favor than oppose its ratification by the Senate (54% to 24%). Fully 66% of Democrats and 60% of independents want the Senate to ratify START. Republicans are divided – as many oppose (37%) as favor (37%) the treaty’s ratification. The small proportion who have heard a lot about the treaty are somewhat more likely than those who have heard a little to favor its ratification by the Senate (62% vs. 51%).

Section 2: Views of the Parties, Congress & Obama

The public’s views of the Republican Party are little changed from September, before the party’s gains in the midterm election. Currently, 41% have a favorable opinion of the GOP while 52% have an unfavorable opinion. In September, 43% had a favorable view of the Republican Party and 49% had an unfavorable view.

Views of the Democratic Party have grown somewhat more negative since September – 45% now have a favorable opinion while 51% have an unfavorable opinion. This fall, slightly more held a favorable view than an unfavorable view (50% vs. 44%).

Even among Republicans, views of the GOP are little changed from September. And more independents continue to view the Republican Party unfavorably rather than favorably (53% vs. 36%).

Opinion about the Democratic Party has changed little since September among Democrats themselves (currently 83% favorable) and Republicans (8%). But opinion among independents has shifted – 54% now have an unfavorable opinion of the Democratic Party, up from 45% in September.

Opinion about Congress and Its Leaders

Views of Congress continue to be very negative. About three-in-ten (31%) have a favorable opinion of Congress, while twice as many (62%) have an unfavorable opinion. Across all partisan groups, more have an unfavorable than favorable view of Congress.

Opinion about Democratic congressional leaders is, on balance, more negative than positive. Only 29% have a favorable opinion of Nancy Pelosi while 55% have an unfavorable opinion. These views are little changed from June (27% favorable, 50% unfavorable).

About a quarter (23%) view Harry Reid favorably, compared with 39% who have an unfavorable view (38% have not heard of him or cannot rate him). Four years ago, opinion about Reid was more divided (17% favorable, 20% unfavorable) and far more had not heard of him or could not rate him (63%).

Opinion about Republican congressional leaders is divided. About three-in-ten (28%) have a favorable opinion of John Boehner, while 25% have an unfavorable opinion; nearly half (47%) have never heard of him or cannot rate him. Views of Boehner have improved since June when only 12% viewed him favorably, 22% unfavorably and 66% had never heard of him or could not provide a rating.

Similarly, about as many view Mitch McConnell favorably (22%) as unfavorably (27%). As is the case with Boehner, roughly half (51%) have never heard of McConnell or cannot rate him.

Independents have mixed views of GOP leaders – and very negative opinions of Democratic leaders. Nearly six-in-ten independents (58%) have an unfavorable opinion of Nancy Pelosi compared with just 20% who express a favorable opinion. More than twice as many independents have an unfavorable opinion of Reid (41%) than a favorable one (16%).

Overall, Hillary Clinton is viewed much more favorably than the Democratic leaders in Congress. About six-in-ten Americans (59%) view her favorably while 34% view her unfavorably. A majority of Democrats (84%) and independents (56%) have a favorable opinion of the Secretary of State, compared with 30% of Republicans.

Favorability of the President and First Lady

There has been little change in Barack Obama’s favorability rating from earlier this year. Currently, 54% have a favorable opinion of the president while 43% have an unfavorable opinion. Views of Obama grew more negative from January 2009 to June of this year, but have been steady since then.

As has been the case over the past year, Michelle Obama’s favorable ratings are higher than her husband’s. However, her ratings have slipped since the summer. In the current survey, 62% view the first lady favorably, down from 69% in June.

Opinion about Michelle Obama has grown more negative among independents: 57% now have a favorable opinion of her, down from 68% in June.

Michelle Obama’s favorability ratings also have declined among women. Currently, 64% of women have a favorable opinion of her, down 12 points from June. And while a majority of non-Hispanic whites (56%) view Michelle Obama favorably, that is down from 66% in November 2009.

Mixed Job Ratings for Obama

As has been the case for much of 2010, the public is closely divided on Obama’s overall performance as president. Currently 45% approve, while 43% disapprove. His approval rating has ranged between 44% and 49% since last December.

Obama continues to get generally good marks from his own party, with 77% of Democrats currently saying they approve of the job he is doing; just 14% disapprove. Independents are divided, with 42% approving and 43% disapproving. Republicans remain very negative about the president; just 11% approve and 81% disapprove.

The president’s ratings among key segments of his 2008 electoral coalition remain mostly unchanged from earlier in the year. The vast majority of African Americans (87%) say they approve of the job he is doing (just 7% disapprove), while half (50%) of young people ages 18 to 29 approve (32% disapprove). At 45%, Obama’s approval rating is slightly higher than two of his predecessors’ ratings at a comparable point in their presidencies – that is, a month a fter their party suffered a serious defeat in the midterm elections. In December of 1994, 41% of Americans approved of Bill Clinton’s performance, while 47% disapproved. Similarly, in a December 1982 Gallup poll, 41% approved of Ronald Reagan’s performance, while 50% disapproved.

Obama and His Party

Despite complaints from some liberals and Democratic leaders, most Democrats and Democratic-leaning independents do not think that the president is going along too much with Republican leaders in Congress. About a quarter (24%) of Democrats and Democratic leaners express this view; a plurality of Democrats (45%) say Obama is handling relations with GOP leaders about right while 15% say he is going along with Republicans too little.

But a significant minority of Democrats and Democratic leaners give Obama relatively low marks for his overall performance in standing up for the party’s traditional positions on such things as protecting the interests of minorities, helping the poor and needy, and representing working people.

About half of Democrats and Democratic leaners (54%) say he has done an excellent (17%) or good (37%) job of standing up for the party’s traditional positions; 44% say he has done only fair or poor.

Those who affiliate with the Democratic Party give Obama higher ratings for standing up for the party’s traditional positions than do those who just lean Democratic (60% vs. 43%). Among those who identify as Democrats, there is no difference between liberals and moderate and conservative Democrats.

Obama gets especially low ratings on standing up for the party’s positions from young people, a key segment of his 2008 coalition. Among Democrats and Democratic leaners younger than 30, fully 59% rate his performance as only fair or poor, while just 41% say it has been excellent or good.

Obama also gets relatively tepid marks from less educated Democrats, including those with only a high school education or less (50% only fair/poor) and those with only some college education (47% only fair/poor). Among college graduates, 64% rate his performance as excellent or good, while just 34% give him only fair or poor marks.

Section 3: Afghanistan and the Korean Crisis

Over the past six months, the public’s assessments of the U.S. military effort in Afghanistan have changed very little. Currently, 47% of Americans say the military effort there is going very (8%) or fairly well (39%). These perceptions were similar in both June (48% very/fairly well) and July (49%).

However, there has been a sharp decline in this period in the percentage saying the United States will succeed in achieving its goals in Afghanistan. Only about half (49%) now say the United States will definitely succeed (9%) or probably succeed (40%) in achieving its goals in Afghanistan; 39% say the U.S. will definitely (9%) or probably (30%) fail.

This is the most pessimistic the public has been on this question since it was first asked in January of 2009. Six months ago, a clear majority (59%) said the U.S. would achieve its goals, while 34% said it would fail.

The public also is less supportive of keeping U.S. and NATO troops in Afghanistan until the situation there has stabilized. In the new survey, 44% favor keeping the troops in Afghanistan while about as many (47%) say that the U.S. and NATO should remove their troops as soon as possible. In June, a majority (53%) said troops should remain until Afghanistan had stabilized; 40% said troops should be removed as soon as possible.

Support for keeping troops in Afghanistan has fallen sharply among Democrats. Today, just 35% of Democrats say troops should remain until the situation has stabilized, while a majority (57%) says troops should be removed as soon as possible. As recently as June, half of Democrats (50%) thought troops should stay in Afghanistan until the country had stabilized.

A majority of Republicans (59%) continue to say troops should remain in Afghanistan; just 33% say troops should be removed as soon as possible. Independents are divided (45% keep troops, 47% remove troops).

There are no significant partisan differences in predictions for the success of the U.S. goals in Afghanistan, with about half of Democrats (49%), Republicans (54%) and independents (48%) now saying the U.S. will definitely or probably be successful.

Korean Attack – More of the Same?

Most Americans (78%) say they have heard at least a little about the recent North Korean attack on a South Korea island; 38% say they have heard a lot while 40% say they have heard a little. About one-in-five (22%) heard nothing at all about the attack.

Among those aware of the attack, 50% say it is similar to other incidents that have occurred in the past, while fewer (41%) say this represents a major increase in hostilities.

There are no significant partisan differences in opinions about the seriousness of this incident – roughly half of Republicans (50%), Democrats (47%) and independents (53%) say the attack is similar to other incidents that have occurred from time to time in the past.

People who have heard a lot about the attack are more likely to say it represents a major increase in hostilities between North and South Korea. Nearly half (48%) of those who have heard a lot about the incident express this view, compared with 35% of those who have heard a little about it.

About the Surveys

Most of the analysis in this report is based on telephone interviews conducted December 1-5, 2010 among a national sample of 1,500 adults 18 years of age or older living in the continental United States (1,000 respondents were interviewed on a landline telephone, and 500 were interviewed on a cell phone, including 201 who had no landline telephone). Interviewing was conducted under the direction of Princeton Survey Research Associates International. Both the landline and cell phone samples were provided by Survey Sampling International. Interviews were conducted in English. For detailed information about our survey methodology, see: https://alpha.pewresearch.org/pewresearch-org/politics/methodology/

The combined landline and cell phone sample are weighted using an iterative technique that matches gender, age, education, race/ethnicity, region, and population density to parameters from the March 2009 Census Bureau’s Current Population Survey. The sample also is weighted to match current patterns of telephone status and relative usage of landline and cell phones (for those with both), based on extrapolations from the 2009 National Health Interview Survey. The weighting procedure also accounts for the fact that respondents with both landline and cell phones have a greater probability of being included in the combined sample and adjusts for household size within the landline sample. Sampling errors and statistical tests of significance take into account the effect of weighting. The following table shows the error attributable to sampling that would be expected at the 95% level of confidence for different groups in the survey:

In addition to sampling error, one should bear in mind that question wording and practical difficulties in conducting surveys can introduce error or bias into the findings of opinion polls.

In addition to the main survey, this report is supplemented with results from an omnibus survey. Telephone interviews were conducted December 2-5, 2010 among a national sample of 1,003 adults 18 years of age or older living in the continental United States (671 respondents were interviewed on a landline telephone, and 332 were interviewed on a cell phone, including 146 who had no landline telephone). Interviewing was conducted under the direction of Princeton Survey Research Associates International. Both the landline and cell phone samples were provided by Survey Sampling International. Interviews were conducted in English.

The combined landline and cell phone sample are weighted using an iterative technique that matches gender, age, education, race, Hispanic origin, region, and population density to parameters from the March 2009 Census Bureau’s Current Population Survey. The sample is also weighted to match current patterns of telephone status, based on extrapolations from the 2009 National Health Interview Survey. The weighting procedure also accounts for the fact that respondents with both landline and cell phones have a greater probability of being included in the combined sample and adjusts for household size within the landline sample. Sampling errors and statistical tests of significance take into account the effect of weighting. The following table shows the error attributable to sampling that would be expected at the 95% level of confidence for different groups in the survey:

In addition to sampling error, one should bear in mind that question wording and practical difficulties in conducting surveys can introduce error or bias into the findings of opinion polls.