Pew Research Center

FOR RELEASE NOVEMBER 11, 2010

Mixed Reactions to Republican Midterm Win

Public Less Happy Than After 2006 and 1994 Elections

FOR MEDIA OR OTHER INQUIRIES:

Communications Department
202.419.4372
www.pewresearch.org

RECOMMENDED CITATION

Pew Research Center, November 2010, "Mixed Reactions to Republican Midterm Win"

About Pew Research Center

Pew Research Center is a nonpartisan, nonadvocacy fact tank that informs the public about the issues, attitudes and trends shaping the world. It does not take policy positions. The Center conducts public opinion polling, demographic research, computational social science research and other data-driven research. It studies politics and policy; news habits and media; the internet and technology; religion; race and ethnicity; international affairs; social, demographic and economic trends; science; research methodology and data science; and immigration and migration. Pew Research Center is a subsidiary of The Pew Charitable Trusts, its primary funder.

© Pew Research Center 2026

Table of contents

  • About Pew Research Center
  • Mixed Reactions to Republican Midterm Win
  • Section 1: Reactions to the GOP Victory
  • Section 2: Views of the Parties, Prospects for Compromise
  • Section 3: Voters and Nonvoters Differ on Key Policies
  • Section 4: Campaign Outreach
  • About the Surveys

Mixed Reactions to Republican Midterm Win

Public Less Happy Than After 2006 and 1994 Elections

Overview

The public, voters and non-voters alike, has a subdued reaction to the Republican Party’s midterm election victory. Four years ago, the response to the Democrats regaining full control of Congress was far more
positive, as it was in 1994 when the GOP won a historic victory. Fewer people today say they are happy about the Republican victory, approve of the GOP’s plans for the future, and far fewer believe Republicans will be successful in getting their programs passed into law.

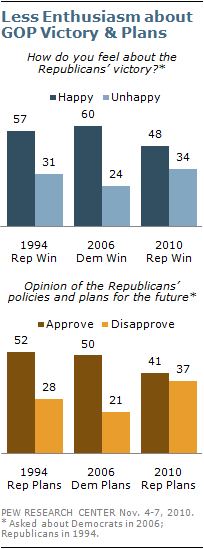
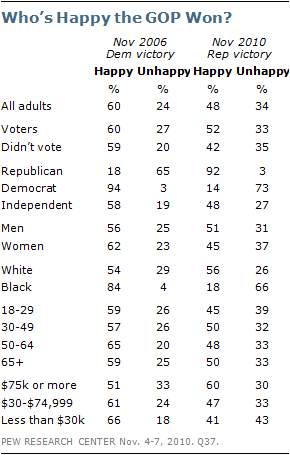
The latest national survey by the Pew Research Center for the People & the Press, conducted Nov. 4-7 among 1,255 adults, finds 48% saying they are happy that the Republican Party won control of the House while 34% are unhappy. Four years ago, 60% said they were happy the Democrats won full control of Congress, compared with just 24% who were unhappy. That mirrored the public’s reaction in December 1994 to the GOP winning control of Congress for the first time in 40 years (57% happy vs. 31% unhappy).

In the current survey, 52% of those who said they voted in the Nov. 2 election were happy with the outcome compared with 42% of non-voters. Still, more voters in 2006 – 60% – said they were happy with the Democrats’ victory.

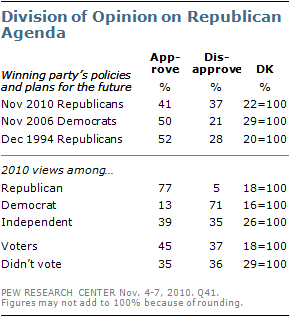
The public has a mixed reaction to the Republican policies and plans for the future: 41% approve, while nearly as many (37%) disapprove. Approval is somewhat greater among voters (45%) than among non-voters (35%). But on balance, both the general public and voters express less positive views of the GOP’s policies than they did of the Democrats’ proposals after the 2006 election.

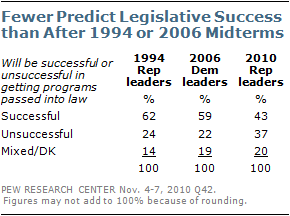
The public is skeptical that the GOP will be successful in getting its programs passed into law. About four-in-ten (43%) think they will be successful while 37% say they will be unsuccessful. Following the elections of 2006 and 1994, when the victorious parties gained majorities in both the House and Senate,
far more people thought they would be successful in enacting their agenda (59% in 2006, 62% in 1994).

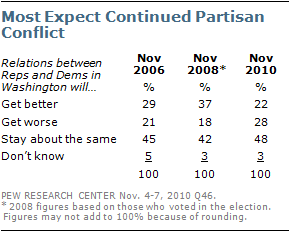
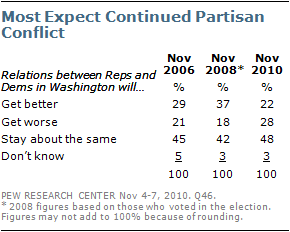
There is little optimism that, in the wake of the election, relations between the two parties will improve. Just 22% expect relations between Republicans and Democrats to get better in the coming year, 28% say they will get worse, while 48% say they will stay about the same as they are now. Two years ago, after the presidential election, 37% of voters expected partisan relations to improve and just 18% thought they would get worse.

Most Americans (55%) say that Republican leaders in Congress should work with Barack Obama, even if that disappoints some of their s
upporters. Even more (62%) want Obama to cooperate with GOP leaders, even if that disappoints some Democrats.

Independents want the two sides to work together – 57% say GOP leaders should cooperate with Obama while about as many (59%) say that the president should work with GOP leaders. But as many Democrats say Obama should stand up to Republican leaders (43%) as work with them (46%).

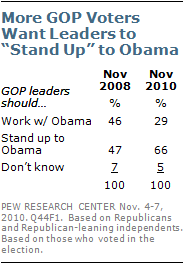
Republicans are even less interested in seeing their party’s congressional leaders work with Obama – and far fewer GOP voters want their party’s leaders to work with Obama than did so after the 2008 presidential election. Currently 66% of Republicans and Republican-leaning voters want GOP leaders to stand up to Obama, up from 47% shortly after the presidential election two years ago.
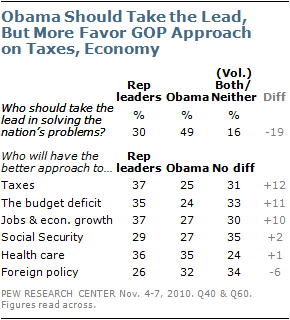
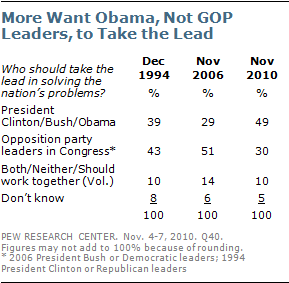
On balance, more Americans say that Obama, rather than Republican congressional leaders, should take the lead in solving the nation’s problems. Nearly half (49%) say President Obama should take the lead, compared with 30% who say GOP leaders. Following the 2006 election, opinion on this measure was nearly reversed – 29% said President George W. Bush should take the lead, while 51% said Democratic congressional leaders.

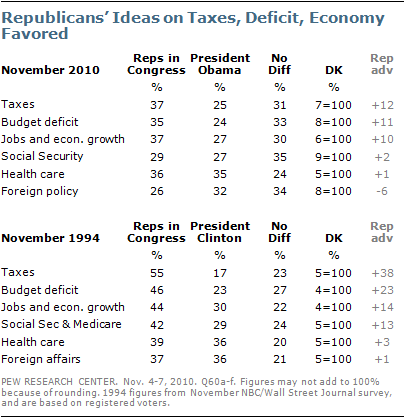
At the same time, however, the public says that Republicans will have a better approach than Obama on taxes, the budget deficit, and jobs and economic growth. On Social Security and health care, neither side’s approach is favored, while Obama holds a modest advantage on foreign policy.

Cut Government But…
Americans express more conservative views about the role of government than they did just two years ago. However, when it comes to the major policy decisions that will arise in coming months, the public is closely divided.

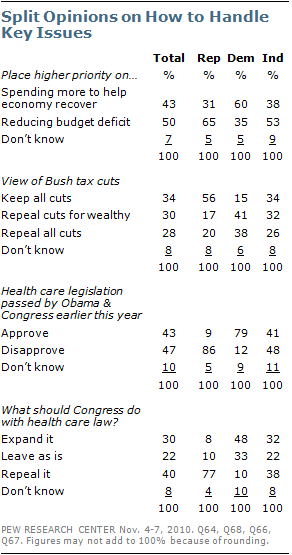
Nearly as many approve (43%) as disapprove (47%) of the new health care law, and opinions are split over what Congress should do about the legislation. Four-in-ten (40%) favor repealing the health care law, but a larger proportion (52%) says that the law should be expanded (30%) or kept as it is (22%).

Opinion about what to do with the tax cuts passed during the Bush administration is divided three ways: 34% favor keeping all of the tax cuts; 30% say the tax cuts for the wealthy should be repealed while other reductions stay in place; and 28% say all the tax cuts should be repealed.

More people say that if they were setting priorities for the government, they would place a higher priority on reducing the federal budget deficit (50%) than on spending more to help the economy recover (43%). Those who cast a midterm ballot are more likely than nonvoters to see reducing the budget deficit as a higher priority (55% to 41%).

Substantial partisan gaps are evident in attitudes toward all of these issues. However, Republicans are more unified than Democrats in their views of what to do about health care legislation and tax cuts. Fully 77% of Republicans favor repealing the health care bill, while Democrats are
split between expanding the measure (48%) and keeping it as it is (33%). And while 56% of Republicans favor keeping all the tax cuts, about as many Democrats favor repealing just the tax cuts for the wealthy (41%) as support getting rid of all the tax cuts (38%).

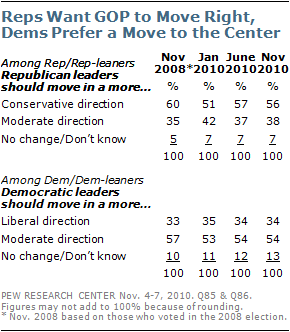
These attitudes reflect a continuing difference between Republicans and Democrats over the parties’ ideological directions. Over the past two years, Republican and Republican-leaning independents have consistently favored the GOP moving in a more conservative direction. Democrats and Democratic leaners have been just as consistent in their preference that their party move in a more moderate direction.

Republicans and Republican leaners who agree with the Tea Party overwhelmingly favor the GOP moving in a more conservative direction: 71% express this view compared with just 40% of Republicans who have no opinion of the Tea Party or disagree with it.

Lower Grades for Campaign 2010
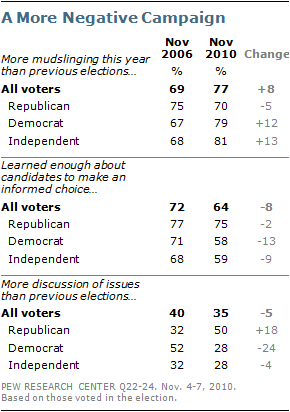
Voters express somewhat more negative views of the just-concluded campaign than they did of the 2006 midterm election. Fully 77% of voters say there was more negative campaigning or mud-slinging than in previous elections; 69% of voters expressed this view after the 2006 election.

Most voters (64%) say they learned enough to make an informed choice, but an even higher percentage said this in November 2006 (72%). And slightly fewer voters say there was more discussion of issues than did so after the 2006 election (35% today, 40% then).

Far more Republican voters (50%) say there was more discussion of issues than said that in 2006 (32%). By contrast, just 28% of Democratic voters said issues received m ore attention – down from 50% who said this after the Democrats regained control of Congress in 2006.

Other Important Findings

  • President Obama’s approval rating stands at 44%; an identical percentage disapproves of his job performance.
  • Roughly a third of Democrats (34%) say they would like to see other Democratic candidates challenge Obama for the party’s nomination in 2012. In December 1994, far more Democrats (66%) supported a primary challenge to President Clinton.
  • Just 16% of registered voters who attend religious services at least once a month say election information was available at their place of worship, down from 25% after the 2006 midterms.
  • The GOP continues to be seen as a leaderless party: 51% say they don’t know who leads the Republican Party while 14% volunteer that no one does. More now see John Boehner as the leader of the GOP (10%) than did so in September (4%).
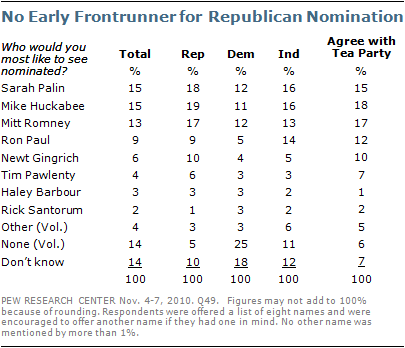
  • There is no clear front-runner for the 2012 Republican nomination for president: Sarah Palin (15%), Mike Huckabee (15%), and Mitt Romney (13%) all receive about the same levels of support.
Section 1: Reactions to the GOP Victory

Compared with previous changes in the balance of power in Congress, Americans are expressing a muted reaction to the GOP victories this year. Just under half (48%) say they are happy the Republican Party won control of the House, while 34% are unhappy. By contrast, after the Democratic Party’s victories in 2006, 60% of Americans said they were happy the Democrats had gained control of Congress, while just 24% were unhappy. Similarly, when Republicans

won in 1994, 57% of Americans said they were happy the GOP won, while 31% were unhappy.

Reflecting their more conservative leaning overall, Americans who voted in this year’s midterms offer more positive assessments of the GOP than those who did not vote. Among voters, 52% are happy the Republicans won control of the House, and 45% approve of their policies and plans for the future. By comparison, 42% of non-voters are happy Republicans won, and just 35% approve of their agenda.

In 2006, 58% of independents said they were happy about the Democrats’ congressional victory while 19% were unhappy. This year, by a somewhat smaller margin (48% to 27%), independents say they are happy about the GOP’s victory.

While, on balance, more Americans are happy than unhappy about the Republican House victory, the public is divided almost evenly over whether they approve (41%) or disapprove (37%) of the Republican policies and plans for the future. This stands in contrast to much broader approval of the Democratic Party’s agenda four years ago; following the 2006 election, 50% approved and just 21% disapproved of the party’s policies

and plans. Similarly, following the Republican Party’s victory in 1994, 52% of Americans said they approved of what the party was proposing, while 28% disapproved.

Americans who voted are somewhat more supportive of the GOP’s policy agenda – 45% approve of their policies and plans, compared with 35% among adults who did not vote. Independents are divided in their take on the Republicans, with 39% approving of the party’s agenda, 35% disapproving, and 26% uncertain.

Modest Expectations for GOP

The public is divided about how the new House Republican leaders will do in getting their programs passed into law; 43% believe they will be generally successful, 37% unsuccessful. This is a more guarded assessment than in past midterms when one party won majorities in both the House and Senate. After the Republican victories in 1994, 62% felt they would be successful in pursuing their agenda, just 24% unsuccessful. Following the Democrats’ victories in 2006, 59% thought they would be generally successful, 22% unsuccessful.

Most Republicans are upbeat about their party’s chances of getting things done. Roughly six-in-ten (59%) Republicans say GOP congressional leaders will be successful in getting their programs passed into law, while 23% think their party’s leaders will be unsuccessful. By contrast, a plurality of Democrats (46%) believe the GOP will be unsuccessful, though 36% think they will be successful. Independents are divided evenly: 40% think Republican leaders will be successful, 41% unsuccessful.

While they differ on how effective GOP leaders will be, Republicans and Democrats are equally skeptical about the chances of party relations improving. Just 23% of Republicans, 22% of Democrats and 23% of independents think relations between the parties will get better in the coming year. The plurality view across party lines is that relations will stay about the same as they are now.

This stands in contrast to the optimism Democrats expressed following Barack Obama’s election as president in 2008. Immediately following that outcome, 57% of Democrats who said they voted in the election thought relations between Republicans and Democrats in Washington would get better. Roughly a third (34%) of independent voters were optimistic about improved relations, while only 17% of Republican voters thought relations would improve.

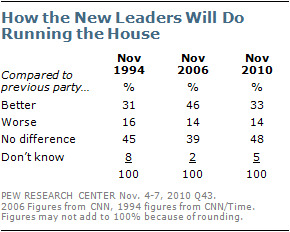
Just one-in-three (33%) Americans believe the Republicans will do a better job running the House of Representatives than the Democrats did, while nearly half (48%) think there won’t be much difference and 14% say they will do a worse job. This is roughly the same balance of opinion expressed following the Republicans’ 1994 victory. The public was more optimistic about how Democrats would do following their 2006 win. In a November 2006 CNN survey, 46% said the Democrats would do a better job of running the House than Republicans had been doing.

Who Should Take the Lead?

By a 49% to 30% margin, more Americans say that President Obama, rather than Republican leaders in Congress, should take the lead in solving the nation’s problems. Following the Democratic congressional victories in 2006, 51% wanted to see Democrats take the lead, and just 29% wanted to see George W. Bush take the lead. When Republicans won control of both the House and Senate in 1994, the public response was evenly divided – 43% wanted to see Republicans in Congress take the lead, while 39% wanted to see President Clinton take the lead.

Obama’s job approval rating is much higher today than Bush’s was after the 2006 election. Currently, 44% of the public approves of Obama’s job performance while the same percentage disapproves. In November 2006, just 32% approved of Bush’s job performance, compared with 58% who disapproved.

Yet, when it comes to economic policy, more Americans favor Republican policies than Obama’s policies. By a 37% to 27% margin, more Americans say that Republicans in Congress have the better approach as compared with Barack Obama, and the Republican advantage is similar when it comes to dealing with the budget deficit and taxes (on all three issu es, about a third say there is no difference between the two). The public is more evenly divided when it comes to who has the better approach to Social Security (29% Republicans in Congress, 27% Obama), and health care (36% Republicans, 35% Obama), and Obama has a slim edge when it comes to foreign policy.

The Republican advantages on these key issues are substantially narrower than the ones they enjoyed in the wake of the 1994 midterm election. In a November 1994 NBC/Wall Street Journal survey, Republicans held and overwhelming advantage over Clinton in terms of having better ideas on taxes (55% vs. 17%), the budget deficit (46% vs. 23%) and dealing with jobs and economic growth (44% vs. 30%).

Boehner More Visible

675-16

When asked who they think of as the leader of the Republican Party these days, John Boehner’s name comes to mind for more Americans than any other Republican. Still, only one-in-ten Americans (10%) volunteer Boehner as the party leader, while about half (51%) say they don’t know and 14% volunteer that nobody is. The only other name that comes up with any frequency is Sarah Palin – 6% see her as the leader of the party these days. Both Boehner and Palin are mentioned more often now than in 2009, while fewer Americans today cite John McCain as the leader of the Republican Party.

There are no significant differences in who Republicans and Democrats see as the GOP’s leader; 13% of Republicans and 11% of Democrats say Boehner, and 9% and 7%, respectively, name Palin.

Looking Ahead to 2012

When asked who they would most like to see nominated as the Republican Party’s candidate for President in 2012, roughly equal numbers choose Sarah Palin (15%), Mike Huckabee (15%) and Mitt Romney (13%). Another 9% say they would like to see Ron Paul nominated, 6% Newt Gingrich, 4% Tim Pawlenty, 3% Haley Barbour, and 2% Rick Santorum.

While Republicans are substantially more likely than Democrats or independents to pick a favored candidate at this point, the top names remain the same, with Palin (18% of Republicans), Huckabee (19%) and Romney (17%) leading the pack. The candidate preferences of Americans who agree with the Tea Party largely mirror the preferences of Republicans overall.

Most Americans (56%) say they would like to see other Democratic candidates challenge Barack Obama for the Party’s nomination for president in 2012, while 38% say they would not. This is substantially less support for an intra-party challenge than in December of 1994, when 76% said they would like to see a Democrat challenge Bill Clinton for the 1996 nomination. Democrats, in particular, have different feelings today compared with 1994. Then, Democrats supported seeing someone challenge Clinton by a 66% to 30% margin. Today, they oppose a challenge to Obama’s nomination by a 62% to 34% margin.

Section 2: Views of the Parties, Prospects for Compromise

In the wake of the election, Republicans are taking a more positive view of the job their party is doing in advocating its traditional positions. Currently, 40% of Republicans and Republican leaners say the GOP is doing an excellent or good job standing up for its traditional positions on issues like reducing the size of government, cutting taxes and promoting conservative social values; still, 52% say they are doing only a fair or poor job. In April 2009, just 21% of Republicans viewed the party’s performance positively, while 77% said it was doing only fair or poor.

Democrats, by contrast, offer somewhat less positive evaluations of their party’s performance than they did last year or earlier this year. Still, more Democrats (48%) than Republicans (40%) say their party does an excellent or good job advocating for its traditional positions. In April 2009 and February of this year, 55% of Democrats and Democratic leaners said the party was doing an excellent or good job standing up for traditional positions on such things as protecting the interests of minorities, helping the poor and needy, and representing working people.

Republicans Favor More Conservative Direction

When asked about the ideological direction of their party, Republicans want to see their party’s leaders move to the right, while Democrats think their leaders should become more moderate. A majority (56%) of Republicans and those who lean Republican would like the GOP leaders in Washington to move in a more conservative direction, while 38%would prefer a more moderate direction for the party.

By comparison, 34% of Democrats and those who lean to the Democratic Party want to see their party’s leaders move in a more liberal direction, while 54% favor a more moderate direction. Opinion among Republicans and Democrats has changed little since 2008.

These views are partly driven by the ideological composition of each party. Conservatives make up a far larger portion of the Republican Party’s supporters than liberals do of the Democratic Party (For more, see Voters Rate the Parties’ Ideologies, July 16, 2010).

However, there also continue to be substantial differences in the views of conservative Republicans and liberal Democrats regarding their parties’ ideological directions. Roughly three-quarters (76%) of Republicans and GOP leaners who describe their views as conservative want the party’s leaders to move in a more conservative direction. Liberal Democrats are more closely divided: 50% of liberal Democrats and Democratic leaners want their party’s leaders to move in a more liberal direction, while 41% favor a more moderate course. By contrast, comparable percentages of moderate and liberal Republicans (70%) and conservative and moderate Democrats (64%) favor a more moderate course for their parties.

Compromise a Divisive Goal

The public is divided about the value of political compromise. While 42% say that they most admire political leaders who make compromises, 45% say they most admire political leaders who stick to their positions without compromising.

There are partisan differences in views about whether political leaders should compromise. A majority of Republicans say they most admire politicians who stick to their positions, rather than make compromises (55% vs. 33%). These opinions are little changed from September.

Democrats are now evenly divided – 46% prefer political leaders who make compromises while 45% prefer leaders who stick to their positions. In September, more favored politicians who compromise over those who stick to their positions (by 54% to 39%).

About half (49%) of independents admire political leaders who make compromises with people they disagree with, while 40% admire politicians who stick to their positions without compromising. Two months ago, a majority of independents (53%) said they preferred politicians who stick to their positions over those who compromise (40%).

A majority of the public wants Republican leaders and Barack Obama to work together next year. More than half (55%) say Republican leaders in Washington should try as best they can to work with Barack Obama to accomplish things, even if it means disappointing some groups of Republican supporters, while 38% say they should stand up to Obama on issues that are important to Republican supporters, even if less gets done in Washi ngton.

There is even more public support for Barack Obama to work with Republican leaders next year. By a 62% to 27% margin more would like to see Barack Obama work with Republican leaders in Washington, even if it means disappointing some Democratic supporters, than stand up to Republicans on issues that are important to Democrats. Independents, in particular, would like to see both sides working together: 57% say Republican leaders should try to work with Obama and 59% want Obama to try as best he can to work with Republican leaders.

Among Republicans, there is a clear preference for holding steadfast to their positions; 71% think their leaders should stand up to Obama even if less gets done. And 89% say Barack Obama should work with GOP leaders, even if it means disappointing some groups of Democratic supporters.

But Democrats are divided; 46% say Obama should work with Republican leaders while 43% say he should stand up to them. About three-quarters (77%) think Republicans should work with Obama, even if it means disappointing some GOP supporters.

The Tea Party and GOP’s Future

Republicans and Republican leaners who agree with the Tea Party movement are more likely than other Republicans to support a more conservative direction for the GOP, to admire politicians who stick to their positions, and to say that Republican leaders should stand up to Obama.

About seven-in-ten (71%) Tea Party Republicans would like to see GOP leaders move in a more conservative direction, compared with 40% of Republicans who disagree with the movement or have no opinion of it. There was a similar pattern in June with Tea Party Republicans more likely to prefer Republican leaders move to the right.

More Republicans who agree with the Tea Party also say they admire political leaders who stick to their positions rather than compromise. Similarly, 69% of Tea Party Republicans say GOP leaders should stand up to Obama, even if it means less gets done in Washington. This compares with a smaller majority (55%) of Republicans who disagree with the Tea Party or have no opinion of the movement.

There is no difference in the views of the GOP’s advocacy for its traditional positions among Republicans who agree with the Tea Party and those who do not. Slightly more than half in each group says GOP leaders are doing only fair or poor n standing up for the party’s traditional positions

Is Tea Party Separate from the Republican Party?

Overall, more people view the Tea Party movement as a separate movement from the Republican Party (47%), rather than as part of the Republican Party (38%); 16% are unsure.

A majority of Republicans (54%) say the Tea Party is separate and independent, while 36% say it is part of the Republican Party. By a 55% to 32% margin, more independents also see the Tea Party movement as separate and independent rather than part of the Republican Party. But more Democrats say it is part of the Republican Party (48%) than say it is a separate and independent movement (33%).

About six-in-ten (59%) of those who agree with the Tea Party movement say it is a separate and independent movement. A comparable percentage of those who disagree with the movement (61%) say it is part of the Republican Party.

The public expresses mixed views about whether the Republican Party is paying too much, too little or the

right amount of attention to the ideas and positions of the Tea Party. A quarter (25%) says the GOP is paying the right amount of attention, 22% say too much and 28% too little.

About as many Republicans say their party is paying the right amount of attention (39%) to the Tea Party as say it is paying too little attention (31%); only 11% say too much. By contrast, more Democrats say the GOP is paying too much attention to the Tea Party’s ideas and positions (34%), than say too little (23%) or the right amount of attention (16%). More independents say too little attention is being paid to the Tea Party rather than too much (31% vs. 21%); 23% say the GOP is paying the right amount of attention.

Among those who agree with the Tea Party, 45% say the GOP is paying the movement too little attention, while 37% say its ideas and positions are getting the right amount of attention. About half (51%) of those who disagree with the movement say Republicans are paying too much attention to the ideas and positions of the Tea Party.

As has been the case all year, there are substantial partisan and ideological differences in views of the Tea Party. About half of Republicans (52%) agree with the movement, while few disagree. Fully 64% of conservative Republicans agree with the Tea Party movement, compared with just 28% of their moderate and liberal counterparts.

By a wide margin, more Democrats disagree with than agree with the Tea Party movement (43% vs. 5%); about half of Democrats (52%) have no opinion of the Tea Party movement or offer no response. Among liberal Democrats, 57% disagree with the Tea Party while just 4% agree.

Section 3: Voters and Nonvoters Differ on Key Policies

A core theme of Republican campaigns across the country this year was a promise to reduce the size and reach of the government. The poll finds most voters in agreement with this sentiment, but less consensus on specific aspects of the Republican agenda. Moreover, the views of voters and nonvoters diverge significantly, with nonvoters expressing more support for government action.

A majority of voters in the poll (56%) agree more with the statement that government is doing too many things better left to businesses and individuals, while just 38% say government should do more to solve problems. Fully eight-in-ten voters who supported Republicans (80%) say government is doing too much, compared with just 26% of those who voted Democratic. Among nonvoters, the sentiment is nearly reversed, with 53% wanting more from government and just 34% saying that government is doing too much.

Consistent with this philosophical divide over the scope of government, a 55% majority of voters (including 72% of those voting Republican) place a higher priority on deficit reduction than on spending to help the economy recover. A plurality of nonvoters in the poll (49%) favor more government spending.

Overall opinion on the key issue of health care reform is divided, with 43% approving of the legislation passed earlier this year and 47% disapproving. Among voters, roughly half (51%) express disapproval (including a whopping 85% of those who voted Republican), compared with just 41% who approve of the legislation. Among non-voters, opinion is more divided (47% approval vs. 40% disapproval).

Voters provided little clear guidance for future health care policy. Although a plurality favor repeal of the health care law (46%), just as many want to keep it as is or expand it (26% favor expanding it, 21% favor keeping it as is). Support for repeal is lower among nonvoters. Just 28% favor repeal; 36% would like to see the measure expanded and 25% prefer keeping it as it is.

Nearly three-quarters of voters favor maintaining the Bush administration’s tax cuts for most people. Still, fewer than half (40%) want to see the tax cuts maintained for everyone; 33% want them repealed for the wealthy and 22% want them repealed altogether. Among nonvoters, the plurality view is to repeal all of the cuts (39%), while 24% support repe al of the cuts only for wealthy taxpayers; 23% favor maintaining the cuts for everyone.

On all of these questions about future policy, as well as on the overall scope of government, respondents who are registered to vote but did not turn out in the election are at least as likely as those who are not registered to offer pro-government opinions. For example, 55% of nonvoters who are registered to vote say government should do more to solve problems, compared with 51% among those not registered to vote.

Free trade agreements did not attract as much attention in the campaign as health care reform or the deficit, but divisions between voters and nonvoters exist on this issue as well. Half of voters (50%) say that, in general, free trade agreements such as NAFTA and the policies of the World Trade Organization have been a bad thing for the United States. Among nonvoters, however, just 35% agree – and 44% say they have been a good thing for the country. Among voters, the balance of opinion about free trade agreements was negative especially among those who voted Republican; 57% say free trade agreements have been a bad thing for the U.S., compared with just 28% who say they have been a good thing. Opinions are more divided among those who voted Democratic, with 41% saying free trade agreements have been a bad thing and 33% saying they have been a good thing.

Section 4: Campaign Outreach

Nearly eight-in-ten registered voters (78%) say they received printed mail from candidates or political groups during the 2010 election campaign. Nearly seven-in-ten (69%) received pre-recorded telephone calls about the election. The number of people receiving recorded telephone calls grew steadily over the final few weeks of the campaign, increasing from 55% in mid-October, to 60% by late October, to 69% by election day.

One-third of registered voters (33%) received a call from a live person, and 31% received email from candidates or political groups. Nearly one-quarter of registered voters (23%) were visited at home by someone talking about the elections. Fewer than one-in-ten (7%) received a campaign related text message on a cell phone.

Campaign contacts with voters were greater in 2010 than in 2006. This year 71% of voters received a telephone call (either recorded or from a live person) about the 2010 election. By comparison, as of election weekend in 2006, 50% of registered voters said they had been contacted over the phone by a candidate or political group. And the 31% of registered voters who received political messages via email in 2010 is more than twice the number who had received political email just prior to the 2006 election (14%). In total, 89% of registered voters were contacted by a campaign in 2010 via printed mail, email, telephone, text message or in person. That compares with 58% of registered voters who had received a telephone call, a live visit or an email just prior to the 2006 election.

Just over one-in-five registered voters (22%) say they were urged to vote for Republican candidates when contacted about the 2010 election, higher than the number who were urged to vote Democratic (16%). One-third of registered voters (32%) said they were contacted on behalf of both Republican and Democratic candidates.

Like the earlier surveys conducted during the 2010 campaign, the poll shows that younger voters (those under 30) were less likely than older voters to report being contacted by candidates and campaigns. Half of registered voters under 30 (50%) received a pre-recorded telephone call about the campaign, compared with nearly two-thirds or more in all older age groups. And 54% of those under 30 received printed mail about the campaign, far lower than the eight-in-ten or more in older age groups who received campaign literature through the mail. Younger voters were also less likely than older voters to have received campaign text messages; only 2% of registered voters under 30 received political texts, compared with 9% among those age 30-49, 7% among those age 50-64, and 10% among those age 65 and older.

More men received campaign email, but women were more likely to receive pre-recorded telephone calls. More white registered voters received printed mail and pre-recorded phone calls than black registered voters, but the differences are smaller for other types of campaign contact. College graduates were more likely to receive printed mail and email than those with less education, but not more telephone calls, visits or text messages.

Personal Involvement in the Campaign

One-quarter of registered voters (26%) visited a candidate’s website or followed a candidate through email, Facebook or Twitter. Other kinds of campaign involvement were less common; 13% of registered voters donated money to a candidate or campaign (compared with 17% of registered voters who said the same just prior to the 2008 presidential election), 11% attended a campaign event (similar to the 12% who said this in 2008), and 7% volunteered their time to help a campaign.

Slightly more Republicans than Democrats attended a campaign event (16% vs. 10%), but differences between the parties are smaller on other measures of campaign involvement.

Visiting campaign websites was most common among college graduates (38%), followed by those with some college education (31%). Among those with a high school education or less, only about one-in-eight (12%) used the internet to follow the campaign. College graduates are also more likely than those with less education to have donated money to a political cause and to have volunteered their time for a candidate or campaign. The survey also shows that by several measures men were more involved in the campaign than women. Men were more likely to follow the election online (30% vs. 23%), contribute money to a campaign (16% vs. 10%) and attend a campaign event (14% vs. 8%).

Seven-in-ten registered voters (70%) say they talked a lot (33%) or some (37%) about the campaign with family and friends. One-in-five (19%) say they did not talk much about the campaign, and 10% say they did not discuss the campaign at all. Consistent with other polling this year that showed a large enthusiasm gap benefiting Republicans, fully eight-in-ten Republicans (81%) talked frequently about politics with friends and family during the campaign, compared with 71% of independents and 62% of Democrats. Talking about the campaign was also more common among whites than blacks (74% vs. 61% saying a lot or some), and among college graduates than those with less education.

Politics in the Pulpit

Compared with 2006, fewer voters encountered information on parties or candidates in their house of worship. Among registered voters who attend worship services at least once a month, just 16% say election information was available, compared with 25% in 2006. Only 13% say their place of worship provided information about state and local ballot initiatives or constitutional amendments. Even fewer (6%) say their clergy urged them to vote in a particular way, with similar numbers saying they were encouraged to support Republican and Democratic candidates (2% vs. 1%).

Among white evangelical Protestants, 16% of churchgoers say campaign information was made available at their place of worship, down from 30% in 2006. Similarly, far fewer Catholics say these materials were made available at their churches this year (10%) than in 2006 (21%). In 2006, both white evangelicals and Catholics heard significantly more than white mainline Protestants about politics in their churches; in 2010, differences between these groups have essentially disappeared.

Outside of encountering political information in churches and houses of worship, only 6% say they were contacted by

religious groups about the election campaign, a number that differs little across religious groups or levels of worship attendance. For instance, 7% who attend religious services weekly were contacted by a religious group, similar to 4% of those who attend monthly or yearly and 7% of those who attend seldom or never. In addition, 6% of Republicans, Democrats, and independent voters alike were contacted by religious groups about the election.

About the Surveys

Most of the analysis in this report is based on telephone interviews conducted November 4-7, 2010 among a national sample of 1,255 adults 18 years of age or older living in the continental United States (828 respondents were interviewed on a landline telephone, and 427 were interviewed on a cell phone, including 189 who had no landline telephone). Interviewing was conducted under the direction of Princeton Survey Research Associates International. Both the landline and cell phone samples were provided by Survey Sampling International. Interviews were conducted in English. For detailed information about our survey methodology, see: https://alpha.pewresearch.org/pewresearch-org/politics/methodology/

The combined landline and cell phone sample are weighted using an iterative technique that matches gender, age, education, race/ethnicity, region, and population density to parameters from the March 2009 Census Bureau’s Current Population Survey. The sample also is weighted to match current patterns of telephone status and relative usage of landline and cell phones (for those with both), based on extrapolations from the 2009 National Health Interview Survey. The weighting procedure also accounts for the fact that respondents with both landline and cell phones have a greater probability of being included in the combined sample and adjusts for household size within the landline sample. Sampling errors and statistical tests of significance take into account the effect of weighting. The following table shows the error attributable to sampling that would be expected at the 95% level of confidence for different groups in the survey:

In addition to sampling error, one should bear in mind that question wording and practical difficulties in conducting surveys can introduce error or bias into the findings of opinion polls.

Chapter Four of the report, which includes a discussion of political mobilization by religious groups, was analyzed by the Pew Research Center’s Forum on Religion & Public Life.

In addition to the main survey, this report is supplemented with results from an omnibus survey. Telephone interviews were conducted November 4-7, 2010 among a national sample of 996 adults 18 years of age or older living in the continental United States (666 respondents were interviewed on a landline telephone, and 330 were interviewed on a cell phone, including 160 who had no landline telephone). Interviewing was conducted under the direction of Princeton Survey Research Associates International. Both the landline and cell phone samples were provided by Survey Sampling International. Interviews were conducted in English.

The combined landline and cell phone sample are weighted using an iterative technique that matches gender, age, education, race, Hispanic origin, region, and population density to parameters from the March 2009 Census Bureau’s Current Population Survey. The sample is also weighted to match current patterns of telephone status, based on extrapolations from the 2009 National Health Interview Survey. The weighting procedure also accounts for the fact that respondents with both landline and cell phones have a greater probability of being included in the combined sample and adjusts for household size within the landline sample. Sampling errors and statistical tests of significance take into account the effect of weighting. The following table shows the error attributable to sampling that would be expected at the 95% level of confidence for different groups in the survey:

In addition to sampling error, one should bear in mind that question wording and practical difficulties in conducting surveys can introduce error or bias into the findings of opinion polls.