More Conservative, More Critical of National Conditions
About Pew Research Center
Pew Research Center is a nonpartisan, nonadvocacy fact tank that informs the public about the issues, attitudes and trends shaping the world. It does not take policy positions. The Center conducts public opinion polling, demographic research, computational social science research and other data-driven research. It studies politics and policy; news habits and media; the internet and technology; religion; race and ethnicity; international affairs; social, demographic and economic trends; science; research methodology and data science; and immigration and migration. Pew Research Center is a subsidiary of The Pew Charitable Trusts, its primary funder.
More Conservative, More Critical of National Conditions
Overview
For the third national election in a row, independent voters may be poised to vote out the party in power. The Republican Party holds a significant edge in preferences for the upcoming congressional election among likely voters, in large part because political independents now favor Republican candidates by about as large a margin as they backed Barack Obama in 2008 and congressional Democratic candidates four years ago.
The survey by the Pew Research Center for the People & the Press was conducted Aug. 25-Sept. 6 among 2,816 registered voters, including 2,053 voters considered the most likely to vote on Nov. 2. The survey finds that 50% of likely voters say
they will vote for the Republican in their district, while 43% favor the Democratic candidate.
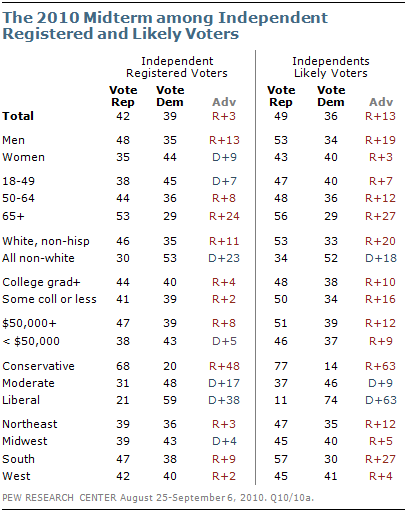
Republican and Democratic voters overwhelmingly support their party’s candidates. The GOP’s advantage comes as a result of their 49% to 36% lead among independent and other non-partisan voters who are likely to vote in November.
The Republican Party’s overall lead is only evident when the sample is narrowed to likely voters. Among all registered voters, preferences are evenly divided. The race also is even among all independents and other non-partisans, but the GOP’s advantage swells to 13 points among independent likely voters.
Uncharacteristically, independent voters, who typically are not highly engaged by midterm elections, are now more likely than Democrats to say they are giving a lot of thought to this one. And they are about as likely as Democrats to say they definitely will vote; during the fall of 2006, far more Democrats than independents said they definitely would vote.
The relatively high level of independent engagement this year has come among those who plan to vote Republican. Fully 64% of independents who plan to vote for the Republican in their district are giving a lot of thought to the election, compared with just 40% of independents who plan to vote for a Democrat.
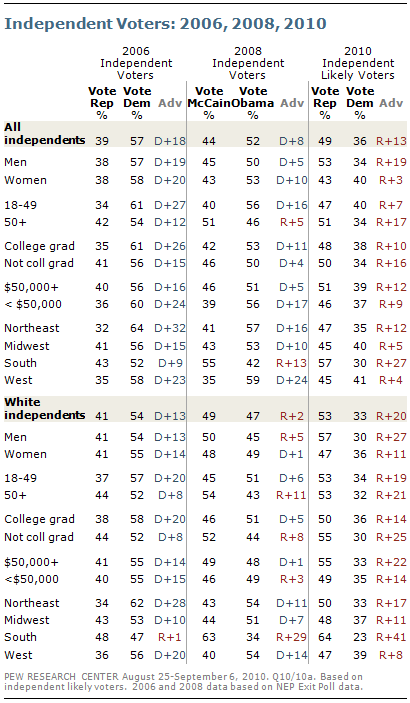
Independents’ voting preferences have changed considerably since the last two elections. Just two years ago, Obama held an eight-point lead among independents, according to exit polls by the National Election Pool. The shift since the 2006 midterm, when Democrats held an 18-point advantage among independents, according to the exit poll, has been even more dramatic.
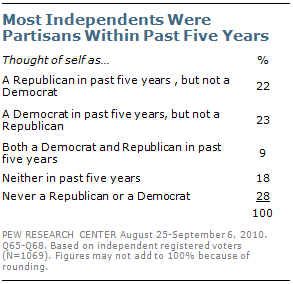
The propensity of independents to reject both parties in a relatively short period of time may in part reflect the fact that the ranks of independents have swelled in recent years with voters who have rejected party labels themselves. Underscoring the fluidity in party identification, many of today’s independents were themselves partisans not so long ago. More than half of independents say they have been a Democrat (23%), a Republican (22%), or both (9%), in the past five years.
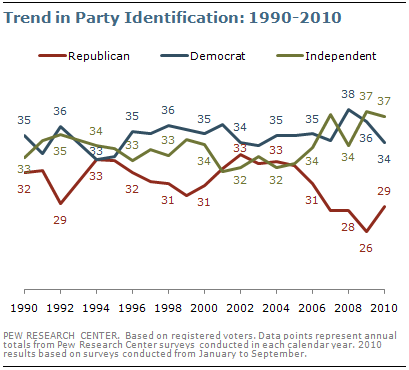
Independents are the largest group of voters – 37% of registered voters are independents or other non-partisans, 34% are Democrats and 29% are Republicans. Just two years ago, 34% were independents, while 38% of voters identified as Democrats and 28% as Republicans.
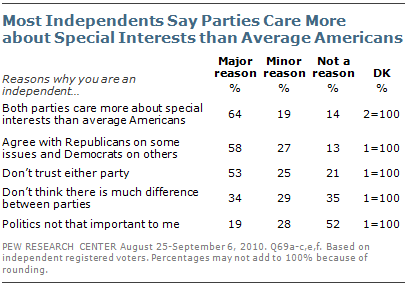
Independents have mixed views of which party can do better on major issues – but are distrustful of both. When asked why they are independents, fully 64% cite as a major reason that “both parties care more about special interests than about average Americans.” And 53% point to a lack of trust in either party as a major reason they think of themselves as an independent in politics.
While the survey finds indications that independents will vote Republican this year, they do not have a strong allegiance to the GOP. Rather, they are motivated by highly negative feelings about the government’s performance and harsh judgments about the political status quo. Just 35% express approval of their own congressional representative, and they are as likely as Republicans to say that their own incumbent does not deserve reelection. But unlike Republicans and Democrats, a majority of independents say that which party controls Congress will not be a factor in their vote.
By 44% to 29%, more independent voters say the Republican Party rather than the Democratic Party can better reduce the budget deficit; the GOP also now leads by a 42% to 31% margin among independent voters as better able to manage the federal government. Yet far more independents (49%) say the Democratic Party “is more concerned with the needs of people like me” than say that about the GOP (32%). And on the important dimension of which party can bring about the changes the country needs, as many prefer the Democratic Party (37%) as the Republican Party (36%).
When asked which party comes closer to their views on major issues, independent voters prefer Republicans on foreign policy and economic issues but are more divided on social issues. More say the Republican Party comes closer to their views on foreign policy and national security (by 44% to 30%), but the GOP’s lead is more modest on economic issues (43% to 34%). And slightly more independents say the Democratic Party (39%) rather than the Republican Party (33%) better reflects their views on social issues such as gay marriage and abortion. In this regard, more than twice as many independent voters than Republican voters favor allowing gays and lesbians to marry legally (45% vs. 20%).
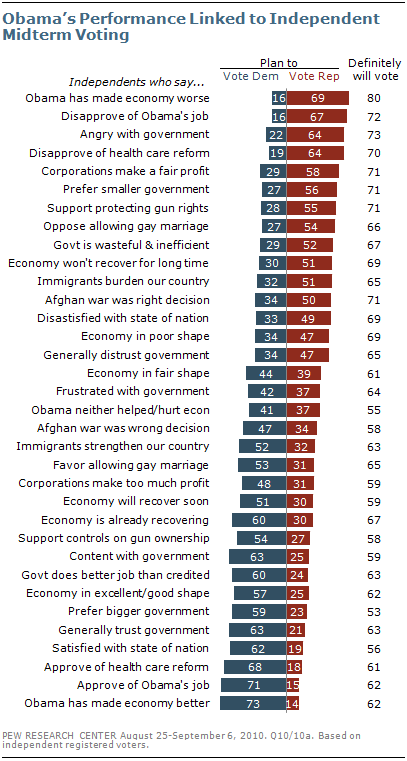
All things considered, support for the Republicans and political energy among independents is closely linked to disillusionment with Obama’s policies and the president himself. Fully 69% of independent voters who say Obama’s policies have made the economy worse favor the Republican candidate in their district – and 80% say they will definitely vote. Disapproval of the president’s job performance, anger at the federal government and opposition to the health care legislation also are closely associated with support for Republican candidates. Independents who express these views also are highly likely to vote.
Conversely, support for Obama and his policies is strongly associated with independents’ support for Democratic candidates; in fact, 73% of independents who say Obama’s policies have improved the economy plan to vote Democratic. But far fewer of those who express this opinion say they will definitely vote compared with independents who take a negative view of the impact of Obama’s policies (63% vs. 80%).
Independent Voters: Diverse Groups with Divergent Views
While this study and other surveys measure the “independent vote,” there is a considerable degree of diversity among independents, which is not surprising given that most are relatively recent refugees from the two major parties. This survey identifies four groups of independent voters that are distinguished by their basic political beliefs – two groups that favor Republican candidates, one that favors Democratic and another that only leans Democratic:
Shadow Republicans (26% of independent voters) are strongly anti-government, but they are somewhat less critical of the political system than are the Disaffecteds, the other-GOP-leaning group of independents. Shadow Republicans are relatively affluent and well-educated, older and male. They support the Republican candidate in their district by 66% to 18%. Fully 79% say they will definitely
vote in November, which is about the same as among GOP partisans (83%). As many Shadow Republicans as Republican voters agree with the Tea Party. But they have mixed opinions of the Republican Party – just 52% have a favorable view of the GOP.
Disaffecteds (16% of independent voters) have been hard hit by the recession and are highly financially stressed. Anti-government and anti-politician, these quick to anger blue-collar voters have been mainstays of Pew Research typology groupings for decades. Disaffecteds divided their votes between Obama and McCain in 2008; today, 50% of Disaffecteds say Obama’s policies have made the economy worse and 60% disapprove of the health care bill enacted earlier this year.
Shadow Democrats (21% of independent voters) hold positive views of government and are not very critical of the political system. They support Obama and his policies, and have very positive views of the Democratic Party. Shadow Democrats are younger than other independent groups and are racially and ethnically diverse – a quarter are black or Hispanic. Shadow Democrats support Democratic candidates by as large a margin as the two GOP-leaning groups favor Republican candidates.
Doubting Democrats (20% of independent voters) are not especially anti-government, but they are deeply anti-business and are highly critical of elected officials and both political parties. In many respects, they are as cynical as the Disaffecteds. Doubting Democrats are less affluent and less racially and ethnically diverse than are Shadow Democrats. While they voted for Obama over McCain by a wide margin, they are now critical of Obama and the Democratic Party. Just 23% of Doubting Democrats say Obama’s policies have made economic conditions better – only about half the proportion of Shadow Democrats and Democratic voters (50% each). As many Doubting Democrats say the Republican Party can better reduce the deficit as say the Democratic Party.
There also is a fifth group of independent voters, the Disengaged (17% of independent voters), which is disproportionately made up of younger and less educated people. For the most part, the Disengaged are essentially political bystanders –just 21% say they definitely will vote this fall, far and away the lowest percentage among the independent groups.
How Independents Have Changed
Independents today are clearly more conservative than they were four years ago, particularly with respect to the role of government. Not only do more describe themselves as conservative, but more support smaller government, and there is more distrust and anger toward government generally.
While this ideological tide among independents benefits the GOP, there is a broader rejection of the party in power that also is influencing independent support for Republican candidates. Given their detachment from the parties and general skepticism about politics, independents’ views of president’s and the parties’ performance can and do change quickly. In this regard, the independent swing toward the GOP in 2010 has as much, if not more, to do with views of performance than with shifting ideological preferences.
Currently, independent voters rate the parties about evenly when it comes to which one could better improve
the job situation (40% Republican Party, 35% Democratic Party). Four years ago, the Democrats led by 19 points (43% to 24%) as the party better able to improve the job situation. Independents views of which party can better reduce the deficit have flipped since 2006 – the Republican Party is now favored by 15 points; in 2006, the Democrats led by 28 points.
On perhaps the most important measure of performance – managing the government — more independent voters currently now say the Republican Party could do better, by 42% to 31%. In 2006, by about the same margin (38% to 26%), more independent voters said the Democratic Party could better manage the federal government.
The Republican Party now gets about the same favorable rating among independent voters as does the Democratic Party (45% vs. 44%). Four years ago, 46% of independent voters viewed the Democratic Party favorably compared with just 36% who had a favorable opinion of the GOP.
More generally, independent voters are even more dissatisfied with national conditions than they were in 2006. Fully 76% of independent voters say they are not satisfied with the way things are going in the country, up from 67% four years ago.
Independents and the Tea Party
About as many registered voters say they agree with the Tea Party movement as disagree (29% vs. 26%). Independent voters are more likely to say they agree with the Tea Party movement than disagree (by 30% to 22%).
Among likely voters, more agree than disagree with the Tea Party (36% vs. 29%). And among independent likely voters, 39% agree with the Tea Party, compared with 26% who disagree.
Other Important Findings
The proportion of independent voters or non-partisans is now at 37%, one of the highest levels in the past 20 years of Pew Research Center polling. The share of independent voters has grown from 34% of registered voters in 2008.
The Democratic Party’s advantage in party identification among registered voters has narrowed from a 10-point gap last year to a five-point gap in 2010 as Democrats have lost adherents and the Republican Party has gained supporters.
There has been little change in voting intentions over the course of the year. Registered voters have been closely divided in their preferences, while Republicans have enjoyed an advantage among voters most likely to cast a ballot in November.
As in previous midterms, older independents are more likely to vote Republican than are voters younger than 50, and independent men are much more inclined to cast a GOP ballot than they were four years ago.
Obama’s job approval rating among independent voters stands at just 39%; 50% disapprove of the president’s job performance. Still, Obama’s rating among independent voters is higher George W. Bush’s in September 2006 (29% approve/57% disapprove).
Section 1: The Midterm Vote
All year, voters’ preferences in the upcoming midterm elections have been closely divided. That remains the case today – in the new survey, 47% of registered voters say that if the election were held today they would vote for the Democratic candidate or lean to the Democrat, while 44% would vote for the Republican or say they lean Republican.
At this stage in the 2006 midterm, Democrats held an 11-point advantage in the generic congressional ballot (50% to 39%). At comparable points in each of the previous three midterms, preferences were almost evenly split. In September 1994, two months before Republicans would win control of Congress from the Democrats, 48% said they expected to vote for the Republican candidate in their district; 46% said they would vote for the Democrat.
While there is continuing parity in the race among registered voters, the Republican Party holds a seven-point lead among likely midterm voters: Half of them say they intend to vote for the Republican candidate in their congressional district, while 43% say they will cast ballots the Democrat.
Likely Voters Favor the GOP
Those demographic and ideological groups that are more likely to vote also are more likely to vote Republican. These include older voters, wealthier voters and more conservative voters. Groups that are more likely to favor Democrats, including the young and the less well off, also are less likely to head to the polls.
Nearly half of all registered voters (49%) are younger than 50, and 16% are younger than 30. However, due to lower engagement and enthusiasm, those under 50 make up a smaller share (42%) of likely voters, and just 11% of likely voters are younger than 30.
Not only are there fewer younger people in the likely electorate, but the engagement gap between Republican- and Democratic-oriented voters means the Democratic Party’s lead among younger registered voters disappears when the focus turns to likely voters. Registered voters under 50 favor the Democratic candidate by 10 points (51% to 41%), but likely voters under 50 are split almost evenly (48% Republican vs. 46% Democratic). Among voters older than 50, an essentially even race among registered voters, turns into a nine-point Republican lead (51% to 42%) among likely voters. (For a detailed breakdown of registered and likely voters across various demographic groups, see the table on pg.46).
Voters with family incomes of less than $30,000 annually, a strong Democratic group, also comprise a smaller share of likely voters (19%) than of registered voters (25%). The Democrats hold a 12-point lead among likely voters in this income category (53% to 41%), but among registered voters with incomes of less than $30,000 their lead is much larger (57% to 34%).
Those who say they agree with the Tea Party movement make up 29% of registered voters but a larger share of likely voters (36%). Likely voters those who agree with Tea Party plan to vote Republican by 88% to 7%, which is little changed from the margin among registered voters (85% to 10%). Those who have never heard of the Tea Party or have no opinion of the movement make up a smaller share of likely voters (35%) than of registered voters (45%). Democrats lead among registered voters who express no opinion of the Tea Party (by 49% to 37%), but among likely voters who have no opinion the race is about even (45% Democrat/ 44% Republican).
The Enthusiasm Gap
Two key indicators of likelihood to vote are measures of whether voters definitely will cast ballots this November (those who rate their chances of definitely voting at 10 on a scale of 1-10) and whether they have given “quite a lot of thought” to the election.
The GOP’s lead on both measures is the largest for either party in midterm elections dating back to 1994. Among those who plan to vote Republican in the fall, 79% say they definitely will vote, compared with 66% of those who favor the Democratic candidate. And while 64% of those who back the Republican candidate say they have given quite a lot of thought to the election, just 40% of those who plan to vote Democratic say they have thought a lot about the election.
In 2006, voters who supported the Republican candidate were as likely as those who favored the Democrat to say they would definitely vote (70% vs. 69%). Democratic voters were somewhat more likely than those who favored Republicans to say they were giving a lot of thought to the election (53% vs. 47%).
Overall, roughly as many voters now say they will definitely vote (71%) as did so in the fall of 2006 (68%). But there has been a striking increase in the proportion of voters 50 and older who express certainty about voting (82% now, 74% in 2006).
Most of the change has come among those who support Republicans. Nearly nine-in-ten (89%) Republican voters ages 50 and older say they definitely will vote, compared with 76% four years ago.
There has been virtually no change in certainty of voting among Democratic voters ages 50 and older. In 2006, 76% were sure they would cast a ballot; this year, 78% say they definitely will vote.
Six-in-ten voters younger than 50 say they definitely will vote, about the same as in 2006 (62%). Fewer voters in this age group who plan to vote for a Democrat express certainty about voting than did so in 2006 (55% today, 64% then), while there has been little change among supporters of Republican candidates (68% today, 64% then).
Fully 81% of non-Hispanic whites who favor the GOP say they definitely will vote, while 68% of whites who favor Democrats say the same. In 2006, there was little difference among white voters in their likelihood of voting by which party they favored. Black non-Hispanic voters, who overwhelmingly favor Democrats, are about as certain to vote this year as they were in 2006.
Factors Driving Turnout
Overall, 70% of voters who favor the GOP candidate in their district say they strongly disapprove of the job Obama is doing as president. Among these voters, fully 89% say they will definitely vote. By contrast, only about six-in-ten of the much smaller group of Republican voters who disapprove of Obama’s performance, but not strongly, or approve of his job performance say they will definitely vote.
Other factors are motivating Republican voters this year: More than eight-in-ten of those who agree with the Tea Party movement (88%), say partisan control of Congress is a factor in their vote (85%), see their vote as a vote against Obama (85%), or are conservative (84%) say they will definitely vote. Smaller percentages of Republican voters who do not hold these views say they will definitely vote in November.
Conversely, among voters who support Democratic candidates, nearly six-in-ten (58%) strongly approve of Obama’s job performance. Three-quarters (75%) of Democratic voters who strongly approve of Obama’s performance say they will definitely vote; only about half of Democratic voters who approve of Obama’s performance, but
not strongly, or disapprove, say they will definitely vote.
Other factors motivating Democratic voters are disagreeing with the Tea Party movement (79% definitely vote), seeing their midterm vote as a vote for Obama (71%), having liberal views (71%) and saying partisan control of Congress is a factor (70%). But in each case, smaller percentages of Democratic voters who express these views say they will definitely vote compared with Republican voters who express the opposite opinions.
An Electorate Looking for Change
Just as at the start of the summer, voters are in an anti-incumbent mood. Only about half of registered voters (49%) say they want to see their own member of Congress reelected, while a third (33%) does not.
Similarly, just a third (33%) wants to see most lawmakers reelected while 56% say they would not like to see most incumbents reelected. On both measures, opinions have changed very over the course of the past year; and on both measures, the level of anti-incumbent sentiment is as high as it has been in midterms going back to 1994.
At about this stage in the 2006 midterm, 53% said they wanted to see their own representative reelected and 35% said they wanted to see most representatives reelected; in early October 1994, 49% said they wanted to see their own representative reelected and 28% said they wanted to see most members reelected. In the 1998 and 2002 midterms, far more voters wanted to see their own member – and most members of Congress – reelected.
In the current survey, 64% of those who favor Democratic candidates say they would like to see their own representative reelected, compared with 39% of those planning to vote Republican. And while 51% of Democratic voters favor the reelection of most lawmakers, just 16% of Republican voters do so.
Currently, anti-incumbent sentiment is higher among Republican voters than it was among Democratic voters in September 2006, two months before the Democrats took control of Congress. At that time, 48% of voters who backed the Democratic candidate in their district said they wanted to see their own representative reelected (compared with 39% of those voting Republican this year). In September 2006, 25% of Democratic voters said they wanted to see most members reelected (16% of Republican voters say this today).
Section 2: Independents in the 2010 Midterm
Among registered voters, 34% call themselves Democrats, and 28% Republicans. With virtually all partisans voting for their party’s candidates, and independent registered voters divided, the overall race is about even (47% of registered voters favor Democrats, while 44% favor Republicans).
But when the sample is narrowed to likely voters, two things happen. First, high engagement and enthusiasm levels among Republicans close the party gap; among likely voters, there are an equal number of Republicans (32%) and Democrats (33%). Second, the GOP enthusiasm advantage carries over to independents as well; independents who are planning to vote Republican are far more engaged than those who favor the Democrats. With Democratic and Republican likely voters largely cancelling each other out, the 13-point GOP advantage (49% to 36%) among likely independent voters is the pivotal factor behind the Republican Party’s overall seven-point lead among all likely voters at this point in the campaign.
The improvement of the GOP’s position among independents when the focus is on likely voters – as opposed to all registered voters – occurs across virtually all demographic subgroups. But the difference is particularly notable among younger independents, those with lower incomes, and among women. For these groups,
Democrats hold a modest advantage over Republicans among registered voters; but when the analysis is narrowed to those most likely to vote, the balance of congressional vote preference reverses. For example, independents under 50 favor the Democratic candidate by 45% to 38% among registered voters, but when based on likely voters, the GOP holds a 47%-40% edge.
Among independent likely voters, the Republican Party fares particularly well among whites (53%-33%), those over age 65 (56%-29%) and those living in the South (57%-30%). The Democratic Party holds a lead only among nonwhite independents (34%-52%, there are too few black, Hispanic and other nonwhite independents to analyze separately), and among self-described liberals.
Regionally, Democrats run about even with Republicans among likely voters in the Midwest and West, but trail by a wide margin in the South and narrowly in the Northeast.
There are also signs of a much more substantial gender gap among independents this year than was the case in 2006 or 2008. In both 2006 and 2008 there was virtually no gender gap among independent voters (the overall gender gap in those years reflected the fact that women were more likely than men to identify as Democrats). This year, by contrast, independent men favor the Republican Party by a 53% to 34% margin, while independent women are divided about evenly in their vote preference (43% Republican, 40% Democratic).
Currently, independent voters younger than 50 are divided: 47% plan to vote Republican while 40% say they will vote Democratic. In 2008, Obama carried this age group by 16 points (56% to 40%). And those 50 and older, who backed McCain over Obama by a narrow margin (51% to 46%), are voting Republican by an even wider margin (51% to 34%).
Overall, white, non-Hispanic, independent likely voters – who split almost evenly in the Obama/McCain race two years ago, favor the Republicans in 2010 by a 20-point margin (53% to 33%). Independent white men, those with less education, and those living in the South are the most supportive of Republican candidates this year.
Obama Evaluations Shape Independent Vote
While demographic characteristics, government evaluations and policy preferences are all linked to how independents intend to vote this fall, evaluations of the president’s performance have the strongest relationship to independent voting patterns. Fully 71% of independents who approve of Obama plan to vote Democratic, while 67% of those who disapprove of Obama plan to vote Republican. Evaluations of whether Obama’s policies have helped or hurt the economy have about the same impact on independent voting, as does support or opposition to health care legislation.
It is not unusual, however, for presidential evaluations to have this kind of link to midterm voting among independents. Typically, around two-thirds of independents who disapprove of a president’s job performance going into a midterm support candidates of the opposing party, while most who approve of the president back candidates who are of the same party.
But the link between job approval and independent midterm voting works to the benefit of the GOP for two reasons. First, more independents currently disapprove (50%) than approve (39%) of Obama’s job performance. Second, those who disapprove are far more enthusiastic about voting than those who approve. Among independents who disapprove of Obama’s job performance, 72% say they will definitely vote and 59% have already given a lot of thought to the elections. By comparison, 62% of independents who approve of Obama say they will definitely vote, and 40% have given a lot of thought to the election.
Voting “For” or “Against” the President
While the link between presidential job approval and independent midterm voting has a long history, half (50%) of independents say that Barack Obama is not a factor in their congressional vote this fall. Among those who say he is a factor, however, more say their vote is a vote against Obama than for him by nearly two-to-one (29% vs. 16%).
In 2006, roughly the same percentage of independent voters (35%) said they viewed their vote as a vote against Bush, while just 10% saw their ballot as a vote for Bush.
In prior midterms in 2002, 1998 and 1994, the president was less of a factor in independents’ voting decisions; more than 60% in all three elections said the president was not a factor. In 1994, more independents regarded their vote as against Bill Clinton than a vote for him (by 19% to 8%).
Section 3: Trends in Party Affiliation
Partisan affiliation has shifted in small but important ways several times over the past two decades, with several politically consequential changes occurring the in past few years. After holding a 10-percentage point
advantage in party identification among registered voters in 2008 and 2009, the Democratic Party now has only a five-point lead in 2010. Fewer voters identify as Democrats and more identify as Republicans.
This year, 34% of registered voters identify as Democrats and 29% as Republicans. In 2009, on average, 36% identified as Democrats, compared with 26% who said they were Republicans, little diff
erent from 2008 when Democrats had a 38% to 28% advantage over Republicans. The Democratic Party’s 10-point lead in 2008 and 2009 grew from a much more modest 35% to 31% gap in 2006 and a narrow 34% to 33% edge in 2002.
Amidst these ups and down in affiliation with the two major parties, the number of independents and non-partisans now stands at 37%, one of the highest levels in the past 20 years of Pew Research Center polling. The proportion of independents has fluctuated in recent years, but the current number is sharply higher than it was several years ago (32% in 2002).
The recent changes in partisan identification serve as a reminder that affiliation with a party is an attitude, one which can and does change. Previous research has shown that few people switch immediately from Republican to Democratic identification or vice versa. Most of the movement is from independents who assume a party label or from partisans who no longer identify with their former party.
In fact, most of the survey’s independent and non-partisan voters report changing their party affiliation – 72% say they have thought of themselves as a Republican, a Democrat or both at some point in their life and 54% considered themselves a partisan in the past five years. About one-in-five independent voters (22%) say they considered themselves a Republican (but not a Democrat) during this period, while 23% of independents considered themselves a Democrat (but not a Republican).
More Independents Lean Republican
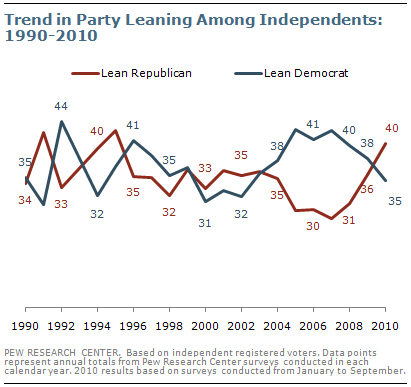
In 2010, 40% of independents and other non-partisan voters say they lean more to the Republican Party, 35% say they lean more to the Democratic Party; and 25% of independents decline to lean. These numbers reflect considerable change over the past four years.
Just a year ago, 36% of independents leaned to the GOP and 38% leaned Democratic, while 26% did not state a preference for either party. Consequently, over the past year party leaning among independent voters has shifted from a two-point Democratic lead to a five-point Republican advantage. And the shift is even more dramatic from 2006 when Democrats enjoyed an 11-point lead in independent leaning.
In the current survey, 84% of Republican leaners plan to vote for the GOP candidate in their district this November (compared with 94% among Republicans) and 82% of Democratic leaners plan to vote for the Democratic Party’s candidate (compared with 91% among Democrats). By comparison, the majority (58%) of those who do not lean to either party are undecided, while 21% support the Republican candidate and 21% back the Democratic candidate for Congress.
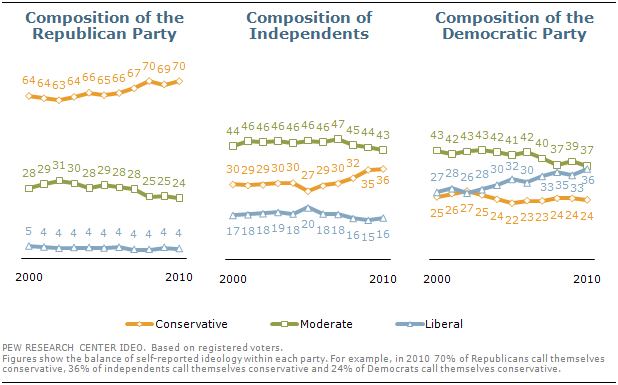
The growth in the percentage of independents who lean Republican has been accompanied by an uptick in the proportion who describe their views as conservative. Currently, 36% of independents say they are conservative, up from 29% in 2006. Over the same period, the proportion of independent who are moderates declined from 46% to 43%, while the number describing themselves as liberal edged downward two points (from 18% to 16%). (For more on ideological shifts among the electorate, see pg.30).
Why Independents Are Independent
In response to a series of questions about why they are independent, majorities of non-partisan voters cite three different factors as major reasons for rejecting a party label. Nearly two-thirds (64%) say that both parties caring more about special interests than about average Americans is a major reason for their independent status. A smaller 53% majority says a major reason for being independent is that they don’t trust either political party.
Nearly six-in-ten (58%) say a major reason they are non-partisan is that they agree with the Republicans on some issues and the Democrats on other issues. For example, pluralities of independents say the GOP comes closer to their views on some issues and the Democrats come closer on others. More independents say the Republican Party comes closer to their views than the Democratic Party on economic issues (43% Republican vs. 34% Democrat) and foreign policy and national security (44% Republican vs. 30% Democrat). But the Democrats have an edge over Republicans on social issues among non-partisans (39% Democrat, 33% Republican).
Less commonly cited were two other reasons for being an independent, including a belief that there is little difference between the parties. About a third (34%) says not thinking there is much difference between the parties is a major reason for their independent status. Only 19% of non-partisans say that a major reason they are independent is because politics is not that important to them.
Ex-Partisans Support Their Former Parties
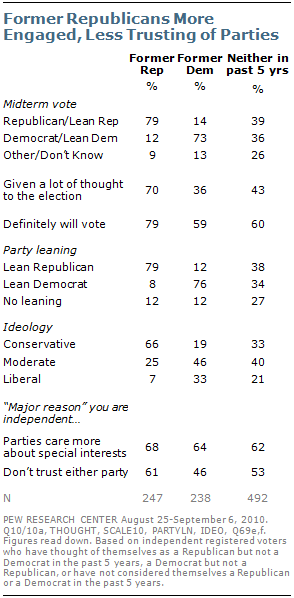
Independents who say they previously identified as Republicans or Democrats have positive views of their former parties. Fully 79% of independent voters who thought of themselves as Republicans in the past five years lean to the GOP and the same percentage (79%) favors the Republican candidate in their district.
Similarly, former Democrats overwhelmingly lean Democratic (76%) and plan to vote for a Democrat in November (73%). And just as voters who affiliate with the Republican Party are more engaged in the election, the same is true among independents who used to belong to the GOP: 79% say they will definitely vote and 70% say they are giving a lot of thought to the election. That compares with just 59% and 36%, respectively among former Democrats.
The midterm preferences of independents who have not recently considered themselves a Democrat or a Republican are much more divided – 39% favor the GOP candidate and 36% back the Democratic candidate while 26% are undecided. There is a similar pattern in their partisan leaning; 38% lean to the Republican Party, 34% to the Democratic Party and 27% refuse to lean to either party. But the plurality of this group voted for Obama over McCain in 2008 (41% Obama, 27% McCain). Among the independents who have been consistently nonpartisan over the past five years, 43% have given a lot of thought to the election and 60% say they definitely will vote, about on par with former Democrats.
When it comes to political ideology, former Republicans are far more conservative than other independents. About two-thirds (66%) describe their political views as conservative, 25% as moderate and only 7% as liberal. By contrast only 19% of former Democrats say their political views are conservative, 46% are moderate, and 33% are liberal. A third of independents who have not been a Republican or a Democrat in the past five years describe their views as conservative, 40% as moderate, and 21% as liberal.
For the most part, former Republicans, former Democrats and voters who have not recently considered themselves partisans agree on the reasons why they are independents. For instance, large majorities in all three groups say both parties care more about special interests than about average Americans. But 61% of former Republicans say they do not trust either party, compared with 46% of former Democrats. About half (53%) of those who have not recently affiliated with a party say they do not trust either party.
Where Republicans, Former Republicans Differ
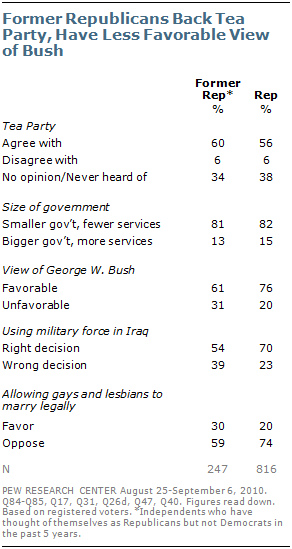
Former Republicans share many opinions with Republican partisans – particularly about Barack Obama and the size of government. But there are also key differences of opinion about George W. Bush, the Iraq war and social issues.
Notably, Tea Party support is as high among former Republica
ns as it is among Republicans – 60% of former Republicans and 56% of Republicans agree with the Tea Party movement. Similarly, 81% of former Republicans say they would rather have a smaller government with fewer services, as do 82% of Republicans.
Nearly as many former Republicans (81%) as Republicans (85%) disapprove of Obama’s job performance. Disapproval of health care reform is nearly as high among former Republicans (81%) as it is among Republicans (87%).
But former Republicans express a less favorable view of George W. Bush – 61% have a favorable opinion of him compared with 76% of Republicans. And one of the major policies of the Bush administration, the Iraq war, garners much less support among former Republicans than among Republicans – 54% of former Republicans say the U.S. made the right decision in using military force in Iraq while 70% of Republicans say it was the right decision.
There are also differences over social issues. About six-in-ten (59%) former Republicans oppose allowing gays and lesbians to marry legally while 30% favor this. But Republicans oppose same-sex marriage by a 74% to 20% margin. And while at least three-fourths of former Republicans say the GOP comes closer to their views on economic issues (79%) and foreign policy and national security (76%), only 60% say the same about social issues such as same-sex marriage and abortion.
Where Democrats, Former Democrats Differ
Former Democrats express less positive views about Obama and his policies than do Democrats. On ratings of Obama’s overall job performance, 65% of former Democrats approve, compared with 83% of Democrats. And while Democrats support the health care reform legislation by more than four-to-one (76% approve, 18% disapprove), the margin is smaller among former Democrats (59% approve, 30% disapprove).
There also are sharp differences in views about government. Only 22% of former Democrats trust the government in Washington to do what is right just about always or most of the time, compared with 41% of Democrats. Democrats prefer bigger government with more services over a smaller one by nearly two-to-one (61% bigger, 31% smaller). Opinion about the size of government is much more divided among former Democrats – 46% prefer a bigger government while 44% would rather have a smaller government.
However, former Democrats and their partisan counterparts have more similar views about business and social issues. About seven-in ten former Democrats (71%) and Democrats (69%) think that business corporations make too much profit. And a nearly identical percentage of Democrats (58%) and former Democrats (59%) favor allowing gays and lesbians to marry legally. Similarly, 57% of former Democrats think our country needs to continue making changes to give blacks equal rights with whites, as do 63% of Democrats.
Ideological Shifts among Independents, Partisans
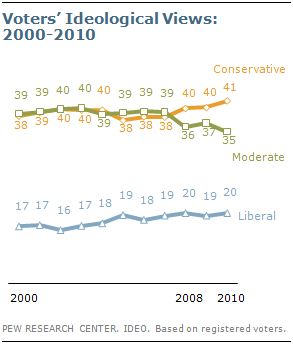
For most of the last decade the political ideology of American voters has been very stable. From 2000 to 2007, roughly four-in-ten voters described themselves as moderate and an equal share as conservative. About two-in-ten thought of themselves as liberal. In the last three years, however, the share identifying as conservative increased and the percentage identifying as moderate declined.
Among voters interviewed in 2010, 41% describe themselves as politically conservative. While conservative ideology is up 3 points from 2007 – the year Democrats assumed control of Congress – the percent who call themselves moderate is down four points (from 39% in 2007 to 35% in 2010). One in five (20%) say they are liberal, about the same percentage as in the past few years.
Some of the growth in conservative ideology is among Republican voters, but not all can be attributed to change among Republicans. Independents, specifically those who lean Republican, have become more conservative in recent years.
Since 2006, the year of the last midterm election, the percentage of Republican voters who call themselves conservative increased 4 points, from 66% to 70%. This is not a new trend within the Republican Party. The share of Republicans who call themselves conservative has grown since 2002, when 63% of Republicans called themselves conservative.
What has changed since the last midterm election is a growing percentage of independents who describe themselves as conservative. From 2006 to 2010, the share of independents who think of themselves as conservative increased seven points from 29% to 36%. Some of this increase may be attributable to the decline in Republican Party affiliation observed from 2006 to 2009. About two-in-ten (22%) of those who have shed their party affiliation in the last five years say they once thought of themselves as a Republican and fully two-thirds (66%) of this group call themselves conservative.
To be sure, not all of the growth in conservative ideology among independents is attributable to lapsed Republican identity. Republican Party affiliation increased three percentage points from 2009 to 2010 (26% to 29%), while independent identity remained stable, yet the percentage of independents calling themselves conservative edged slightly upward from 35% in 2009 to 36% in 2010.
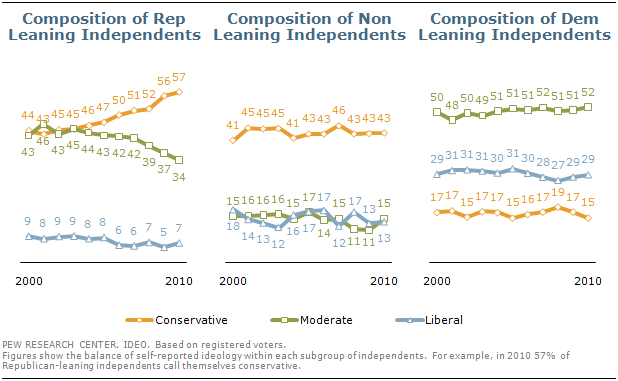
Among Republican-leaning independents and non-partisans, conservative ideology both predominates and has steadily increased. Republican leaning independents are far more conservative today than just a few years ago. Currently, 57% of Republican leaning independents call themselves conservative and just 34% are moderate. In 2003, Republican leaning independents were just as likely to be moderate as conservative (45%). There is no comparable pattern among independents who lean Democratic or independents who do not lean toward a party. Today, 43% of non-leaning independents are conservative, just two points higher than in 2000. And only 15% of Democratic-leaning independents are conservative now, down two points from 2000.
Section 4: Independents Under the Microscope
Independents are often described as a cohesive bloc of voters, whose views consistently fall midway between those of Republicans and Democrats. Yet a closer look at independents finds a substantial degree of diversity among these voters – demographic, ideological and in their attitudes and opinions.
In this survey, we identify four main groups of independent voters – two that strongly favor Republican candidates in this fall’s elections, one that strongly favors the Democrats, and another that supports the Democrats, though only modestly.
Shadow Republicans (26% of independent voters) stand out for their strong anti-government views – 21% volunteer that they “never” trust the federal government. Yet they are not especially critical of the political system and are strongly pro-business. Shadow Republicans are largely comprised of white males; in fact, fully two-thirds (67%) of this group are men – a much higher percentage than in the other independent groups or among Republican voters (only about half – 49% – of whom are men).
This group also is better educated and more affluent than voters who identify with the Republican Party or other independent voters; 52% are college graduates and 45% have annual family incomes of $75,000 or more (compared with 36% and 30%, respectively, of Republican voters). And Shadow Republicans are older (61% are 50 and older, compared wit
h 53% of Republicans). However, while Shadow Republicans overwhelmingly lean to the Republican Party – and most say they will vote Republican this November – only about half (52%) have a favorable opinion of the Republican Party.
The demographic portrait of Disaffecteds (16% of independent voters), the other GOP-leaning group of independents, is strikingly different from the Shadow Republicans. They have been hard hit by the recession – just 19% of Disaffecteds have family incomes of $75,000 a year or more, less than half of the proportion of Shadow Republicans.
Disaffected independents have an extremely pessimistic view of their own personal finances –nearly all of them rate their finances as only fair (69%) or poor (26%). Like the Shadow Republicans and Republican voters, Disaffecteds have a highly negative view of government. But Disaffecteds also are critical of business, political parties and elected officials.
Doubting Democrats (20% of independent voters) are much more critical of government and the political system – including the Democratic Party – than are Shadow Democrats, the other group of Democratic-leaning independents.
Demographically, Doubting Democrats share more in common with the GOP-leaning Disaffecteds than with Shadow Democrats. Just 20% of Doubting Democrats have family incomes of $75,000 or more, compared with 35% of Shadow Democrats. Doubting Democrats also are less demographically diverse than are Shadow Democrats – 79% are white non-Hispanics, compared with 65% of Shadow Democrats.
As their name implies, Doubting Democrats express mixed views of the Democratic Party; fewer than half (46%) say they lean Democratic, while 34% lean to the GOP. Just 29% approve of Barack Obama’s job performance and most (54%) say they disapprove of the health care legislation passed by Obama and Congress.
By contrast, most Shadow Democrats (64%) lean to the Democratic Party and they express consistently positive views of the Democratic Party, President Obama and his proposals. They also are more upbeat about the direction of the country and have more positive views of government.
There also is a fifth group of independent voters, the Disengaged (17% of independent voters), which is disproportionately comprised of women, young people and minorities. For the most part, the Disengaged are essentially political bystanders –just 21% say they definitely will vote this fall, far and away the lowest percentage among the independent groups. The analysis in this section concentrates only on the four main groups of independent voters.
Independent Groups and the Midterms
Among all registered independents, 42% say if the election were being held today they would vote for the Republican in their House district or lean Republican; 39% would vote for the Democrat or lean to the Democrat while 19% are undecided.
Shadow Republican independents favor the GOP candidate by 66% to 18%. Disaffected independent voters favor the Republican candidate in their district by a somewhat smaller margin than do Shadow Republicans (58% to 31%). However, Disaffecteds’ support for the GOP candidate is robust compared with the level of support among Doubting Democrats for Democratic candidates; fewer than half (44%) favor or lean to the Democratic candidate while 32% favor or lean to the Republican and 24% express no opinion.
The “enthusiasm gap” among groups of independent voters parallels the gap among partisans: Shadow Republicans (63%) and Disaffecteds (66%) are far more likely to say they have given a lot of thought to the election than have either Shadow Democrats (46%) or Doubting Democrats (47%).
But there are no significant differences in political engagement between the Republican- and Democratic-leaning groups of independents and their partisan counterparts. Shadow Republicans and Disaffecteds are about as likely as Republican-affiliated voters to say they are giving a lot of thought to the election and that they will definitely vote. Conversely, comparable percentages of Shadow Democrats, Doubting Democrats and voters who identify as Democrats say they are giving a lot of thought to the election and will definitely vote.
Independent Groups and Obama
Overall, 39% of independent voters approve of Barack Obama’s job performance while 50% disapprove. In three of the four main groups of independent voters, fewer than a third approve of the way Obama is handling his job as president.
Notably, about twice as many Doubting Democrats disapprove of Obama’s job performance (57%) as approve (29%). Obama’s approval rating among this group is no higher than among the GOP-leaning Disaffecteds (28% approve), though somewhat more Disaffecteds disapprove (69%).
Obama’s favorability among Doubting Democrats is more positive than his job approval rating: 41% say they have a favorable opinion of Obama while 50% have an unfavorable view. Still, only about half as many Doubting Democrats (41%) as Shadow Democrats (86%) have a favorable impression of Obama. Opinions about Obama among Shadow Democrats – both job approval and favorability – are as positive as among voters who identify as Democrats.
GOP-leaning independent voters have generally negative personal impressions of Obama. Still, far more Disaffecteds (34%) than Republican voters (11%) express favorable opinions of Obama.
Despite their critical views of Obama, the GOP-leaning independent groups are far less likely than Republican partisans to view their vote this fall as a vote “against” Obama. Fully 62% of Republican voters view their vote as a vote against Obama, compared with 45% of Disaffected independents and 41% of Shadow Republicans.
Majorities of Shadow Democrats (56%) and Doubting Democrats (52%) say that Obama will not be much of a factor in their vote this fall. However, more Shadow Democrats say they consider their vote as a vote for Obama than against him (by 33% to 7%); among Doubting Democrats, the balance of opinion is reversed (27% against/15% for).
“Shadow Reps” Lukewarm toward GOP
Roughly two-thirds of Shadow Republican independents (68%) lean to the Republican Party and about as many (66%) say they favor the Republican congressional candidate in their district. But they have a mixed view of the Republican Party itself – just 52% of Shadow Republicans have a favorable opinion of the GOP while 43% have an unfavorable opinion.
In fact, Disaffected independents – who are far less likely to lean to the GOP (53%) – have about as favorable opinion of the Republican Party (55%) as do Shadow Republicans. However, Shadow Republicans express a far more negative opinion of the Democratic Party than do Disaffected independents (76% unfavorable vs. 57% unfavorable).
The two Democratic-leaning independent groups are as divided in their view of the Democratic Party as they are in their opinions about Obama. Fully 81% of Shadow Democratic independent voters say they have a favorable opinion of the Democratic Party compared with just 44% of Doubting Democrats. Notably, Doubting Democrats feel as favorably toward the GOP (42% favorable) as toward the Democratic Party.
Views of the Tea Party
Doubting Democrats also have mixed views of the Tea Party. As many say they agree (24%) with the Tea Party movement as disagree (25%); 51% have no opinion of the Tea Party movement or have never heard of it.
Shadow Democrats and Democratic voters view the Tea Party very negatively: Among both groups of voters, more than four-in-ten say they disagree with the Tea Party movement (46% Shadow Democrats, 45% Democrats) while just 9% and 6%, respectively, say they agree.
By wide margins, Republican voters and GOP-leaning independent voters say they agree with the Tea Party movement. Most Republican voters (56%) and Shadow Republicans (56%) agree with the Tea Party movement, as do 47% of Disaffecteds.
Views of Parties and Issues
The conflicted views that many independents have about the political parties also are reflected in opinions about the parties’ traits and their handling of specific issues.
Disaffected independents see the Republican Party as better able than the Democratic Party to bring about the changes the country needs (by 46% to 24%) and as better able to manage the federal government (by 50% to 23%).
However, Disaffecteds are divided as to whether the Republican Party or Democratic Party is better described by the phrase “is more concerned with the needs of people like me.” Despite their Republican leanings, nearly as many Disaffecteds say the Democrats (38%) as Republicans (43%) better embodies this trait.
Despite their skeptical view of the Democratic Party, more than half (54%) of Doubting Democrats see the party as more concerned with needs of people like them; just 22% say the GOP. And by roughly two-to-one (43% to 21%), more Doubting Democrats say the Democratic Party rather than the GOP can bring needed change.
But Doubting Democrats live up to their name in assessing the ability of the two parties to manage the federal government: 34% say the Democratic Party could do better, while 32% say the GOP could do better and 22% volunteer neither party.
Shadow Democrats offer more uniformly positive views of the Democratic Party across all three traits. Similarly, despite their lukewarm overall view of the party, Shadow Republicans give more positive evaluations of the GOP than do Disaffecteds.
In terms of issues, independent voters say the Republican Party can do a better job than the Democratic Party of reducing the deficit (by 44% to 29%). On improving the job situation and dealing with health care, the two parties are rated about evenly among independents (40% Rep/35% Dem on job situation; 39% Dem/ 36% Rep on health care).
Doubting Democrats are divided in views of which party can better reduce the deficit and improve the job situation. Yet they favor the Democratic Party by 45% to 28% as better able than the Republicans to deal with health care.
Which Party Comes Closer to Your Views?
The survey asks independent voters which party comes closer to their views on three sets of issues. Far more independents say the Republican Party than the Democratic Party comes closer to their views on foreign policy and national security (by 44% to 30%). On economic issues, 43% say the Republican Party comes closer to their views, while 34% say the Democratic Party. But slightly more independents say the Democratic Party (39%) than the GOP (33%) is closer to their views on social issues such as abortion and gay marriage.
Clear majorities of Shadow Republicans and Disaffecteds say the Republican Party rather than the Democratic Party comes closer to their views on foreign policy and economic issues. But fewer than half in both Republican-leaning groups say the Republican Party comes closer to their views on social issues (46% of Shadow Republicans, 45% of Disaffecteds).
About as many Doubting Democrats say the Republican Party (33%) as the Democratic Party comes (36%) comes closer to their views on foreign policy and national security. And on economic issues, 40% of Doubting Democrats say the party comes closer to their views while 33% say the Republican Party.
On social issues such as abortion and gay marriage, a plurality (43%) of Doubting Democrats see the Democratic Party as coming closer to their own opinions, compared with 27% who say the GOP better reflects their views.
Issues: Gay Marriage, Gun Control, Health Care
While Republican voters oppose same-sex marriage by greater than three-to-one (74% to 20%), there is far less opposition among GOP-leaning independent groups. About half of Shadow Republicans and Disaffecteds oppose gay marriage (49% each) while 37% of both groups favor it.
There is less daylight between Democratic voters and Democratic-leaning independents on this issue: 58% of Democratic voters favor same-sex marriage, as do 60% of Shadow Democrats and 50% of Doubting Democrats.
Shadow Republicans and Disaffecteds are more in sync with Republican voters when it comes to opinions about gun control. About seven-in-ten in each group say it is more important to protect the right of Americans to own guns than to control gun ownership (73% of Republican voters, 70% of Shadow Republicans, 68% of Disaffecteds).
By contrast, majorities of Democratic voters (67%) and Shadow Democrats (58%) say it is more important to control gun ownership. But Doubting Democrats are divided; 49% say it is more important to control gun ownership while 44% say it is more important to protect gun rights.
Moreover, most Doubting Democrats disapprove of the health care legislation that Obama and Congress passed earlier this year; 54% disapprove of the law compared with just 32% who approve. The views of Doubting Democrats are more similar to those of Disaffecteds (31% approve) and Shadow Republicans (20%) than to those of Shadow Democrats (72% approve).
Wars in Iraq, Afghanistan
Most independent voters (54%) say the United States made the right decision to use military force in Afghanistan, but just 40% think the United States made the right decision in using force in Iraq.
While large majorities of Republican voters generally endorse the decisions to use military force in both countries, Shadow Republicans are much more supportive of the war in Afghanistan (65% right decision) than the war in Iraq (49%). Among Disaffecteds, comparable percentages support the use of force in Afghanistan (58%) and Iraq (55%).Democratic voters and Shadow Democrats are much more supportive of the war in Afghanistan than in Iraq. Doubting Democrats express only modest support for the decisions to use force in both countries (39% Afghanistan, 30% Iraq).
Reasons for Being an Independent
Majorities of three of the four groups of independent voters say a main reason they are independent is that the two parties care more about special interests than about average Americans. And majorities in three groups say distrust of both parties is a main reason they are independents.
But Shadow Democrats take a far less negative view of the parties. About four-in-ten (39%) say the parties’ excessive concern for special interests is a main reason they are independents. And just 11% cite distrust of both parties as a main r
eason.
There is more agreement among the independent groups regarding other reasons for deciding not to affiliate with the major parties. For example, majorities across all four groups say that they agree with the Democratic Party on some issues and the GOP on others.
About the Survey
Results for this survey are based on telephone interviews conducted August 25-September 6, 2010 among a national sample of 3,509 adults 18 years of age or older living in the continental United States (2,351 respondents were interviewed on a landline telephone, and 1,158 were interviewed on a cell phone, including 508 who had no landline telephone). Interviewing was conducted under the direction of Princeton Survey Research Associates International. Both the landline and cell phone samples were provided by Survey Sampling International. Interviews were conducted in English and Spanish. For detailed information about our survey methodology, see https://alpha.pewresearch.org/pewresearch-org/politics/methodology/.
The combined landline and cell phone sample are weighted using an iterative technique that matches gender, age, education, race/ethnicity, region, and population density to parameters from the March 2009 Census Bureau’s Current Population Survey. The sample also is weighted to match current patterns of telephone status and relative usage of landline and cell phones (for those with both), based on extrapolations from the 2009 National Health Interview Survey. The weighting procedure also accounts for the fact that respondents with both landline and cell phones have a greater probability of being included in the combined sample and adjusts for household size within the landline sample. Sampling errors and statistical tests of significance take into account the effect of weighting.
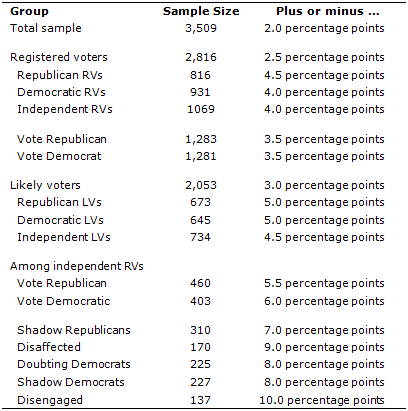
The following table shows the error attributable to sampling that would be expected at the 95% level of confidence for different groups in the survey:
In addition to sampling error, one should bear in mind that question wording and practical difficulties in conducting surveys can introduce error or bias into the findings of opinion polls.
Trends to previous midterms on thought given to the election (thought) are from Early October 1994, Early October 1998, Early September/Early October 2002 combined and September/Early October 2006 combined.
Trends to previous midterms on certainty of voting in the election (scale10) are from Late October 1994, Early October 1998, Early October 2002, and September/Early October 2006 combined.
Methodology for Creating the Typology of Independent Voters
To create the typology of independent voters, respondents were sorted into relatively homogeneous groups using a statistical procedure called “cluster analysis.” The cluster analysis utilized responses to several attitudinal and behavioral questions, including views about government, attitudes about elected officials and the political parties, measures of optimism and outlook, opinion about business and immigrants, interest in politics and past voting behavior. Measures of each of these dimensions were based on one or more questions from the survey.
Cluster analysis is not a precise or exact process because many different cluster solutions are possible using the same data. Several different cluster solutions were evaluated for their effectiveness in producing cohesive groups that were sufficiently distinct from one another, large enough in size to be analytically practical, and substantively meaningful. While each solution differed somewhat from the others, all of them shared certain key features. The solution chosen for this report was representative of the general patterns seen across the various cluster solutions.