
Republicans Faring Better with Men, Whites, Independents and Seniors
Four Years Later
Overview
The Republican Party’s prospects for the midterm elections look much better than they did four years ago at this time, while the Democrats’ look much worse. Voter preferences for the upcoming congressional elections remain closely divided (45% support the Democratic candidate or lean Democratic, while 44% favor the Republican or lean Republican). In polling conducted in August-September 2006, the Democrats held an 11-point advantage (50% to 39%).
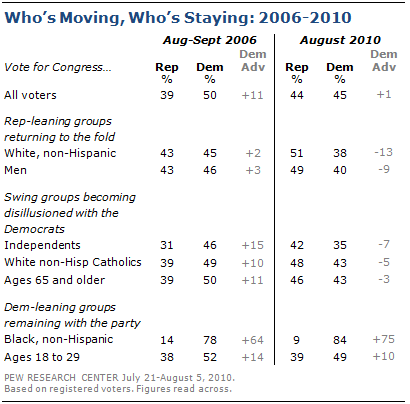
Major shifts in sentiment among key voting blocs account for the improved GOP standing in 2010. The Republicans now enjoy advantages among typically loyal voting blocs that wavered in 2006, notably men and whites.
The GOP is also now running better than four years ago among three key swing groups in recent elections – independents, white Catholics and seniors.
The Republicans also continue to enjoy an engagement advantage over the Democrats, which at least in part reflects the greater disposition to vote among these voting blocs that have swung their way. In contrast, groups such as young people and African Americans, who continue to support the Democrats by comparable margins as in 2006, are relatively unenthused about voting.
The latest national survey by the Pew Research Center for the People & the Press, conducted July 21-August 5 among 3,003 adults, including 2,431 registered voters, finds that the basic contours of opinion about the midterm election have changed little since the start of the year. In four previous surveys in 2010, preferences among registered voters were also evenly divided. Also as in past surveys, economic issues continue to be most important for voters. At the other end of the spectrum, same-sex marriage ranks last in importance among 13 issues tested in the new poll.
The Vote for Congress
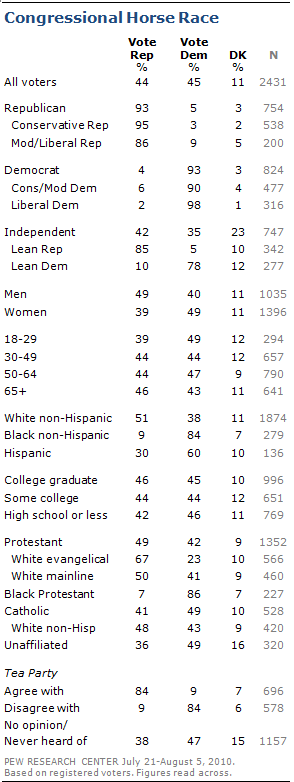
Republicans and Democrats express near-unanimous support for candidates of their own party (93% each), while independents are divided (42% for Republican candidates, vs. 35% for Democratic candidates).
More than eight-in-ten Republican-leaning independents (85%) favor the GOP candidate in their district; 78% of Democratic-leaning independents (%) support the Democratic candidate.
Men are 10 points more likely than women to favor Republican candidates (49% vs. 39%). About half of white voters (51%) favor Republican candidates, while blacks overwhelmingly support Democratic candidates (84%). Hispanic voters favor Democrats by a two-to-one margin (60% to 30%).
About a quarter of all voters (27%) say they generally agree with the Tea Party political movement; and the vast majority of this group (84%) says they will vote Republican this fall. Conversely, those who disagree with the Tea Party (22% of voters) overwhelmingly support Democratic candidates (84%). About half of voters (51%) have never heard of the Tea Party or have no opinion of it; these voters favor Democratic candidates 0ver GOP candidates by a modest margin (47% to 38%)
Wide Partisan Gap in Engagement Persists
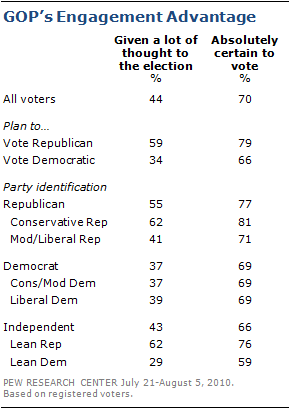
In the current survey, 44% of voters say they have given “quite a lot” of thought to the November election. This is comparable to the level of interest expressed by voters in September 2006 (45%), though it is quite a bit higher than in September 2002, when just 36% said they had given a lot of thought to the upcoming elections. Currently, interest is on par with levels later in the 1994 and 1998 midterm campaigns (44% and 42%, respectively, in early October of those two years).
The partisan enthusiasm gap seen in surveys earlier this year persists. (For a detailed analysis of the GOP’s enthusiasm advantage, see “Voting Intentions Even, Turnout Indicators Favor GOP,” July 1, 2010).
Republicans and conservatives continue express far greater interest in the election than do Democrats and liberals. More than half of Republicans (55%) say they have given a lot of thought to the election, compared with 37% of Democrats. Among Republican-leaning independents, 62% have given a lot of thought to the election; Democratic-leaning independents are much less engaged (29%). Among Republicans, conservatives are far more engaged than those who describe themselves as moderates or liberals (62% vs. 41%).
Republican voters also are more likely than Democrats to say they are absolutely certain to vote in November. More than three-quarters of Republicans (77%) say they are certain to vote, compared with 69% of Democrats. There is a somewhat larger gap between independents who lean Republican (76% certain to vote) and those who lean Democratic (59%). As with thought given to the election, conservative Republicans are the most engaged, with fully 81% saying they are certain to vote.
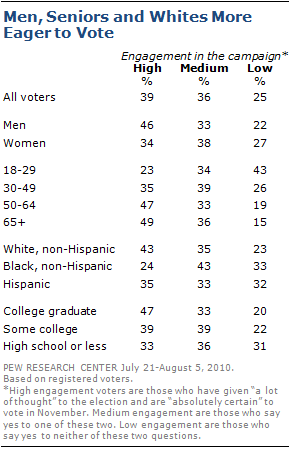
Taking two indicators of engagement together – thought given to the election and intention to vote – it is clear that Republicans and Republican leaning groups are far more energized at this point in the campaign than are Democrats and Democratic groups. Overall, 39% of registered voters are highly engaged: They have given a lot of thought to the campaign and say they definitely will vote. Among voters who identify as Republicans, 50% fall into to this high engagement category. Perhaps equally important, 57% of independents who say they lean to the GOP are rated as highly engaged.
By comparison, Democrats are significantly less engaged. Just 33% of Democrats and 23% of Democratic-leaning independents fall into the high engagement category. Similarly, relatively few among two key demographic groups that supported Democratic candidates in 2006 and 2008, African Americans and young people, rate high on campaign engagement (24% for African Americans, 23% for voters ages 18 to 29).
It is important to keep in mind that interest in the election is not the only factor that motivates voting. Many people vote as a habit, which may be why the overall percentage saying they are “certain to vote” – either absolutely or fairly certain – is more similar between the parties. This survey did not ask about previous voting behavior, which is a usual part of pollsters’ indexes of likely voting.
Much as the Democratic Party attempted to make the 2006 elections a referendum on Republican control of the government, Republican candidates are stressing national issues this year, and Republican voters are more likely than others to say national issues are important. Asked which factor among four would be most important in their vote, a small plurality (36%) of all voters picked national issues, followed by 29% for local or state issues, 22% for candidate character and experience, and just 5% who said the candidate’s political party would be most important. The percentage choosing national issues is higher than in September 2006, when 29% chose this option, and is far larger than in off-year elections from 1994 through 2002.
Among voters who support the GOP candidate in their district, 45% say national issues are most important, compared with 30% among those who say they intend to vote Democratic.
Issue Priorities and the Vote for Congress
The economy and jobs are the dominant issues of 2010. Nine-in-ten voters cite the economy as very important and about the same percentage (88%) cites jobs. The economy and jobs are viewed as very important by comparably large percentages of voters who intend to vote Republican and Democratic.
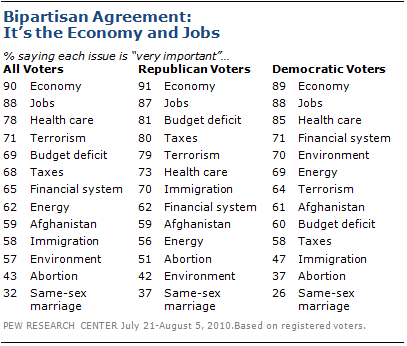
By cont rast, same-sex marriage ranks at the bottom of the list for both Republican and Democratic voters. Same-sex marriage was recently in the news because of a federal district court judge’s ruling that the California proposition banning gay marriage is unconstitutional.
Other issues at the top of the list include health care (at 78% very important), terrorism (71%), the federal budget deficit (69%) and taxes (68%). Mid-tier issues include the banking and financial system (65%), energy (62%), Afghanistan (59%), immigration (58%) and the environment (57%). Rounding out the list are abortion (43% very important) and same-sex marriage (32%).
There are sizable partisan differences in views of the importance of some issues. While about eight-in-ten voters who support Republican candidates see the budget deficit (81%) and taxes (80%) as very important, smaller majorities of Democratic voters say the same (60% budget deficit, 58% taxes). And immigration is rated a very important by substantially more Republican voters (70%) than Democratic voters (47%).
Seven-in-ten voters who intend to vote Democratic say the environment will be very important, compared with fewer than half (42%) of Republican voters. The financial system also is seen as very important by somewhat more Democratic than Republican voters (71% vs. 62%).

Obama Approval Stable
President Obama’s job approval rating stands at 47%, a number that has changed very little all year; 41% currently disapprove of his performance in office.
The stability in Obama’s ratings for the past several months is evident not just among the public overall, but among most subgroups in the population. His core supporters continue to give him high ratings, including Democrats (79% approval) and African Americans (89%). He gets nearly unanimous approval from liberal Democrats (90%).
Even among groups with more mixed opinions, there has been little evidence of a trend for the past several months. Independents remain divided (42% approve, 43% disapprove), while a plurality of whites continue to disapprove (49%, vs. 38% who approve).


Obama in a Word
Good is the word that people use most frequently to describe Obama. In a separate survey by the Pew

Research Center for the People & the Press, conducted Aug.5-8 among 1,002 adults, 49 say that good is the word that first comes to mind in describing Obama. Other words used frequently are trying (mentioned by 36 respondents) and disappointing (32).
The word good is used more frequently to describe Obama than in previous surveys. In a survey in January, in which 740 respondents were asked to give a one-word description of Obama, 18 mentioned good; in April 2009 (asked of a sample of 742), 29 used that word. Mentions of trying also have increased – from 12 in April 2009 to 21 in January and 36 in the current survey.
Some negative terms also are being used more frequently, including disappointing, incompetent and idiot: 32 now describe Obama as disappointing (six did so in January); 22 use the word incompetent (11 in January); and 17 describe Obama as an idiot (five in January).
