Pew Research Center

FOR RELEASE APRIL 18, 2010

Distrust, Discontent, Anger and Partisan Rancor

The People and Their Government

FOR MEDIA OR OTHER INQUIRIES:

Communications Department
202.419.4372
www.pewresearch.org

RECOMMENDED CITATION

Pew Research Center, April 2010, "Distrust, Discontent, Anger and Partisan Rancor"

About Pew Research Center

Pew Research Center is a nonpartisan, nonadvocacy fact tank that informs the public about the issues, attitudes and trends shaping the world. It does not take policy positions. The Center conducts public opinion polling, demographic research, computational social science research and other data-driven research. It studies politics and policy; news habits and media; the internet and technology; religion; race and ethnicity; international affairs; social, demographic and economic trends; science; research methodology and data science; and immigration and migration. Pew Research Center is a subsidiary of The Pew Charitable Trusts, its primary funder.

© Pew Research Center 2026

Table of contents

  • About Pew Research Center
  • Distrust, Discontent, Anger and Partisan Rancor
  • Section 1: Trust in Government 1958-2010
  • Section 2: Government’s Performance and Power
  • Section 3: Government Challenges, Views of Institutions
  • Section 4: Congress and the Political Parties
  • Section 5: Views of Federal Departments and Agencies
  • Section 6: Tea Party and Views of Government Overreach
  • Section 7: Electoral and Political Implications
  • About the Survey

Distrust, Discontent, Anger and Partisan Rancor

The People and Their Government

Overview

By almost every conceivable measure Americans are less positive and more critical of government these days. A new Pew Research Center survey finds a perfect storm of conditions associated with distrust of government – a dismal economy, an unhappy public, bitter partisan-based backlash, and epic discontent with Congress and elected officials.

Rather than an activist government to deal with the nation’s top problems, the public now wants government reformed and growing numbers want its power curtailed. With the exception of greater regulation of major financial institutions, there is less of an appetite for government solutions to the nation’s problems – including more government control over the economy – than there was when Barack Obama first took office.

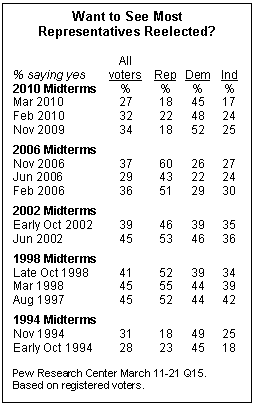
The public’s hostility toward government seems likely to be an important election issue favoring the Republicans this fall. However, the Democrats can take some solace in the fact that neither party can be confident that they have the advantage among such a disillusioned electorate. Favorable ratings for both major parties, as well as for Congress, have reached record lows while o pposition to congressional incumbents, already approaching an all-time high, continues to climb.

The Tea Party movement, which has a small but fervent anti-government constituency, could be a wild card in this election. On one hand, its sympathizers are highly energized and inclined to vote Republican this fall. On the other, many Republicans and Republican-leaning independents say the Tea Party represents their point of view better than does the GOP.

These are the principal findings from a series of surveys that provide a detailed picture of the public’s opinions about government. The main survey, conducted March 11-21 among 2,505 adults, was informed by surveys in 1997 and 1998 that explored many of the same questions and issues. While a majority also distrusted the federal government in those surveys, criticism of government had declined from earlier in the decade. And the public’s desire for government services and activism was holding steady.

This is not the case today. Just 22% say they can trust the government in Washington almost always or most of the time, among the lowest measures in half a century. About the same percentage (19%) says they are “basically content” with the federal government, which is largely unchanged from 2006 and 2007, but lower than a decade ago.

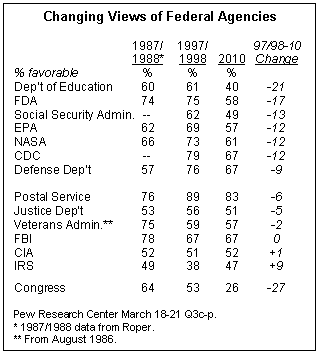
Opinions about elected officials are particularly poor. In a follow-up survey in early April, just 25% expressed a favorable opinion of Congress, which was virtually unchanged from March (26%), prior to passage of the health care reform bill. This is the lowest favorable rating for Congress in a quarter century of Pew Research Center surveys. Over the last year, favorable opinions of Congress have declined by half – from 50% to 25%.

While job ratings for the Obama administration are mostly negative, they are much more positive than the ratings for Congress; 40% say the administration does an excellent or good job while just 17% say the same about Congress.

Federal agencies and institutions also are viewed much more positively than is Congress. Nonetheless, favorable ratings have fallen significantly since 1997-1998 for seven of 13 federal agencies included in the survey. The declines have been particularly large for the Department of Education, the FDA, the Social Security Administration, as well as the EPA, NASA and the CDC. In terms of job performance, majorities give positive ratings to just six of 15 agencies or institutions tested, including the military (80% good/excellent) and the Postal Service (70%).

As was the case in the 1997 study of attitudes about government, more people say the bigger problem with government is that it runs its programs inefficiently (50%) than that it has the wrong priorities (38%). But the percentage saying government has the wrong priorities has increased sharply since 1997 – from 29% to 38%.

Perhaps related to this trend, the survey also finds a rise in the percentage saying the federal government has a negative effect on their day-to-day lives. In October 1997, 50% said the federal government had a positive effect on their daily lives, compared with 31% who said its impact was negative. Currently, 38% see the federal government’s personal impact as positive while slightly more (43%) see it as negative.

Rising criticism about government’s personal impact is not limited to the federal government. Just 42% say their state government has a positive effect on their daily lives, down from 62% in October 1997. There is a similar pattern in opinions about the impact of local government – 51% now see the impact of their local government as positive, down from 64% in 1997.

Despite the attention captured by demonstrations and other expressions of anti-government sentiment, Americans’ feelings about the federal government run more toward frustration rather than anger. In the current survey, 56% say they are frustrated with the federal government, 21% say they are angry and 19% say they are basically content. Since October 1997, majorities have expressed frustration with the federal government, with a single notable exception; in November 2001, two months after the 9/11 attacks, just 34% said they were frustrated with the federal government.

And despite the frustration most Americans feel with government, a majority of the public (56%) says that if they had a child just getting out of school they would like to see him or her pursue a career in government; and 70% say the government is a good place to work, unchanged from October 1997.

However, along with the frustrated majority, which has remained fairly steady over the years, the survey also identifies a small but growing segment of the public that holds intense anti-government views. The proportion saying that they are angry with the federal government has doubled since 2000 and matches the high reached in October 2006 (20%).
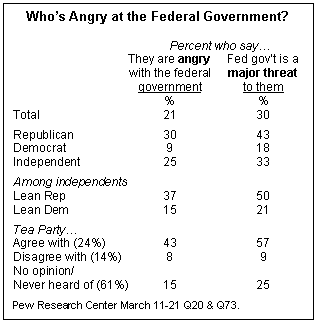
Over this period, a larger minority of the public also has come to view the federal government as a major threat to their personal freedom – 30% feel this way, up from 18% in a 2003 ABC News/Washington Post survey. Intense anti-government sentiment is highly concentrated among certain groups – Republicans, independents and others who lean Republican, and those who agree with the Tea Party movement.

For example, 43% of Republicans say the federal government presents a major threat to their personal freedom, as do 50% of independents who lean Republican and fully 57% of those who agree with the Tea Party movement. That compares with just 18% of Democrats, 21% of independents who lean Democratic and just 9% of those who disagree with the Tea Party movement.

The Perfect Storm
The current survey and previous research have found that there is no single factor that drives general public distrust in government. Instead, there are several factors – and all are currently present. First, there is considerable evidence that distrust of government is strongly connected to how people feel about the overall state of the nation.1 Distrust of government soars when the public is unhappy with the way things are going in the country.

The recent downward trend in trust in government began in the fall of 2008, when public satisfaction plunged amid the financial crisis. In early October 2008, 11% said they were satisfied with the way things were going in this country – the lowest measure in more than two decades of Pew Research Center polling. That same month, a CBS/New York Times survey found just 17% saying they could trust the government in Washington to do what is right, which matched an all-time low seen previously only in the summer of 1994.

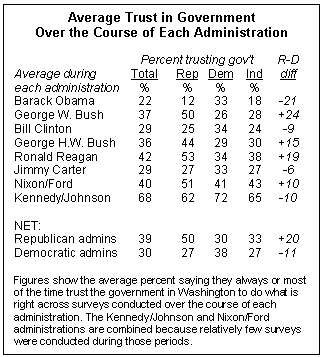
A second element is presidential politics. Trust in government is typically higher among members of the party that controls the White House than among members of the “out” party. However, Republicans’ views of government change more dramatically, depending on which party holds power, than do Democrats’. Republicans are more trusting of government when the GOP holds power than Democrats are when the Democrats are in charge.

This pattern is particularly evident in the Obama era. The president’s policies – especially the year-long effort to overhaul the health care system – have served as a lightning rod for Republicans. Currently, just 13% of Republicans say they can trust the government in Washington to do what is right, nearly equaling a low point reached in June 1994 during the Clinton administration (11%).

A third factor is that a particular subgroup of independents, who are financially pressed, chronically distrustful of government and who typically lean to the Republican Party, appears to be especially angry today. Pew political typology surveys in the past have labeled these individuals as “disaffecteds.” This group may explain, in part, why at least as many Republican-leaning independents (37%) as conservative Republicans (32%) say they are angry with the government. And identical percentages of Republican-leaning independents and conservative Republicans (53% each) say they agree with the Tea Party movement.

Finally, record discontent with Congress – and dim views of elected officials generally – have poisoned the well for trust in the federal government. Undoubtedly, this has contributed to growing discontent with government even among groups who are generally more positive about it, such as Democrats. Today, many fewer Democrats say they trust government than did so during the later Clinton years. And just 40% of Democrats have a favorable impression of the Democratic Congress – the lowest positive rating for Congress ever among members of the majority party.

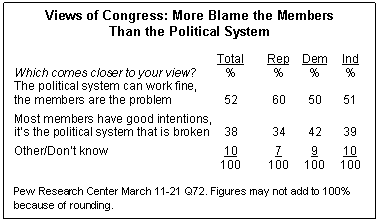
For the most part, the public sees the members of Congress themselves, rather than a broken political system, as the problem with the institution. A majority says (52%) that the political system can work fine, it’s the members of Congress that are the problem; 38% say that most members of Congress have good intentions, but the political system is broken.
Public opinion about elected officials in Washington is relentlessly negative. Favorable ratings for the Democratic Party have fallen by 21 points – from 59% to 38% – over the past year and now stand at their lowest point in Pew Research surveys. The Republican Party’s ratings, which increased from 40% last August to 46% in February, have fallen back to 37%.

When asked about a series of criticisms of elected officials in Washington – that they care only about their careers, are influenced by special interests, are unwilling to compromise, and are profligate and out-of-touch – large majorities (no fewer than 76%) agree with each of the statements. And while 56% say they would like their child to pursue a career in government, far fewer (36%) say the same about their child making a career in politics.

It’s Not Just Government

While anti-government sentiment has its own ideological and partisan basis, the public also expresses discontent with many of the country’s other major institutions. Just 25% say the federal government has a positive effect on the way things are going in the country and about as many (24%) say the same about Congress. Yet the ratings are just as low for the impact of large corporations (25% positive) and banks and other financial institutions (22%). And the marks are only slightly more positive for the national news media (31%) labor unions (32%) and the entertainment industry (33%).

Notably, those who say they are frustrated or angry with the federal government are highly critical of a number of other institutions as well. For example, fewer than one-in-five of those who say they are frustrated (18%) or angry (16%) with the federal government say that banks and other financial institutions have a positive effect on the way things are going in the country.

Familiar Complaints, Growing Concerns

As in the past, poor performance is the most persistent criticism of the federal government. Fully 74% think that the federal government does only a fair or poor job of running its programs, which is on par with opinions in the late 1990s.

But another strain of criticism is that the federal government’s priorities are misguided and that government policies do too little for average Americans. More than six-in-ten (62%) say it is a major problem that government policies unfairly benefit some groups while nearly as many (56%) say that government does not do enough to help average Americans.

Since 1997, there has been a substantial increase in the percentage saying that middle-class people get less attention from the federal government than they should; 66% say that currently, up from 54% thirteen years ago. In contrast with many opinions about government, this view is shared by comparable percentages of Republicans (68%), Democrats (67%) and independents (65%). Conversely, about half of Republicans (52%), Democrats (52%) and independents (47%) say that Wall Street gets more attention than it should from the federal government.

The size and power of the federal government also engender considerable concern. A 52% say it is a major problem that the government is too big and powerful, while 58% say that the federal government is interfering too much in state and local matters.

The public is now evenly divided over whether federal government programs should be maintained to deal with important problems (50%) or cut back greatly to reduce the power of government (47%). In 1997, a clear majority (57%) said government programs should be maintained. Greater support for cutting back government programs is seen among Republicans (up 14 points) and independents (eight points); by contrast, just 27% of Democrats say programs should be greatly cut back, unchanged from 1997.
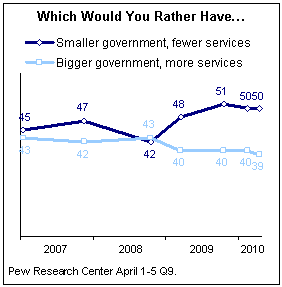
A desire for smaller government is particularly evident since Barack Obama took office. In four surveys over the past year, about half have consistently said they would rather have a smaller government with fewer services, while about 40% have consistently preferred a bigger government providing more services. In October 2008, shortly before the presidential election the public was evenly divided on this issue (42% smaller government, 43% bigger government).

The Regulation Paradox
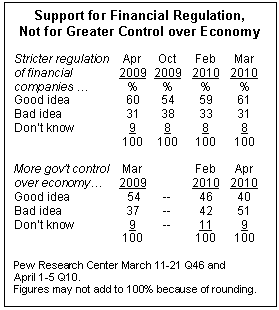
Despite the public’s negative attitudes toward large corporations, most Americans (58%) say that “the government has gone too far in regulating business and interfering with the free enterprise system.” This is about the same percentage that agreed with this statement in October 1997 (56%).

Along these lines, the public opposes government exerting more control over the economy than it has in recent years. Just 40% say this is a good idea, while 51% say it is not. Last March, the balance of opinion was just the opposite. By 54% to 37%, more people said it was a good idea for the government to exert greater control over the economy.

While the public is wary of too much government involvement with the economy, it suspends that concern when it comes to stricter regulation of major financial companies. A clear majority (61%) says it is a good idea for the government to more strictly regulate the way major financial companies do business, which is virtually unchanged from last April (60%).

Government Distrust and Midterm Politics
Hostility toward government seems likely to be a significant election issue and an important element in both midterm voting intentions and turnout. While there was widespread distrust of the federal government in the late 1990s, just 37% went so far as to say that the federal government needed “very major reform.” Today, that figure stands at 53%; increasing numbers of Republicans, independents and Democrats say that government needs very major reform. Still, far more Republicans (65%) and independents (54%) than Democrats (41%) express this view.

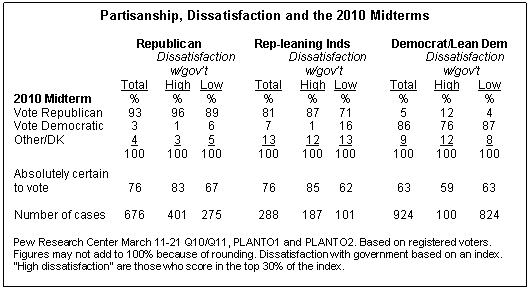
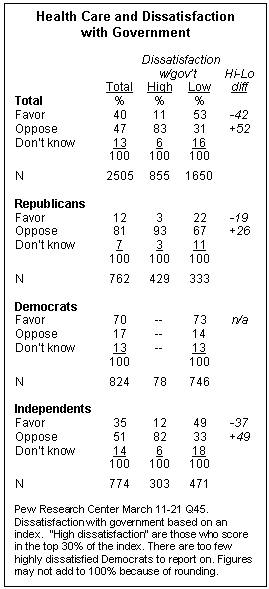
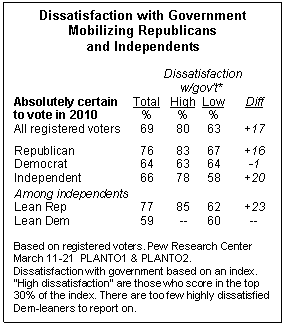
Consistent with this pattern of partisanship, anti-government sentiment appears to be a more significant driver of possible turnout among Republicans and independents than among Democrats. Among Republican voters who are highly dissatisfied with government, 83% say they are absolutely certain to vote in the midterm elections; that compares with 67% of Republicans who express low levels of frustration with government. By contrast, there is no difference in intention to vote among Democrats who are highly frustrated with government (63%) and those who are less frustrated (64%).

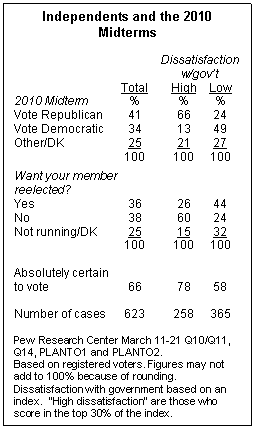
Perhaps more troubling for Democrats, the link between dissatisfaction with government and voting intentions is at least as strong among independent voters. Independents who are highly dissatisfied with government are far more committed to voting this year than are independents who are less frustrated (78% vs. 58%). Overall, independents voters slightly favor the GOP candidate in their district by a 41% to 34% margin, but those who are highly dissatisfied with government favor the Republican candidate by an overwhelming 66% to 13% margin. Independents who are less dissatisfied with government favor the Democratic candidate in their district (by 49% to 24%), but are much less likely to say they are certain to vote.
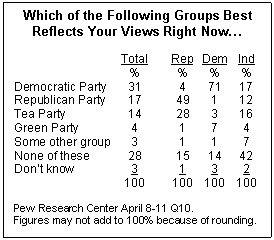
While the GOP has a decided enthusiasm advantage predicated on discontent with government, it has a potential unity problem given the appeal of the Tea Party to many of its members. Only about half of Republicans (49%) say that the GOP is the party that best reflects their views right now, while as many as 28% cite the Tea Party. Among independents who lean Republican, the problem is potentially greater: As many say the Tea Party best reflects their views right now (30%) as the GOP (29%), with nearly as many saying nobody is representing their views (28%).

About the Surveys

This extensive study of public attitudes toward the federal government serves as an update and expansion of the Pew Research Center’s 1998 Deconstructing Distrust report (https://alpha.pewresearch.org/pewresearch-org/politics/report/95/how-americans-view-government). Results are based on interviews from four telephone surveys conducted on landline and cell phones of nationwide samples of adults living in the continental United States.

The main survey was conducted March 11-21, 2010 with a sample of 2,505 adults. Interviews were conducted in English and Spanish. For the total sample of 2,505 interviews, the margin of sampling error that would be expected at the 95% confidence interval is plus or minus 2.5 percentage points. The margin of error for subgroups is larger.

Three other surveys of approximately 1,000 adults each were conducted March 18-21, April 1-5 and April 8-11. Interviews were conducted in English. The margin of sampling error for these surveys is plus or minus 4 percentage points.

Section 1: Trust in Government 1958-2010

Public trust in the federal government in Washington is at one of its lowest levels in half a century. Just 22% of Americans say they trust the government to do what is right “just about always” (3%) or “most of the time” (19%). The current level of skepticism was matched previously only in the periods from 1992 to 1995 (reaching as low as 17% in the summer of 1994), and 1978 to 1980 (bottoming out at 25% in 1980). When the National Election Study first asked this question in 1958, 73% of Americans trusted the government to do what is right just about always or most of the time.

The forces contributing to the current wave of public distrust include an uncertain economic environment, overwhelming discontent with Congress and elected officials, and a more partisan environment. The bitter and drawn-out health care debate exacerbated negative feelings about government – particularly Congress. During the final House debate over health care reform, public perceptions of Congress reached an all-time low. And the public’s impressions of elected officials as corrupt, wasteful, self-centered, unwilling to compromise, and indifferent to the concerns of regular Americans are widespread.

Yet dissatisfaction with government predates the health care debate and even Barack Obama’s presidency. After increasing in the immediate wake of the Sept. 11, 2001 terrorist attacks, trust in government began slipping almost immediately and continued to tumble with the debate over the war in Iraq, a series of White House and congressional scandals, the government’s poor response to Hurricane Katrina, and worsening economic conditions. The public’s view of government became even more negative during the financial meltdown and bank bailout in late 2008. A CBS/New York Times poll conducted in October 2008 found just 17% trusting the federal government to do what is right – a low seen previously only in a June 1994 Gallup survey.

The Economy, Satisfaction and Trust in Government

It is no surprise that trust in government falls during economic hard times. Historically, confidence in government corresponds with broader measures of satisfaction with the state of the nation and economic stress. The low points in government trust over the past half-century have occurred during the nation’s economic struggles in the late 1970s, the early 1990s, and over the past few years. And confidence in government recovered in the late 1980s and late 1990s, when economic growth was strong and satisfaction was high.

In 1979, Gallup found just 19% of Americans satisfied with the way things were going in the country, and public trust in government was at 29% that year. By the spring of 1980, the Reuters/University of Michigan Consumer Sentiment Index fell to an all-time low of 54, and trust in government slipped further to 25%. Both satisfaction and consumer confidence grew over the course of Ronald Reagan’s presidency and trust in government also rebounded somewhat. But all three measures fell again in 1990 as economic problems worsened.

Despite a brief spike in satisfaction with the nation and trust in government at the start of the Gulf War in early 1991, continued economic problems through 1992 caused the steepest drop ever in both satisfaction and trust in government. Gallup polls found satisfaction with the state of the nation falling from 66% to 14% between February 1991 and June 1992. And according to CBS/New York Times polls conducted over that period, trust in government fell 25 points in just a year-and-a-half (from 47% in March 1991 to 22% in October 1992).

While satisfaction with national conditions, consumer sentiment and trust in government generally move together, there have been periods when these measures diverge. By 1993, satisfaction rebounded slightly, and consumer confidence rose substantially, yet trust in government continued to decline. And while consumer sentiment reached record highs in the late 1990s, and satisfaction rose as well, trust in government lagged far behind.

Political Implications of Trust in Government

Public confidence in government reached historic lows in 1994, a few months before the GOP gained control of Congress. However, public trust in government was already at a very low level two years earlier, when 43 House members lost their seats and many others retired in the face of poor reelection prospects. Not only had economic conditions turned deeply negative, but the House banking scandal that year came to symbolize much of what Americans felt was wrong with the political system. While this scandal affected both Democrats and Republicans, it resulted in the largest turnover in House seats since 1974.

The broad frustration with government in 1992 also sparked an unprecedented rejection of both political parties. For the first time in modern history a plurality of Americans chose “independent” as their partisan affiliation and Ross Perot garnered 19% of the popular vote as an independent candidate for the White House.

By 1994 distrust in government had increased following missteps in the early Clinton administration and the fight over health care reform. The Republican Party picked up 54 seats in that fall’s midterm election on a platform of government reform, deficit reduction and term limits for members of Congress. Over this period, conservative talk radio tapped into the widespread anti-government sentiment. Trust in government recovered between 1994 and 1998, only to plummet temporarily with the impeachment of Bill Clinton.

In general, when trust falls steeply incumbents are more likely to lose – and the president’s party tends to lose the most. Following Nixon’s resignation in 1974, trust in government fell to 36% (from 53% in 1972). Democrats made huge gains as 48 incumbents – nearly all of them Republicans – lost reelection bids. When trust fell to 25% in 1980, Republicans made great gains as 37 incumbents – nearly all of them Democrats – were defeated. The collapse in government confidence in 1992 hurt both parties, but especially the Democrats, and the continuing decline in 1994 led to the Republicans gaining their first majority in the House in four decades.

Over the last two election cycles, the effects of low trust also have been evident. In 2006, 24 incumbents lost seats – all of them Republicans – as Democrats regained control of Congress. And in 2008 Democrats grew their majority larger and won the White House, when trust was at or near record lows.

Partisanship and Trust in Government

Despite taking a conservative position on most issues related to government size and power, Republicans do not consistently feel less trustful of government than Democrats. Since the National Election Study began asking about trust in government in 1958, Republicans have consistently been more trusting when there has been a Republican in the White House, and Democrats have been more trusting when the presidency is held by a Democrat. Republicans felt far better about government under Nixon, Reagan and Bush than Democrats did under Carter, Clinton or Obama.

As with many other aspects of American politics, partisan divisions in trust in government have grown larger in recent decades. Averaging across the eight years George W. Bush served as president, 50% of Republicans said they could trust the government in Washington always or most of the time. Across that same period just 26% of Democrats offered the same assessment. This 24-point divide in government trust was larger than was the case under any previous administration.

While partisanship is a factor, the shifts in government trust tend to span party lines. Independents consistently take a relatively skeptical view of government – their views at any given time tend to track with whichever partisan group does not hold the presidency. During the Nixon, Reagan and both Bush administrations, about as many independents as Democrats trusted government. During the Carter and Clinton administrations, independents expressed as low or lower levels of trust than did Republicans. So far, the early part of the Obama administration represents a slight deviation from this pattern. While independent levels of trust are very low, Republican trust has been even lower.

During the first part of Barack Obama’s presidency, partisan differences in trust in government are nearly as large as they were during George W. Bush’s administration. Across six surveys conducted after Obama’s election, an average of 12% of Republicans say they trust government all or most of the time, compared with 33% of Democrats – a 21-point gap. The average partisan gap over the previous eight years was 24 points (26% of Democrats, 50% of Republicans), although overall levels of trust were higher.

While Obama’s term in office is still young, the average level of public trust in government over the past year-and-a-half is lower than the average under any previous administration. However, current ratings of government trust are nearly identical to those in the first part of Bill Clinton’s presidency. In 1993 and early 1994 an average of just 23% of Americans said they trusted government always or most of the time, including 14% of Republicans, 18% of independents and 28% of Democrats.

The figures over the past year-and-a-half are similar, though slightly more polarized: 22% trust government overall, including 12% of Republicans, 18% of independents and 33% of Democrats. And as with Clinton, much of the distrust in government Obama currently faces was already present prior to his taking office.

The Precursors to 2010

The current frustration Americans feel toward government, is best understood by looking back at the events and issues of the past decade. The largest spike in public trust in government occurred after the Sept 11, 2001 terrorist attacks. A Gallup survey conducted in early October of that year found 60% saying they trusted the government always or most of the time, roughly double the number who said this (31%) in a CBS/New York Times survey earlier in the year.

The post-9/11 rise in public confidence in government crossed party lines – for the first time in over 30 years (since 1970) majorities of Republicans (70%), Democrats (53%) and independents (54%) said they felt they could trust the government to do what is right always or most of the time. But the spike in confidence was short-lived. By December 2001, fewer than half of Americans said they trusted government.

In July 2003, 36% said they trusted government, according to a CBS News/New York Times poll. Just 27% of Democrats said they trusted government – about half the number who felt that way in October 2001. There was a comparable decline in trust among independents (from 54% to 30%). Even among Republicans, the proportion saying they trusted government fell from 70% to 53%.

Overall public trust in government slipped to 31% in the fall of 2005 following the government’s poorly-rated response to Hurricane Katrina, a series of political scandals, and public doubt about the war in Iraq. At the time, 54% of Republicans continued to express confidence in government, compared with just 23% of independents and 18% of Democrats.

The final two years of George W. Bush’s presidency saw further declines in public trust in government. By the summer of 2007, with Democratic majorities in the House and Senate, only 24% of the public trusted the government. About a third of Republicans (32%) expressed confidence in government, and there were no improvements in the views of independents (22%) and Democrats (19%).

The financial crisis and government-sponsored bank bailout of late 2008 sent trust in government to new lows across party lines. A CBS/New York Times survey conducted in October 2008 found just 17% of Americans saying they trusted the government always or most of the time. Distrust of government became nearly universal – just 21% of Republicans, 14% of Democrats and 11% of independents expressed confidence in the federal government in Washington to do what is right.

Following Obama’s 2008 victory, Democratic trust in government rebounded – currently 34% of Democrats express trust in the government to do the right thing. And trust among independents has recovered slightly to 20% today. Meanwhile, Republican trust has fallen even lower; just 13% of Republicans today say they generally trust the federal government – roughly on par with Republican views of government in June 1994 (11%).

The Current Trust Landscape

While party identification is closely linked to trust in government, other factors come into play as well. Roughly a third (32%) of adults under age 30 say they trust the government to do what is right always or most of the time, compared with 20% among all other age groups. Trust is also somewhat more widespread among college graduates (27%) than those with less education (20% of those with some college, 21% of those with a high school education or less).

Blacks are more likely than whites (37% vs. 20%) to say they trust government. This represents a sharp turnaround from the balance of opinion under George W. Bush. In particular, following Hurricane Katrina just 12% of blacks said they trusted the government always or most of the time, compared with 32% of whites.

Not surprisingly, just 7% of Americans who say they agree with the Tea Party movement feel they can always or mostly trust the government, while 92% say they trust the government only some of the time or never. By contrast, 39% of those who disagree with the Tea Party movement, and 25% of those who have never heard of the movement or have no opinion of it, say they trust the government. (For more detailed breakdowns on trust in government, see table on pg. 81)

A Health Care Recovery?

The main Pew Research Center survey reported here was conducted during the final stages of the congressional debate over health care reform – an undoubtedly tense and divisive moment in politics. To determine whether the passage of the legislation altered peoples’ views, a new survey that included the trust measure was conducted April 1-5, after the bill’s passage. Overall, there was little change in opinions – 25% of Americans in early April said they thought they could trust the government just about always or most of the time, which was virtually unchanged from 22% in March. However, trust among Democrats rose somewhat from 34% in March to 42% in early April.

Section 2: Government’s Performance and Power

When asked how they feel about the federal government, majorities consistently express frustration, while smaller numbers say they are basically content or angry. Anger toward the government has risen in recent years. In the current survey, as in 2006, about as many say they feel angry as content with the government. In earlier surveys, far more said they were content than angry.

While overall opinions of how the government runs its programs have declined only modestly since the late 1990s, far more Americans think that it needs very major reform than did so then. Support for making substantial cutbacks in federal programs also has increased.

Asked about specific criticisms of the federal government, clear majorities say the government is wasteful and inefficent, that its policies unfairly benefit some groups and that it does not do enough to help average Americans. Fewer say the government is too big and powerful or that it interferes too much in people’s lives. However, the idea that government is too big and powerful resonates particularly with Republicans – twice as many Republicans as Democrats see this as a major problem.

Widely Shared Frustration

Majorities or pluralities of those in all demographic groups say that their attitude towards government is best described as frustrated. However, far fewer non-Hispanic blacks (48%) and Hispanics (47%) than whites (60%) say they are frustrated with government. Blacks and Hispanics also are about twice as likely as whites to say they are basically content with government (31% black, 30% Hispanic vs. 14% white).

Age also is a factor in sentiment about government. More than a quarter of those younger than 30 (28%) say they are basically content with government, the highest proportion of any age group. By contrast, about a quarter of those age 50 and older (26%) express anger with government, compared with 17% of those under 50.

Three-in-ten Republicans (30%) say they are angry with government, and an additional six-in-ten (60%) say they are frustrated; just 9% say they are basically content with the federal government. Democratic opinion is the reverse: just 9% of Democrats say they are angry, while 58% are frustrated and 27% say they are basically content.

Agreement with the Tea Party movement is one of the strongest correlates of anger with government. More than four-in-ten of those who agree with the movement (43%) say they are angry with government, compared with just 8% of those who disagree with Tea Partiers and 15% of those who have no opinion or have not heard of the movement.

Growing GOP Anger

Republican anger with the federal government is now at its highest point over the last decade, but this sentiment extends beyond those who consider themselves Republicans. Independents and others who lean towards the GOP express anger with the government at even higher levels than do self-identified Republicans (37% vs. 30%).

There is little difference between the levels of anger seen among conservative Republicans and their moderate and liberal counterparts (32% angry vs. 27% angry).

Overall Republican anger today is on par with the level of Democratic anger in October 2006 (30% of Republicans express anger today, compared with 28% of Democrats in 2006). But a smaller proportion (32%) of conservative Republicans express anger with the government today than did liberal Democrats in 2006 (44%). (For more detailed breakdowns on feeling about the federal government, see table on pg. 84)

Government Performance

Overall views of the federal government’s performance have not changed dramatically since 1997. As was the case then, about a quarter of Americans say the federal government does an excellent or good job in running its programs (25% then, 23% today). However, somewhat more say the government does a poor job (from 21% in 1997 to 28% today); fewer rate the government’s performance as only fair (53% then, 46% today).

Notably, the increasing belief that the federal government does a poor job is almost entirely driven by partisanship. Fully 44% of Republicans say the government does a poor job in running its programs, up from just 28% in 1997 during Bill Clinton’s second term. By contrast, there has been virtually no change in the percentage of Democrats giving the government poor ratings (10% then, 11% today).

Half of independents who lean Republican rate the government’s performance as poor, up from just a third (33%) in 1997. Opinions among independents who lean to the Democratic Party, like those of Democrats themselves, are largely unchanged from 1997.

Not surprisingly, there is a strong relationship between expressing anger at the federal government and holding negative views of government performance. Fully 62% of those who are angry with the federal government say it does a poor job of running its programs; that compares with 52% in 1997. Those who are frustrated with government (24%) and basically content (4%) are far less like to rate the government’s performance as poor and their opinions are largely unchanged from 1997.

More Say Sweeping Change Is Needed

A majority of Americans (53%) say that the federal government needs very major reform, up sharply from 1997, when 37% expressed this view. Fewer than half (45%) think the government needs only some reform or not much change at all; in 1997, 62% said the government needed only some or little reform.

Unlike the rise in poor ratings for government performance, the belief that the federal government needs sweeping reform has increased among virtually all demographic and political groups. More non-Hispanic whites (55%) than non-Hispanic blacks (44%) say the government needs very major reform, but this view has increased among both groups since 1997.

Fewer than half of those under age 30 (44%) see very major reform as needed, the lowest percentage in any age group but more than the percentage of young people expressing this view in 1997 (35%). Majorities in older age groups now say the government needs very major reform, up substantially from 13 years ago.

Nearly two-thirds of Republicans (65%) say the government needs very major reform, up 23 points from 1997. Just four-in-ten Democrats (41%) agree. But even among Democrats, the share has grown by 11 points, from 30% in 1997.

A majority of independents (54%) say they think the government needs very major reform, compared with 39% in 1997. The increase among Republican-leaning independents (24 points) has been as large as among self-identified Republicans (23 points). Fewer than half of Democratic-leaning independents (43%) and non-leaning independents (48%) say government needs major reform.

Views of Government Power

Attitudes toward the scope of the federal government have undergone a significant change among Republicans and Republican-leaning independents. Two-thirds of Republicans (67%) and 70% of Republican-leaning independents say federal programs should be greatly reduced to reduce the power of government while fewer than half as many say they should be maintained. In 1997 modest majorities of both groups (53% and 54%, respectively) favored cutting back government programs.

By contrast, Democratic views about the size of government mirror opinions in 1997: 70% say federal programs should be maintained to deal with important problems. And there also has been little change since then in opinions among Democratic-leaning independents (67% programs maintained compared with 69% in 1997).

Beyond partisanship, the current survey shows that majorities of higher-income Americans (55% of those with family incomes of $75,000 or more), whites (53%) and men (52%) say that federal programs should be cut back to reduce the power of government. By contrast, most lower-income people (57% of those with incomes of $30,000 or less), Hispanics (66%), blacks (64%) and women (55%) say federal programs should be maintained to address important problems. There also are age differences in these opinions, with those under 30 the only group in which a clear majority (58%) says federal programs should be maintained.

Specific Criticisms of Government

The familiar complaint that the government is inefficient resonates widely with the public. Fully 70% say the criticism that “the government is wasteful and inefficent” represents a major problem; this view is shared by majorities across most political and demographic groups.

More than six-in-ten (62%) contend that it is a major problem that “government policies unfairly benefit some groups,” while smaller majorities say that about the criticism that “the government doesn’t do enough to help average Americans” (56%), and government “is too big and powerful” (52%). Fewer than half (46%) say the claim “government interferes too much in peoples’ lives” is a major problem with government.

While there are partisan differences in opinions about the government’s inefficiency, fairness and whether it does enough for average people, these are dwarfed by the enormous partisan divide over whether the government is too big and powerful.

More than twice as many Republicans (70%) as Democrats (34%) say the criticism that the government is too big and powerful is a major problem. And six-in-ten Republicans (61%) see the government interfering too much in people’s lives as a major problem compared with just 33% of Democrats.

Republicans (81%) also are more likely than Democrats (58%) to see government’s wastefulness and inefficiency and the claim that policies unfairly benefit some groups (66% and 55%, respectively) as major problems. More Democrats (63%) than Republicans (50%) say the criticism that the government fails to do enough to help average Americans is a major problem.

There are substantial differences by education when it comes to most of these questions, particularly the two criticisms concerning the federal government’s involvement in people’s lives. Fully 61% of those without college degrees say it is a major problem that the government doesn’t do enough to help average Americans; that compares with 43% of college graduates. And half (50%) of those without degrees see excessive government interference in people’s lives as a major problem compared with 37% of college graduates.

Whites are more likely than blacks to say several of these criticisms are major problems, although much of these racial differences are attributable to partisanship. Blacks are, however, as likely as whites to say that government interference in people’s lives is a major problem (47% of whites and 53% of blacks). Even when partisanship is controlled for, blacks are much more likely than whites to say this; fully 49% of black Democrats and Democratic-leaning independents see government’s interference in people’s lives as a major problem, compared with 28% of white Democrats and Democratic leaners.

Blacks are also more likely to say the criticism that the government doesn’t do enough to help average Americans is a major problem with government (71% vs. 53% of whites), and this racial gap persists within Democrats.

More Say Government has Wrong Priorities

While the belief that the government is inefficient is widespread, a growing percentage of the public says that the government’s priorities, rather than its inefficiency, are the bigger problem. Currently, 50% say the bigger problem with government is that it has the right priorities but runs its programs inefficiently, while 38% say the bigger problem is that it has the wrong priorities. In 1997, by more than two-to-one (61% to 29%), more saw inefficiency as the bigger problem.

In 1997, whites by two-to-one (60% to 30%) said that government’s bigger problem was that it had the right priorities but was inefficient. Today, whites are divided, with fewer than half (47%) citing inefficiency and 42% saying it has the wrong priorities. Opinions among African Africans are largely the same as in 1997 (63% inefficient, 24% wrong priorities).

A majority of Republicans (54%) now say that wrong priorities are government’s bigger problem; in 1997, most Republicans (57%) said government had the right priorities but was run inefficiently. By contrast, about six-in-ten Democrats (61%) say government’s bigger problem is inefficiency, which is little changed from 13 years ago (65%).

Regulation of Business, Interference with States

There continues to be broad public support for the stricter government regulation of major financial companies. However, a majority (58%) also says that the government “has gone too far in regulating business and interfering with the free enterprise system.” An identical percentage (58%) thinks the “federal government is interfering too much in state and local matters.”

The belief that the government has gone too far in regulating business is on par with opinions in 2000 (60%) and 1997 (56%). In 1995, however, nearly three-quarters (73%) agreed that the federal government was going too far in regulating business.

Fully 79% of Republicans say the government has gone too far in regulating business, up from 67% in 1997. The proportion of Democrats agreeing with this statement has slipped slightly since then (from 45% to 39%). Consequently, the partisan gap, already 22 points in 1997, has increased to 40 points.

The modest partisan gap among independents who lean to either party also has ballooned. Currently, 78% of Republican-leaning independents say government regulation of business has gone too far, compared with 43% of Democratic-leaning independents. In 1997, the differences in opinion between independents who lean Democratic and independents who lean Republican was just 10 points (59% vs. 49%).

Too Much Attention to Wall Street, Too Little to Middle Class

Fully half of the public (50%) says Wall Street gets more attention than it should from the federal government and nearly as many (45%) see business leaders receiving too much attention. Conversely, two-thirds (66%) say middle class people in this country get less attention than they should from the government, and that figure is up 12 points from 1997. A majority (69%) also sees small businesses getting too little attention from the federal government.

The belief that Wall Street gets too much government attention is shared across political lines: Identical majorities of Republicans and Democrats (52% each) say that Wall Street gets more attention than it should from the federal government, as do 47% of independents.

Somewhat more Democrats (49%) than Republicans (41%) say that business leaders get more attention than they should from the federal government. A plurality of independents (47%) also takes this view.

There also is considerable – and increasing – agreement that the middle class in this country gets less attention than it should from the federal government. Notably, about two-thirds of Republicans (68%), Democrats (67%) and independents (65%) say the middle class receives too little government attention; smaller majorities expressed this view 13 years ago.

Most people (56%) also say that poor people in this country get less attention than they should; but in contrast with opinions about the middle class, fewer say the poor gets too little attention than did so in 1997 (65%).

Slightly more than half of whites (52%) now say that poor people get too little attention, down from 62% in 1997. There has been less change among African Americans, who continue to overwhelmingly say that the poor gets too little attention (81%).

In the current survey, fewer Republicans say the poor get too little attention than did so in 1997 (39% now, 49% then); Democratic views are virtually unchanged. A slim majority (53%) of independents now say the poor get too little government attention, down from 70% in 1997. There have been comparable declines among Republican-leaning (20 points) and Democratic-leaning independents (19 points). However, Republican leaners continue to be far less likely than Democratic leaners to say the poor receive too little attention (38% vs. 63%).

Section 3: Government Challenges, Views of Institutions

While the public is highly critical of government, there is a widespread acknowledgement that government faces more daunting problems today than it did in the past. The public also puts some blame on itself: Most say Americans are unwilling to pay for the things they want government to do.

For the most part, people do not see themselves as overtaxed by the federal government. Half say they pay about the right amount in taxes, while a smaller percentage says they pay more than their fair share in taxes. The proportion saying they pay more than their fair share has declined modestly since 1997.

The public’s negative opinions about the federal government’s impact on the country are matched by equally abysmal ratings for the impact of major financial institutions and large corporations. And while fewer people say the federal government has a positive effect on people’s daily lives than in the late 1990s, this also is the case for state and local governments.

Government’s Job Seen as Harder

The view that government is now confronting more difficult problems is shared widely – even among those who say they are angry with government and those who agree with the Tea Party movement. Overall, 79% agree with the statement: “Government is facing more difficult problems than it did in the past.” Just 20% disagree with this sentiment.

Fully 70% of those who say they are angry with the federal government acknowledge that the government is facing tougher problems these days. That is only somewhat smaller than the percentages of those frustrated (80%) or content (83%) with the federal government.

Substantial majorities across the demographic and political spectrum agree that the government is facing more difficult problems than it once did. About eight-in-ten Democrats (83%) concur, as do 79% of independents and 74% of Republicans.

Public Seen as Unwilling to Pay

There also is agreement – though not nearly as widespread – that Americans are unwilling to pay for the things they want government to do. A majority (56%) agrees with this statement while 39% disagree.

The belief that the public is unwilling to pay for the things they want government to do also cuts across demographic and political lines. And while clear majorities of those who are content with the federal government and those who are frustrated (59% each) say Americans are unwilling to pay for the things they want from government, only about half of those who are angry with government agree (48%).

Similarly, 49% of those who agree with the Tea Party movement say the American public is unwilling to pay for the things they want government to do; a much higher percentage of those who disagree with the Tea Party (69%) say that people are unwilling to pay for the things they want from government.

Views of Taxation

Currently, 50% of the public says they pay about the right amount in taxes considering what they get from the federal government, while 43% say they pay more than their fair share of taxes; very few people (3%) say they pay less than their fair share. In 1997, a majority (52%) said they paid more than their fair share in federal taxes, while somewhat fewer (45%) said they paid their fair share.

Compared with other attitudes toward government, partisan differences in views of the federal tax burden are modest. Most Democrats (55%) say they pay about the right amount in federal taxes while 38% say they pay more than their fair share. Republicans and independents are more evenly divided, but nearly half in each group say they pay about the right amount considering what they get from the federal government (47% of Republicans, 49% of independents).

Compared with 1997, somewhat smaller proportions of Republicans, Democrats and independents now say they pay more than their fair share in taxes, while more view their federal tax burden as about right.

Notably, a majority of those who are frustrated with government (52%) say they pay about the right amount in federal taxes considering what they get from the government; 44% say they pay more than their fair share. In 1997, most (55%) of those who expressed frustration with government said they paid more than their fair share of taxes.

However, there has been almost no change in opinions among those who say they are angry with the federal government. Currently, 61% of those who are angry with the federal government say they pay more than their fair share of taxes, which is largely unchanged from 1997 (63%).

The public’s views of the taxes paid to state and local governments are similar to its view of the federal tax burden. About half (51%) say they pay the right amount in state taxes considering what they get from their state government; slightly more (55%) say they pay the right amount in local taxes. Opinions about both the state and local tax burdens are little changed from an NPR/Kaiser/Harvard survey conducted a decade ago.

Impact of Government, Other Institutions

Large majorities of Americans say that Congress (65%) and the federal government (65%) are having a negative effect on the way things are going in this country; somewhat fewer, but still a majority (54%), say the same about the agencies and departments of the federal government.

But opinions about the impact of large corporations and banks and other financial institutions are as negative as are views of government. Fully 69% say that banks and financial institutions have a negative effect on the country while 64% see large corporations as having a negative impact.

By contrast, two other business sectors – small businesses and technology companies – are widely seen as having a positive impact on the country. Fully 71% say small businesses have a positive effect while 68% view the impact of technology companies positively. Churches and religious organizations and colleges and universities were the only other institutions that majorities say have a positive impact on the country (63% and 61%, respectively).

The public is divided over the impact of the Obama administration – 45% say it is positive while the same percentage sees it as negative. This opinion closely resembles Barack Obama’s job approval in April (48% approve, 43% disapprove).

Most Americans feel that the national news media (57%) and the entertainment industry (51%) have a negative effect on the way things are going in this country. A plurality (49%) says the same about labor unions.

Critical of Government, Critical of Business

Predictably, people who say they are frustrated or angry with the federal government take a very dim view of government’s impact on the country. Yet they also offer critical views of the impact of a number of other institutions, particularly banks and large corporations.

Just 18% of those who feel frustrated with the government – and 16% of those who are angry – say that banks and financial institutions have a positive effect on the way things are going in the country. About the same percentage of the frustrated group (22%) says the federal government has a positive effect. Those who are angry, however, are less likely to give positive ratings to the federal government (7%) than to banks (16%).

Similarly, only about a quarter (24%) of those angry with government – and about the same percentage of those who are frustrated (23%) – think that large corporations have a positive effect on the country.

People who say they are basically content with the federal government not only are far more likely to say that the government has a positive effect, they also view the impact of other institutions more positively as well. For instance, 39% of those who are content with government say that banks and other financial institutions have a positive effect, roughly double the proportions of the frustrated and angry groups.

With a handful of exceptions, the “angry” group gives the institutions in the survey – government and non-government alike – the lowest positive ratings. Differences among the three groups are large in assessing the effects of the Obama administration and also in assessing the impact of colleges and universities. Just 42% of those who are angry at the federal government say that colleges and universities have a positive effect on the country, far lower than the percentages of those frustrated (64%) or basically content (81%) with government who express positive views.

Government’s Personal Impact

The proportion of Americans saying that the federal government’s activities, such as laws enacted, have a major impact on their day-to-day lives has changed little since October 1997. Currently, 89% say the federal government’s activities have a great (41%) or some (48%) effect; in October 1997, 90% said the government had a great (36%) or some (54%) effect. Similarly, opinions about how much the activities state and local governments affect people’s daily lives are about the same now as 13 years ago.

While the share who say government – at the federal, state or local level – has at least some effect on their day-to-day lives has changed little, the balance of opinion has become more negative toward the impact of all levels of government.

Overall, 38% of those who say the federal government has some effect on their day-to-day lives say that it has a positive impact; slightly more (43%) say the federal government’s activities have a negative personal impact. In 1997, half (50%) said the federal government’s impact was positive while 31% viewed it as negative.

Among Republicans, 60% see the impact of the federal government on their daily lives as negative while fewer than half as many (24%) see it as positive. In 1997, more Republicans said the government’s actions affected them positively rather than negatively (by 47% to 36%).

A narrow majority of Democrats (52%) says the federal government has a positive impact on their day-to-day lives, down from 60% in 1997. There has been comparable decline in positive views among independents (from 45% then to 36% today).

In 1997, those who said they were angry with the federal government overwhelmingly viewed its personal impact as negative (by 64% to 17%). Today, fully 75% see the government’s impact on daily life as negative while just 11% see it as positive. Among those frustrated with government, 44% see the federal government’s effect on daily life as negative, while 38% see it as positive; that is almost the opposite of their opinions in 1997 (45% positive, 36% negative).

State Governments Also Viewed More Negatively

In October 1997, nearly three times as many people who said their state government’s activities had an effect on their daily lives described the impact as positive rather than negative (62% vs. 21%). Today, just 42% say the personal impact of their state’s government is positive while nearly as many (39%) see it as negative.

The rise in negative opinions about the impact of state government activities has been most pronounced among Republicans: just 39% of Republicans say their state government has a positive effect on their day-to-day life, compared with 66% in 1997. Yet there also have been sizeable declines in positive views among independents (down 21 points) and Democrats (14 points).

People living in the West also assess the impact of state government actions more negatively than they did 13 years ago. In 1997, more than twice as many Westerners viewed the impact of state government’s activities as positive compared to negative (58% vs. 25%). Currently, only about a third (34%) of Westerners see the impact of their state government’s actions as positive while 48% see it as negative; the West is the only region where negative opinions significantly outnumber positive ones.

Views of Local Government

More people (51%) see local government’s activities as having a positive effect on their day-to-day lives than say that about the state or federal governments. Still, positive ratings also have declined since 1997 for local governments (from 64%).

More Republicans who say that local governments have a personal impact see that effect as positive rather than negative (by 48% to 33%). Still, positive evaluations of the effect of local governments have fallen from 70% in 1997. There have been smaller declines in positive views among Democrats (nine points) and independents (eight points).

Section 4: Congress and the Political Parties

Americans have long held mixed feelings about political leaders in Washington, but public perceptions of elected officials, Congress, and the political parties have turned sharply negative. In March, during the final debate over health care reform, just 26% of Americans offered a favorable assessment of Congress – by far the lowest in a quarter-century of Pew Research Center polling. And there was no improvement upon passage of the bill – just 25% offered a favorable assessment of Congress in early April, while 65% view Congress unfavorably.

When asked to describe the major problems with elected officials these days, there is no single criticism that dominates. Large majorities across partisan lines see elected officials as not careful with the government’s money, influenced by special interest money, overly concerned about their own careers, unwilling to compromise and out of touch with regular Americans. And the public sees the members of Congress themselves, not the system, as the root of the problem. More than half (52%) say the political system can work fine, it is the members of Congress that are the problem. Fewer (38%) are of the view that most members have good intentions but the political system is broken.

Increasing partisanship is a factor behind these assessments, and the public also has turned harshly critical of the political parties at unprecedented levels – with Democrats suffering the biggest declines over the past year. Favorability of the GOP dropped precipitously in late 2005, reaching 42% following Hurricane Katrina and, aside from brief spikes following the 2008 Republican convention and in February of this year, it has remained at roughly 40% since then.

As recently as January 2009, Democrats held a 22-point lead over Republicans in favorability (62% vs. 40%); today that advantage is gone, with just 38% offering a favorable assessment of the Democratic Party and 37% for the Republican Party. The extent to which the parties are seen as part of the problem today is perhaps best seen in the average rating for both, which never fell below 50% from 1992 through 2004, but has been in negative territory for most of the past six years. It reaches a new low of 38% in the latest poll.

While the overall image of the parties has never been lower, there has been a slight recovery in views of each party’s leaders in Congress, as each party’s base offered more praise in April than they did in March. Currently, 38% approve of the job Democratic leaders in Congress are doing, up from 31% a month ago – the share of Democrats offering a positive mark rose from 58% to 71%. Ratings for Republicans leaders rose slightly from 25% to 30% overall, driven by a shift from 49% in March to 60% currently among Republicans. There was no commensurate rise in party favorability ratings within each party’s base. Despite these slim gains, majorities continue to say they disapprove of the job each party’s leaders are doing in Congress.

Sliding Favorability for Congress

In January 2009, 40% of Americans said they had a favorable opinion of the then-new 111th Congress. That rose to 50% in April 2009. By last August, as the health care debate was heating up and many lawmakers faced angry town hall meetings with constituents, favorability dropped to 37%. It hovered near four-in-ten in early February (41%), but then dropped to 26% in mid-March as lawmakers maneuvered over the fate of health care reform legislation. And there has been no change with the passage of the health care reform legislation: in early April, favorability stands at 25%. Close to two-thirds (65%) say they have an unfavorable opinion of Congress; 30% of those say very unfavorable. These recent numbers are the most negative in the history of Pew Research Center surveys since July 1985.

Last April, 66% of Democrats had a favorable view of Congress; this April, that is down to 40%. Just more than half (52%) say they have an unfavorable opinion, with 19% saying their opinion is very unfavorable. Among Republicans, just 29% had a favorable opinion of Congress last April; that has fallen to 13% in the new survey. Close to eight-in-ten Republicans (79%) say they have an unfavorable opinion, including 42% who say their opinion is very unfavorable.

Close to half of independents (47%) had a favorable view of Congress in April 2009. That has now slipped to 23%. About two-thirds of independents (68%) say they have an unfavorable opinion of Congress, including 31% who say very unfavorable. Among Republican-leaning independents, 79% say they have an unfavorable opinion of Congress, while just 16% say they have a favorable opinion.

Favorability Down Sharply For Democrats, Already Low for Republicans

The 2008 election brought the nation a Democratic president in Barack Obama and larger Democratic majorities in the House and the Senate. In January 2009, more than six-in-ten Americans (62%) said they had a favorable opinion of the Democratic Party, but that high level of positive opinion would not last. Today, 38% say they have a favorable view of the party, the lowest in nearly two decades of Pew Research Center polling.

Republicans, meanwhile, are roughly where they were at the start of last year. Today, 37% say they have a favorable opinion of the Republican Party; in January 2009, 40% said this. The difference between Democratic and Republican favorability has dropped from 22 points to one.

In the month before the 2008 election, Democrats had a 17-point advantage on favorability. In October 2006, just before the election that gave Democrats control of Congress, they held a 12-point edge. Interestingly, there was no difference in favorability in the summer before the 1994 election that saw Congress flip from Democratic to Republican control. That July, 62% said they had a favorable opinion of the Democratic Party, while 63% said they had a favorable view of the Republican Party.

That year, both parties were seen a largely favorable light. The average of the two together was 63%. For several years after that, one party’s higher rating would offset the other’s lower one, keeping the average above 50% – until July 2005. Near the end of the 2006 campaign, Republican favorability had slipped to 41% – from 51% in June 2004 – and the two-party average dropped to 47%.

The average then stayed around 50% through Obama’s election and the start of the current Congress. But the highly partisan debate over health care legislation over the past year seems to have taken a toll. In March, as lawmakers debated the final version of the health care legislation, the average favorability stood at 39%. This month, with that round in the fight now history, neither party has made any gains and the average stands at 38%.

Independents Less Favorable Toward Democrats

Since January 2009, the Democratic Party has seen the largest declines in favorability among independents, though it has lost ground among its own members and Republicans as well. Currently, 27% of independents say they have a favorable opinion of the Democratic Party, down from 58% in January 2009.

At the start of the Obama administration, 30% of Republicans said they had a favorable opinion of the Democratic Party. That is now down to 10%. And among Democrats, favorability has dropped from 90% in January 2009 to 78%.

The Republican Party, on the other hand, started with relatively lower numbers that have changed only slightly. Close to four-in-ten independents (38%) said they had a favorable view of the party in January 2009; that is now 33%. About two-in-ten Democrats (22%) had a favorable view of the opposition party at the start of 2009. That is now down to 12%. And among Republicans, favorability of the GOP today stands at 79%, not significantly changed from 74% in early 2009.

Low Numbers for Congress and the Parties Heading into Midterms

The current favorability rating for Congress (25% favorable) is much lower than in mid-1994 (53%) or fall 2006 (41%), mid-term election years that resulted in a large turnover of seats – and changes in control – in Congress.

Not surprisingly, in all three cycles, ratings of Congress are highest among people who identify with the party in control: Republicans in 2006, and Democrats in 1994 and today. However, where roughly two-thirds of Democrats in 1994 (64%) and Republicans in 2006 (65%) offered a favorable assessment of Congresses controlled by their party’s leaders, just 40% of Democrats today have a positive view of a Congress controlled by their own party’s leaders.

Ratings of the political parties are also starkly lower today than in these previous critical midterms. Favorability for the Democrats today (38%) is lower than in either 1994 (62%) when they went on to lose their majority, or 2006 (53%) when they went on to win a majority. In July 1994, more than six-in-ten Americans (63%) had a favorable opinion of the Republican Party. That number stood at 41% going into the 2006 mid-terms and is at a similar point today (37%).

The erosion of party images is most severe among political independents. In 1994 most independents viewed the Democratic Party (60%) and the Republican Party (64%) in positive terms. In 2006 – the year Democrats took control of Congress – substantially more independents offered a favorable view of the Democratic Party (48%) than the GOP (35%). This year, independents have about the same view of both parties (33% favorable for the Republican Party, 27% for the Democratic Party).

But party images are even suffering within each party’s political base as well. In 1994, 94% of Republicans had a favorable view of their party, compared with 79% today. Among Democrats, 94% had a favorable view of their party in 1994, compared with 78% today.

More See Lawmakers as Problem than System

Asked if they think the political system is broken or if lawmakers are more to blame for today’s views of Congress, just more than half (52%) say “it’s the members of Congress that are the problem.” On the other hand, close to four-in-ten (38%) agree with the statement: “Most members of Congress have good intentions, it’s the political system that is broken.”

On balance, Republicans, Democrats and independents all tend to see the problem lying more with the members than the system, but Republicans are particularly of this view. By nearly two-to-one (60% vs. 34%) Republicans see the members of Congress themselves as the problem, not the system. The margin is in the same direction, but smaller among Democrats (50% vs. 42%) and independents (51% vs. 39%).

On this question, the responses of independents who lean toward either of the political parties are about the same: 53% of Republican-leaning and 51% of Democratic-leaning independents say it is the members of Congress that are the problem.

Common Criticisms of Elected Officials

When people are asked what they see – in their own words – as the biggest problem with elected officials in Washington, several common themes emerge. Almost two-in-ten (18%) say elected officials are influenced by special interest money, 14% say they care only about their political careers, 12% say they are out of touch with regular Americans and another 12% say they are not willing to work together and compromise.

Smaller percentages cite other concerns: 7% say they see elected officials in Washington as liars or dishonest, 5% point to the fight over health care, 4% each cite the economy, the notion that officials are all talk and little action or that the members of Congress themselves are the problem.

And when Americans are asked separately whether some of the more frequently voiced criticisms are major problems, there is little disagreement. Large majorities see as major problems a lack of care with the government’s money (83%), the influence of special interest money (82%) and the notion that elected officials “care only about their own political careers” (81%). Just under eight-in-ten say the same about officials’ unwillingness to compromise (78% a major problem) and the notion that elected officials are out of touch with regular people (76%).

Republicans are most likely to say that a lack of care with the government’s money represents a major problem (93%), but three quarters of Democrats (75%) agree, as do 85% of independents. There is little partisan difference in assessing the problem posed by the influence of special interest money: 86% of Republicans say this, along with 81% of Democrats and 82% of independents. And partisans on both sides see little effort to reach compromise: 80% of Republicans see this as a major problem, about the same as Democrats (82%) and independents (77%).

Republicans and independents are slightly more likely than Democrats to see the idea that elected officials are out of touch with regular people as a major problem: 81% of Republicans and 80% of independents say this, compared with 69% of Democrats.

Poor Ratings for Congress Higher Than in 2005

When Americans are asked to assess several specific aspects of congressional performance, the responses, not surprisingly, also are decidedly negative. Much higher percentages rate the performance as poor than did so in 2005, the last time this series of questions was asked.

For example, 60% say Congress has done a poor job of working across party lines; 24% say only fair and 10% say excellent or good. In 2005, when Republicans controlled both the Congress and the White House, 37% rated congressional performance on this question as poor, 28% said only fair and 18% said excellent or good.

Five years ago, 29% gave Congress a poor rating for acting ethically and honestly, 43% said only fair and 23% said excellent or good. Now, 50% give Congress a poor rating for this, 31% say only fair and just 13% say excellent or good.

There are large swings toward poor ratings since 2005 among Republicans and independents, in part reflecting the shift to Democratic control of Congress following the 2006 midterm elections. There is less change among Democrats, who were more negative than the other groups five years ago.

In 2005, 12% of Republicans gave Congress a poor rating for how it was dealing with issues important to the nation, compared with 36% of independents and 42% of Democrats. Today, 58% of Republicans give Congress a poor rating on this, compared with 31% of Democrats. More than half of independents (54%) agree, including 66% of Republican-leaning independents.

Currently, close to two-thirds of independents (64%) say Congress does a poor job “understanding the needs of people like yourself,” up 20 points from 44% in 2005. Just more than seven-in-ten Republican-leaning independents say this (72%). About six-in-ten Republicans (59%) agree, compared to 41% of Democrats. In the case of Republicans, the number is up 39 points from 2005 (20%). About half of Democrats gave Congress a poor rating on this measure in 2005 (49%), but that has not improved much with Democrats in control. Currently, 41% say Congress does a poor job of understanding the needs of people.

Most See Congress’ Impact as Negative

Nearly two-thirds of Americans (65%) say that Congress is having a negative effect on the way things are going in this country today, an assessment comparable to the negative assessments for the federal government as a whole (65%), large corporations (64%) and banks and financial institutions (69%).

Among Republicans, 78% say Congress is having a negative effect on the country, while about half of Democrats (51%) agree. Close to seven-in-ten independents (68%) see Congress having a negative effect, but among independents who say they lean Republican that number jumps to 80%. Among those who say they lean Democratic, 57% say Congress has a negative effect on the country.

Young people are less likely than older age groups to say Congress is having a negative effect on the country. Half of those ages 18 to 29 say this, compared with 74% of those ages 50 to 64 and 68% of those 65 and older. About six-in-ten (59%) of those with a high school diploma or less education say Congress is having a negative effect, compared with 73% of those with a college degree or more education.

Section 5: Views of Federal Departments and Agencies

Favorable ratings for most federal agencies and departments tested, in this study have declined substantially since the late 1990s. And job performance ratings for most federal agencies are lackluster: Of 15 agencies included in the survey, majorities give positive job performance ratings to only six.

Nonetheless, most Americans (70%) think that the government is a good place to work, and 56% say if they had a son or daughter getting out of school they would like to see him or her pursue a career in government. In contrast, just 36% say they would like their child to pursue a career in politics, while 55% would not.

Declining Favorability for Agencies

Favorable opinions have declined significantly for seven of 13 federal agencies included in the current survey and in the study of attitudes about government conducted in 1997-1998. The most striking shift since then has occurred in views of the Department of Education.

Currently, 40% have a favorable opinion of the Department of Education while 53% have an unfavorable view. In October 1997, favorable views of the Education Department outnumbered unfavorable ones by a wide margin (61% to 37%).

Favorable ratings for a number of other agencies have fallen by double digits since 1997/1998: the Food and Drug Administration, the FDA (by 17 points), the Social Security Administration (13 points), the Environmental Protection Agency, the EPA (12 points), the National Aeronautic and Space Administration, NASA (12 points), and the Centers for Disease Control, the CDC (also 12 points).

Opinions of the Defense Department also are somewhat less positive than in October 1997, although they remain highly favorable (76% then, 67% today). As was the case 13 years ago, the Postal Service receives the highest favorable ratings of the agencies included in the survey: 83% now have a favorable opinion of the Postal Service, compared with 89% in October 1997.

Views of the Federal Bureau of Investigation, the FBI (currently 67% favorable), Veterans Administration, the VA (57%), the Central Intelligence Agency, the CIA (52%), and the Justice Department (51%) are little changed from 1997/1998. Meanwhile, the Internal Revenue Service (the IRS) is viewed slightly more favorably than it was 13 years ago. Currently, 47% say they have a favorable impression of the IRS, up from 38% in 1997. The current measure is about the same as the percentage expressing a favorable opinion of the IRS in an August 1987 survey by the Roper Org. (49%).

While opinions of some federal agencies have become more negative since the late 1990s, favorable opinions of Congress have plummeted. Currently, just 26% express a favorable view of Congress, down from 53% in October 1997 and 64% a decade earlier (January 1988).

Less Positive Views of Education Department

Favorable opinions of the Department of Education have fallen across the political and demographic spectrum. In October 1997, 65% of women and 57% of men said they had a favorable impression of the department; today, only about four-in-ten women (39%) and men (40%) feel favorably toward the Department of Education.

Fewer than half of Democrats (46%), Republicans (40%) and independents (37%) express a favorable opinion of the Education Department; in 1997, 71% of Democrats had a positive view as did 59% of independents and 54% of Republicans.

Social Security Administration Seen Less Favorably

In October 1997, 64% of Democrats and the same percentage of Republicans said they had a favorable opinion of the Social Security Administration. There has been no change in the percentage of Democrats who view the Social Security Administration positively, but favorable opinions among Republicans have fallen 18 points since then, to 46%. There has been a comparable decline in positive opinions among independents (from 59% favorable then to 43% today).

People ages 65 and older express much more favorable opinions of the Social Security Administration than do those in younger age groups. However, the proportion of seniors expressing positive opinions of the Social Security Administration have declined by 17 points since October 1997 – from 86% to 69%. The decline has been as large among the 50 to 64 age group; currently, only about half (51%) of those 50 to 64 have a favorable impression of the Social Security Administration.

Performance Ratings

The public makes major distinctions as to how well various federal departments and agencies do their jobs. Fully 80% of the public says the military does an excellent (39%) or good (41%), while 70% say the same about the Postal Service.

Clear majorities also give excellent or good job ratings to the CDC (62%), the Defense Department (60%), NASA (57%) and the FBI (58%). By contrast, opinions of the job performance of other agencies are less positive – including the CIA (46% excellent/good), EPA (43%), FDA (43%), Department of Homeland Security (43%) and Veterans Administration (41%).

Notably, just a third (33%) says the Department of Education does an excellent (5%) or good job (28%); 64% say the department does only fair (35%) or poor (29%). Positive job ratings also are relatively low for the Social Security Administration (36% excellent/good), Justice Department (38%) and IRS (40%).

Four-in-ten say that the Obama administration does an excellent (10%) or good (30%) job; a majority (58%) says it does only fair or poor. The administration’s job rating is lower than Barack Obama’s job approval rating (48% approval). More than twice as many people give the Obama administration positive job marks as rate the job performance of Congress positively; just 17% say Congress is doing an excellent (2%) or good job (15%) while 80% say it has done only fair (40%) or poor (40%).

Views of Agencies among the Angry

As expected, those who express negative opinions about the federal government generally – those who say they are frustrated (56% of public) or angry (21%) with government – give federal agencies less positive job ratings than do those who say they are basically content with the federal government (19%).

Still, the opinions of agencies among those who are frustrated and angry are not uniformly negative. Among those who say they are frustrated with government, majorities give positive job ratings to six agencies or institutions: the military (81% excellent/good), the Postal Service (71%), the CDC (64%), the Defense Department (62%), the FBI (59%), and NASA (57%).

Even among those who say they are angry with the federal government, majorities give positive ratings to four agencies or institutions (the military, Postal Service, NASA and Defense Department), while half (50%) give the CDC excellent or good ratings and about as many (49%) say the same about the FBI.

Those who are frustrated with government give the lowest job ratings to the Department of Education (32%), the Social Security Administration (35%) and the Justice Department (37%). Among those who are angry with government, just 18% say the Department of Education is doing an excellent or good job, while 21% give positive ratings to the Justice Department and 23% say the same about Social Security and the IRS.

Majorities of those who say they are basically content with the federal government give positive job ratings to 12 of 15 federal agencies or institutions included on the survey. Those who feel content with government give mixed job ratings to both the Department of Education (49% excellent/good, 49% only fair/poor) and the Social Security Administration (50%, 48%). Fewer than four-in-ten (37%) of those who are content with government give positive job ratings to the Veterans Administration while 47% say that agency does only fair or poor.

Fully seven-in-ten (70%) of those who say they are content with government say the Obama administration has done an excellent or good job; that compares with 37% of those who are frustrated with government and 19% of those who are angry with government. But fewer than half (41%) of those who are basically content with government give Congress positive job ratings; Congress’ ratings are considerably lower among those who are frustrated (13%) and angry (4%) with government.

Partisan Differences Over Agencies’ Performance

The partisan differences in job ratings for federal agencies are modest in comparison with the enormous divide in views of the Obama administration. More Democrats than Republicans give positive marks to the EPA (by 15 points), Social Security (14 points) and the Postal Service (13 points).

By contrast, the military, the Defense Department, CIA, and Department of Homeland Security all get higher marks from Republicans than Democrats.

Just 12% of Republicans say the Obama administration has done an excellent or good job. That compares with 34% of independents and 68% of Democrats. Congress gets low job performance ratings across the board: just 10% of Republicans, 14% of independents and 24% of Democrats say Congress has done an excellent or good job.

Government as a Career

A sizeable majority of Americans (70%) think that the government is a good place to work, and more than half (56%) say that if they had a son or daughter finishing school they would like to see them pursue a career in government. Fewer say that they would like to see their children go into politics (36%); nonetheless, perhaps as a consequence of the weak economy, the proportions who would recommend careers in both government and politics have both increased over the last decade.

The proportion expressing a positive view of their child having a career in government is up 13 points (from 43%) in a May 2000 NPR/Kaiser/Harvard survey. And compared with the previous Pew Research survey on attitudes toward government in 1997, more also say they would like to see a child pursue politics as a career (from 27% to 36%).

Government Critics See It as Good Place to Work

Majorities across all major demographic and political groups say that government is a good place to work. And 72% of those who feel frustrated with the federal government think that the government is a good place to work, while just 21% do not. Even among those who are angry with the federal government, 55% say the government is a good place to work while 39% say it is not.

Those who say they agree with the Tea Party movement generally also see government as a good place to work. More than six-in-ten (64%) of those who agree with the Tea Party movement have a positive view of government employment, as do 82% of those who disagree with the Tea Party.

As was the case in 1997, people who see the government as a good place to work most often cite the benefits as the main reason why; 30% cite the benefits, while 21% cite job security, 20% cite the pay, 18% say the work is challenging while 7% say the hours are good. These views vary little across political and demographic groups.

There is a similar pattern in opinions about whether people would like to see their child pursue a career in government. More Democrats (65%) than Republicans or independents (52% each) say they would welcome their child having a career in government.

Majorities of those who are basically content (71%) and frustrated (57%) with the federal government say they would like their child to have a career in government. But just 40% of those angry with the federal government agree; 51% in this group say that if they had a son or daughter finishing school, they would not like to see him or her pursue a career in government.

Careers in Politics

Since 1997, there has been a modest rise in the percentage saying that if they had a son or daughter just getting out of school, they would like to seem them pursue a career in politics (from 27% to 36%). Still, most people (55%) would not view politics as a good career choice for a young person.

People younger than 30 – as well as those ages 50 to 64 – have more positive views of a career in politics than they did in 1997. Currently 45% of those younger than 30 say if they had a son or daughter they would like to see them go into politics, up from 29% in 1997; nearly four-in-ten (37%) of those 50 to 64 express this view, compared with just 22% in 1997. Independents also are more likely to view a career in politics more positively than they did in 1997. Currently, 36% of independents say they would like to see their child pursue a political career, nearly double the percentage in 1997 (19%).

Section 6: Tea Party and Views of Government Overreach

Over the past year, the Tea Party movement has emerged on the political scene. A majority of the public has heard about the Tea Party protests that have taken place in the U.S. and about a quarter of Americans say they agree with the movement.

Tea Party backers overwhelmingly identify with or lean to the Republican Party and describe their political views as conservative. Virtually all of them express feelings of frustration or anger with the federal government. A large majority of Tea Party backers distrust government and believe it has too much power and control over their lives.

Looking at the public as a whole, nearly half say the federal government threatens their personal rights and freedoms – with three-in-ten saying the government is a major threat. The percentage saying the government is a major threat to their personal rights and freedoms is now higher than when the question was first asked in 1995 and throughout the early 2000s. This shift has come almost entirely from Republicans and independents who lean to the GOP.

Does Federal Government Threaten Personal Rights and Freedoms?

Currently, 30% of Americans say the federal government is a major threat to their personal rights and freedoms. That is up from 18% in October 2003 and more than the previous high of 23% in June 2000. Another 17% now say they see the government as a minor threat. Still, half of the public (50%) says they do not think the government threatens their personal rights or freedoms, little changed from percentage who said this in October 2003 (54%).

There is a substantial partisan and ideological divide about whether the federal government is a major threat to personal rights and freedoms. Currently, far more Republicans and independents who lean Republican say this than did so in 2003 during George W. Bush’s first term as president. By contrast, opinion among Democrats and those who lean Democratic has shifted little since that time.

Nearly half (47%) of conservative Republicans now say the government is a major threat, up from just 13% in 2003. Similarly, more than twice as many moderate Republicans now say the federal government is a major threat to their personal rights and freedoms than did so in 2003 (12% in 2003, 32% now). There also has been a large shift among independents who lean Republican (19% in 1995 to 50% now).

Today, Democrats are far less likely than Republicans to say that the federal government is a threat to their personal rights and freedoms. Less than one-in-five (18%) say the government is a major threat, not much different from the 21% that said this in 2003. And liberal Democrats (15%) are nearly as likely to say this as conservative and moderate Democrats (19%). Similarly, 21% of independents who lean Democratic say the federal government is a major threat to their personal rights and freedoms; 19% said this in 2003.

There also are significant demographic differences in who believes the federal government is a major threat to their personal rights and freedoms. More men (34%) than women (27%) say the government is a major threat. Whites (31%) also are more likely than blacks (23%) to say the federal government is a major threat to their rights and freedoms.

Young people are less likely than others to say the government is a major threat to their personal rights and freedoms. About a quarter (24%) of those under 30 say this, compared with 34% of those ages 30 to 49 and 30% of those 50 and older. Fewer college graduates (24%) than those with high school education or less (34%) say the government is a major threat.

There also are differences in opinion by religious affiliation. White evangelicals are the most likely to say the government threatens their personal rights and freedoms; 42% say the government is a major threat, compared with 30% or less in other religious groups and only 20% of the religiously unaffiliated.

Those who are angry with the federal government are more than twice as likely as those who are frustrated or content to say that the government threatens their personal rights and freedoms. More than six-in-ten (62%) of those who say they are angry see the government as a major threat, compared with 26% of those who are frustrated with the federal government and 12% who are basically content. (For more detailed breakdowns on perceived threat posed by the federal government to personal rights and freedoms, see table on pg. 87)

Secession?

Two-thirds of the public (67%) opposes allowing an American state to secede and become independent from the country if a majority of the people from that state wanted to do this; just a quarter (25%) favor allowing secession. Although views about government have become more negative since the late 1990s, the proportion that favors allowing a state to secede is little changed from the 23% that said this in 1997. Opposition to allowing secession has decreased somewhat from 73% in 1997.

More than a third of independents who lean to the GOP (36%) favor allowing a state to secede. This is more than within any other partisan or ideological group. There are also modest demographic differences on this question. About three-in-ten (29%) people under 50 favor allowing a state to secede, compared with 21% of those 50 and older. Americans with a high school education or less are more likely than those with a college degree to favor this (30% vs. 18%). There are no significant differences in the percentages that favor allowing secession by geographic region.

Who Agrees with The Tea Party Movement?

A majority of Americans (68%) have heard or read about the Tea Party protests that have taken place in the U.S. over the past year; 26% have heard a lot, while 42% have heard a little. Tshree-in-ten have heard nothing at all about these protests. More Republicans (33%) and independents (28%) than Democrats (21%) have heard a lot about the Tea Party protests. Conservative Republicans (39%) and independents who lean to the GOP (41%) are the most likely to have heard a lot about the protests.

Overall, 24% of Americans say they agree with the Tea Party movement, including 9% who agree strongly; 14% say they disagree with the movement. Three-in-ten say they have no opinion, while 31% say they have not heard of the Tea Party movement.

There are strong partisan and ideological differences in views about the movement. Nearly half (45%) of Republicans agree with the Tea Party movement, compared with 26% of independents and only 6% of Democrats. More than half of conservative Republicans (53%) and independents who lean Republican (53%) say they agree with the Tea Party movement, compared with 27% of moderate Republicans. Far fewer in all other partisan and ideological groups say they agree with the movement.

A majority of those under 30 (54%) have not heard about the Tea Party protests, compared with 31% of those ages 30 to 49 and 21% of those 50 and older. Young people also are far less likely to agree with the Tea Party movement. Only 9% of those under 30 agree with the movement, compared with 23% of those ages 30 to 49 and 32% of people 50 and older. (For more detailed breakdowns on opinion about the Tea Party movement, see table on pg. 90)

Which Group Best Reflects Your Views Right Now?

When the public was asked in a separate survey which group best reflects your views right now, 31% say the Democratic Party best reflects their views right now, 17% cite the Republican Party, and 14% say the Tea Party. Far fewer mention the Green Party (4%) or some other group (3%). And more than a quarter (28%) says none of these represents their views.

Half of Republicans (49%) say the GOP best represents their views right now but 28% cite the Tea Party. A plurality of all independents (42%) says none of these currently reflects their views while 17% say the Democratic Party, 16% the Tea Party and 12% the Republican Party. Independents who lean to the GOP are divided – as many say the Tea Party (30%) best reflects their views right now as cite the Republican Party (29%) – and 28% say nobody is representing their views.

Among independents who lean to the Democratic Party, 47% say that party best represents their views and 35% think nobody is representing their views. And about two-thirds (65%) of independents who do not lean to either the Republican or Democratic Party say that none of these groups represents their views. A large majority of Democrats (71%) say the Democratic Party best reflects their views while 14% say none of these groups does.

Demographic Profile of Tea Party Backers

Looking at the 24% of the public who agree with the Tea Party movement, they are decidedly more Republican in partisan identification and more conservative than the general public. In addition, those who agree with the Tea Party movement are more likely to be male, white, affluent, weekly church attenders and to follow national news very closely.

More than eight-in-ten (82%) Tea Party backers either identify as Republicans (53%) or say they are independents who lean Republican (29%). By comparison, 41% of the general public identify as Republicans (28%) or lean to the GOP (13%). And while nearly half (46%) of the public are Democrats or independents who lean to the Democratic Party, only 13% of those who agree with the Tea Party movement say they are Democrats or Democratic-leaning independents.

Nearly three-fourths (72%) of Tea Party backers describe their political views as conservative. By comparison, 41% of the public says their views are conservative. And a plurality of those who agree with the Tea Party movement say they are conservative Republicans (43%).

A majority (56%) of Tea Party backers are men. Men make up 49% of the general public. And although young people comprise 21% of the general public, only 8% of those who agree with the Tea Party are under 30. About eight-in-ten (81%) are non-Hispanic whites, compared with 69% of the general public.

Only 18% of those who agree with the Tea Party movement have family incomes of less than $30,000, compared with 31% of the general public. Close to four-in-ten Tea Party sympathizers (38%) have a high school education or less, compared with 47% of the general public. There are no differences between the public and Tea Party backers in employment status.

More than half (55%) of those who agree with the Tea Party say they follow national news very closely. About three-in-ten (31%) in the general public say the same. Nearly nine-in-ten (87%) are registered to vote, compared with 76% of the general public. About half (51%) of Tea Party backers say they are more patriotic than most, while 33% of the general public say they are more patriotic than most. Three-fourths display the flag at their home, office or on their car, compared with 58% of the public as a whole.

About half (49%) of those who agree with the Tea Party attend church or other religious services at least once a week; 38% of the public attends services weekly. And nearly half (47%) of Tea Party backers have a gun, rifle or pistol in their home, compared with 33% of the general public.

Tea Party Critical of Big Government

Tea Party backers have even more negative views about government than the public more broadly. Fully 43% of those who agree with the Tea Party movement are angry with the federal government, compared with 21% of the general public. Among those who agree strongly, 61% are angry with the government. Similarly, 24% of those who agree with the Tea Party movement say they never trust the government in Washington to do what is right (including 34% who strongly agree with the Tea Party movement); 11% of the general public says the same.

In addition, 73% of Tea Party backers say the federal government threatens their personal rights and freedoms, including 57% who say the government is a major threat. Among those who strongly agree with the movement, 86% say the federal government threatens their personal rights and freedoms and 73% say it is a major threat. By comparison, the general public is divided. Nearly half (48%) say the government threatens their personal rights and freedoms, including 30% who say it is a major threat, while 50% say it does not threaten their rights and freedoms.

Three-fourths of those who agree with the Tea Party movement say the federal government needs very major reform, compared with 53% of the general public. Those who agree with the Tea Party movement are particularly critical about the size and scope of the federal government. A majority (59%) of Tea Party backers feel the bigger problem with government is that it has the wrong priorities, while 32% say it has the right priorities but runs programs inefficiently. By comparison, 38% of the public says the government has the wrong priorities; half (50%) says the government has the right priorities but runs things inefficiently.

A large majority (76%) of Tea Party backers generally believe that federal government programs should be cut back greatly to reduce the power of government, while only 23% say government programs should be maintained to deal with important problems. The public is much more divided in its view; 47% say programs should be cut to reduce the government’s power and 50% says programs should be maintained. And, although 88% of those who agree with the Tea Party think that the federal government being wasteful and inefficient is a major problem, 70% of the public feels the same. About eight-in-ten (82%) Tea Party backers think that the government being “too big and powerful” is a major problem, compared with 52% of the general public.

Three-fourths of those who agree with the Tea Party movement say it is a major problem that the government interferes too much in people’s lives; 46% of the public says the same. Seven-in-ten (71%) say the federal government has a negative effect on their day-to-day lives, compared with 43% of the general public. Tea Party backers are also more likely to agree that the federal government is interfering too much in state and local matters; 83% say this, while 58% of the public thinks the federal government is interfering too much. Similarly, 87% of Tea Party sympathizers agree that the government has gone too far in regulating business and interfering with the free enterprise system, compared with 58% of the public.

Jobs Top Priority for Tea Party Backers and Public

Tea Party backers and the public as a whole both put the job situation at the top of the government’s priority list. A majority (54%) of those who agree with the Tea Party movement say that the job situation should be the highest priority; 49% of the general public agree. But Tea Party backers are more likely than the public to say the budget deficit should be given the highest priority; 32% say this compared with 19% of the general public.

Those who agree with the Tea Party movement are more likely to say the federal government, Congress, the Obama administration and many other institutions have a negative effect on the way things are going in this country today. Fully 90% of those who agree with the Tea Party movement say the federal government has a negative effect, compared with 65% in the general public. Similarly, 86% say Congress has a negative effect on the country; 65% of the public says the same. And while 45% of the public says the Obama administration has a negative effect on the country today, 84% of Tea Party backers think this.

Those who agree with the Tea Party movement also are more likely than the general public to say labor unions, government agencies, the news media and the entertainment industry have a negative effect on the country today. The public and Tea Party backers agree that banks and financial institutions and large corporations have a negative effect on the country today. Still, a majority (56%) of those who agree with the Tea Party movement think it is a bad idea for the government to more strictly regulate the way major financial companies do business. A majority of the public (61%) thinks this is a good idea.

Somewhat more Tea Party backers (56%) than the public overall (43%) say they pay more than their fair share of federal taxes. A greater share (47% vs. 39%) say the same about state taxes.

Section 7: Electoral and Political Implications

Broad public frustration with government and politics is likely to play a major role in the midterm congressional elections this fall, and all signs suggest it benefits the Republican Party. In particular, seven months before the midterm elections, anti-incumbent sentiment has reached record levels, and anti-government sentiment is energizing many Republican-inclined voters.

Voters are evenly divided in their candidate preferences for this fall; 44% favor the candidates of each party, with 12% undecided. This is comparable to the voters’ preferences in July 1994, when Republicans went on to win a majority of House seats. However, despite growing frustration with politics over the past year, voter preferences have not tilted further in the GOP’s direction since August of last year. (For more detailed breakdowns of Congressional vote preferences, see table on pg. 93)

Record Anti-Incumbent Sentiment

Just 43% of voters now say they would like to see their member of Congress reelected in the fall. This is a record low point in the 16 years since Pew Research first began asking this question, and a significant drop from the already-low numbers seen last month.

Anti-incumbent sentiment is relatively widespread, with just 41% of Republicans, 54% of Democrats and 36% of independents saying they would like to see their representative reelected. This marks the lowest percentage of support for incumbents among both Republicans and independents over the last five midterm election cycles. And the 54% of Democrats expressing support for their incumbent nearly matches the Democrats’ anti-incumbent mood in 2006, when Republicans controlled Congress.

Similarly, opinions about whether most members of Congress should be reelected now match the previous lows. Today, just 27% of voters say they would like to see most members reelected; this is down from earlier in the year, and is at about the same level as in the fall of 1994, just prior to the ouster of many incumbent representatives.

Views of Government and the 2010 Vote

Both voting preferences and enthusiasm are strongly related to dissatisfaction with government. This is particularly true among independents; overall, independents slightly favor the Republican candidate, by a 41% to 34% margin. But among independents who score high on an index of dissatisfaction with government, Republicans enjoy a five-to-one (66% to 13%) advantage while Democrats hold a two-to-one advantage (49% vs. 24%) among the remainder of independent voters.

Dissatisfied independents also are more anti-incumbent; six-in-ten (60%) say they do not want to see their representative reelected in the fall, compared with 44% of more satisfied independents.

And anti-government sentiment is also linked to enthusiasm about voting. About three-quarters (78%) of independents who are dissatisfied with government say they are absolutely certain they will vote, compared with 58% of more satisfied independent voters.

The link between dissatisfaction and voting among independents remains strong even when party leaning is taken into account. Nearly four-in-ten (37%) independents say they lean Republican in their party identification, representing 13% of voters overall. Within this group, those who are highly dissatisfied with government are more likely than their more satisfied counterparts to support the GOP’s candidate in their district, and 85% say they are certain to vote, compared with 62% of more satisfied Republican-leaning voters.

And the potential mobilizing effect of anti-government sentiment is seen among self-identified Republicans as well – 83% of highly dissatisfied Republican voters say they are absolutely certain they will vote, compared with 67% of those who are more satisfied. By contrast, within Democrats and Democratic leaners, there is no significant difference in engagement by level of satisfaction with the federal government.

In short, the current enthusiasm gap between Democratic and Republican voters this fall is strongly associated with anti-government sentiment. Overall, 76% of Republican and Republican-leaning voters say they are certain they will vote, compared with 63% of Democratic and Democratic-leaning voters. Relatively satisfied Republican voters are no more committed to voting than are Democrats – it is the highly dissatisfied Republicans and independents that are driving this difference.

Dissatisfaction and Health Care Reform

Public views on health care reform were highly partisan from the start, but views of government also played a substantial role. In a December 2009 Pew Research Center poll, 84% of people opposed to health care reform said “too much government involvement” was a major reason for their opposition – more than any other concern listed.

In the March survey – conducted during the final debate over the bill in Congress – 40% of Americans favored the legislation, while 47% opposed it. Among the segment of the public most dissatisfied with government in general, 83% opposed the bill, while a slim majority (53%) of more satisfied Americans favored it.

Highly dissatisfied Republicans nearly universally opposed the legislation (93% oppose, 3% favor), while opposition was less overwhelming among more satisfied Republicans (67% oppose, 22% favor).

Among independents, the gap in opinion between the satisfied and the dissatisfied is even wider. Highly dissatisfied independents opposed the legislation by an 82% to 12% margin, while more satisfied independents favored the legislation than opposed it (49% favor, 33% oppose). Seven-in-ten Democrats backed the legislation in the weeks before the bill passed, and there were too few highly dissatisfied Democrats to analyze.

Dissatisfaction and Financial Regulation

Americans back stricter regulation of major financial institutions by nearly two-to-one (61% good idea, 31% bad idea). But the majority of those who are highly dissatisfied with the federal government say increased regulation would be a bad idea (54% bad idea, 40% good idea).

Overall, most Republicans oppose stricter financial regulations (39% good idea, 54% bad idea), but there are significant differences by level of satisfaction with the federal government. On balance, more satisfied Republicans favor financial regulation than oppose it (50% good idea, 42% bad idea), while dissatisfied Republicans oppose it by a greater than two-to-one margin (29% good idea, 66% bad idea).

Most independents support greater financial regulation. About six-in-ten (63%) say it is a good idea to more strictly regulate the way major financial compaies do business, while three-in-ten (30%) say this is a bad idea. But, as with Republicans, there is a significant split in opinion by level of satisfaction with government. Dissatisfied independents are more evenly divided about increased financial regulation (50% good idea, 45% bad idea); by contrast, more satisfied independents favor increased regulation by a greater than three-to-one margin (71% good idea, 21% bad idea). Democrats overwhelmingly favor stricter regulation (78%), and there are too few highly dissatisfied Democrats to analyze the effect of anti-government sentiment on their views.

About the Index of Satisfaction with Government

Throughout this chapter, we compare the views of people who are more and less dissatisfied with government based on an index of questions from the March 11-21 2010 survey:

• Federal government or Congress effect on the country (Q18aF1 & Q18hF2) • Content, frustrated or angry with the federal government (Q20) • Trust in the federal government (Q21) • Maintain or cut back federal government programs (Q23) • Criticism of the federal government justified or not (Q25) • Federal government needs major reform, some reform, or no reform (Q26) • Federal government’s effect on your own day-to-day life (Q27a/Q28a) • Congressional job performance (Q52a) • Obama administration job performance (Q52b) • Federal agency job performance (The average rating given to nine federal agenciesor instituions Q52d, Q52f, Q52g, Q52i, Q52l, Q52m, Q52n, Q52p, Q52r) •Perceived threat of the federal government to personal rights and freedoms (Q73)

Those we define as highly dissatisfied are Americans who score in the top 30% on this index. Republicans and independents who lean to the Republican party are the most likely to pass this threshold: 51% of Republicans and 59% of Republican leaners are considered to be highly dissatisfied on this index. By comparison, relatively few Democrats (9%) or independents who lean to the Democratic Party (15%) score as highly dissatisfied with the federal government.

To see how your views of the federal government compare with the respondents in this survey, you can answer the questions on our website (http://pewresearch.org/satisfaction/) and see your score.

About the Survey

Most of the analysis in this report is based on telephone interviews conducted under the direction of Princeton Survey Research Associates International among a national sample of 2,505 adults living in the continental United States, 18 years of age or older, from March 11-21, 2010 (1,677 respondents were interviewed on a landline telephone, and 828 were interviewed on a cell phone, including 301 who had no landline telephone). Both the landline and cell phone samples were provided by Survey Sampling International. Interviews were conducted in English and Spanish. For detailed information about our survey methodology, see the methodology section of our website at: https://alpha.pewresearch.org/pewresearch-org/politics/methodology/.

The combined landline and cell phone sample are weighted using an iterative technique that matches gender, age, education, race/ethnicity, region, and population density to parameters from the March 2009 Census Bureau’s Current Population Survey. The sample is also weighted to match current patterns of telephone status and relative usage of landline and cell phones (for those with both), based on extrapolations from the 2009 National Health Interview Survey. The weighting procedure also accounts for the fact that respondents with both landline and cell phones have a greater probability of being included in the combined sample and adjusts for household size within the landline sample. Sampling errors and statistical tests of significance take into account the effect of weighting.

The following table shows the error attributable to sampling that would be expected at the 95% level of confidence for different groups in the survey:

In addition to sampling error, one should bear in mind that question wording and practical difficulties in conducting surveys can introduce error or bias into the findings of opinion polls.

About the additional surveys

In addition to the main survey described above, this report is supplemented with three additional surveys. Results for these three surveys are based on landline and cell phone interviews conducted under the direction of Princeton Survey Research Associates International among nationwide samples of adults, 18 years of age or older, living in the continental United States. The landline and cell phone samples were provided by Survey Sampling International. Interviews were conducted in English.

The first survey was conducted March 18-21, 2010 among a sample of 1,002 adults (671 respondents were interviewed on a landline telephone, and 331 were interviewed on a cell phone, including 143 who had no landline telephone). The second survey was conducted April 1-5, 2010 among a sample of 1,001 adults (670 respondents were interviewed on a landline telephone, and 331 were interviewed on a cell phone, including 120 who had no landline telephone). The third survey was conducted April 8-11, 2010 among a sample of 1,001 adults (670 respondents were interviewed on a landline telephone, and 331 were interviewed on a cell phone, including 124 who had no landline telephone).

The combined landline and cell phone sample are weighted using an iterative technique that matches gender, age, education, race/ethnicity, region, and population density to parameters from the March 2009 Census Bureau’s Current Population Survey. The sample is also weighted to match current patterns of telephone status based on extrapolations from the 2009 National Health Interview Survey. The weighting procedure also accounts for the fact that respondents with both landline and cell phones have a greater probability of being included in the combined sample and adjusts for household size within the landline sample. Sampling errors and statistical tests of significance take into account the effect of weighting.

The error attributable to sampling that would be expected at the 95% level of confidence for the total sample in each survey is plus or minus 4 percentage points. In addition to sampling error, one should bear in mind that question wording and practical difficulties in conducting surveys can introduce error or bias into the findings of opinion polls.