Pew Research Center

FOR RELEASE MARCH 18, 2010

Gloomy Americans Bash Congress, Are Divided on Obama

Health Care Reform - Can't Live With It, or Without It

FOR MEDIA OR OTHER INQUIRIES:

Communications Department
202.419.4372
www.pewresearch.org

RECOMMENDED CITATION

Pew Research Center, March 2010, "Gloomy Americans Bash Congress, Are Divided on Obama"

About Pew Research Center

Pew Research Center is a nonpartisan, nonadvocacy fact tank that informs the public about the issues, attitudes and trends shaping the world. It does not take policy positions. The Center conducts public opinion polling, demographic research, computational social science research and other data-driven research. It studies politics and policy; news habits and media; the internet and technology; religion; race and ethnicity; international affairs; social, demographic and economic trends; science; research methodology and data science; and immigration and migration. Pew Research Center is a subsidiary of The Pew Charitable Trusts, its primary funder.

© Pew Research Center 2026

Table of contents

  • About Pew Research Center
  • Gloomy Americans Bash Congress, Are Divided on Obama
  • Section 1: Obama Approval and Image
  • Section 2: Views of Congress
  • Section 3: Views of Health Care Legislation
  • Section 4: National Economy and Personal Finances
  • Section 5: Opinions About Afghanistan and Iraq
  • About the Survey

Gloomy Americans Bash Congress, Are Divided on Obama

Health Care Reform - Can't Live With It, or Without It

Overview
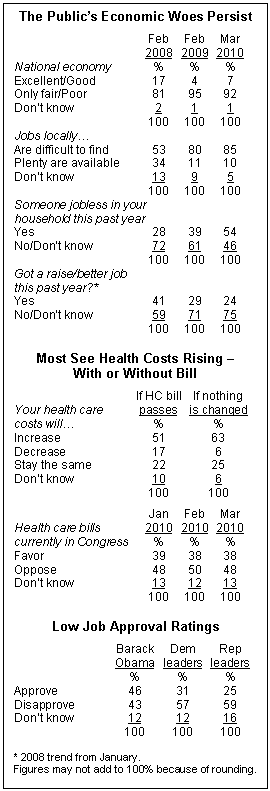
As the day of reckoning for health care reform approaches, Americans have little to cheer about. Nearly everyone (92%) gives the national economy a negative rating. Closer to home, 85% say that jobs are hard to find in their community. A majority (54%) now says that someone in their household has been without a job or looking for work in the past year, compared with 39% in February 2009. And the proportion saying they got a pay raise or a better job in the past year fell from 41% in January 2008 to 24% currently.

Public gloom about the economy and personal finances extends to opinions about the future of health care costs. Regardless of what happens with the health care bills this week, Americans expect their own health care costs to rise in the coming years. While 51% say their health care costs would increase if the proposed legislation becomes law, even more (63%) believe their health care costs will increase if no changes are made to the health care system.

The latest national survey by the Pew Research Center for the People & the Press, conducted March 10-14 among 1,500 adults, finds that public views of the health care bills before Congress remain more negative than positive – 48% generally oppose the bills before Congress while 38% favor them. But just 18% of Americans would prefer Congress pass nothing and leave the current system as it is.

It is in this context that attitudes toward Washington are best understood. When asked for a single word that best describes their impression of Congress, “dysfunctional,” “corrupt,” “self-serving” and “inept” are volunteered most frequently. Of people offering a one-word description, 86% have something negative to say, while only 4% say something positive.

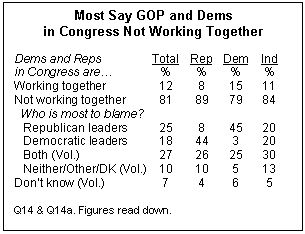
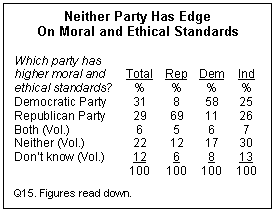
Just 12% believe that Republicans and Democrats are working together in dealing with important issues facing the country – 81% don’t think so. While more blame Republican leaders than Democratic leaders for this (by 25% to 18%), fully 27% volunteer that both are to blame. And when asked which party has higher moral and ethical standards, neither party has an advantage – 31% name the Democratic Party, 29% name the GOP, while 22% volunteer neither.

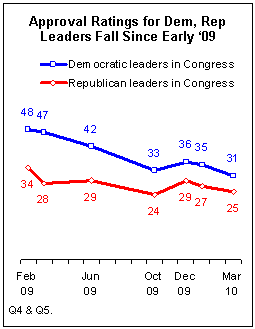
The sour public mood and disillusionment with Washington is apparent in Barack Obama’s job approval ratings as well. For the first time in Pew Research Center survey, nearly as many say they disapprove (43%) of Obama’s job performance as approve (46%). Even so, Obama’s approval rating is well above the 31% who say they approve of the job the Democratic congressional leaders are doing and the 25% who give positive job ratings to GOP leaders.

Afghanistan Opinions More Positive
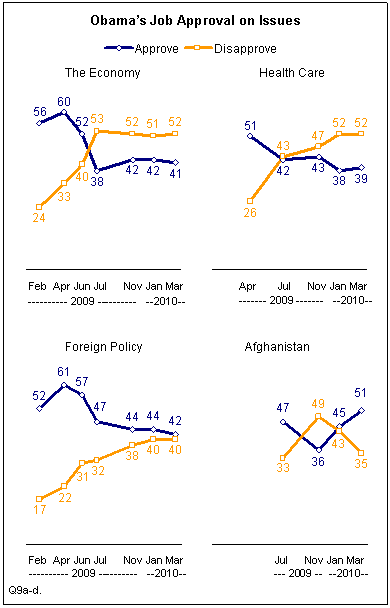
Obama’s ratings for dealing with specific issues are for the most part a little lower than his overall rating, which is typically the case for presidents. Roughly four-in-ten approve of the way Obama is handling foreign policy (42%), the economy (41%) and health care (39%).

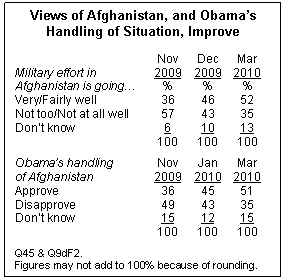
An exception to this pattern is the public’s view of his handling of the situation in Afghanistan. In the new survey, more approve (51%) than disapprove (35%) of Obama’s job performance on Afghanistan; opinion was evenly divided in December 2009, while in November more disapproved than approved. Independents (51% approve) and Republicans (42%) give Obama much higher ratings on Afghanistan than other issues.

Republicans also are more likely than Democrats to think that things are going well in Afghanistan (61% vs. 52%). But perceptions of the U.S. military effort in Afghanistan have improved overall since November. In addition, a clear majority of the public (59%) continues to say that the United States will definitely or probably succeed in achieving its goals there.

Personal Views of Obama
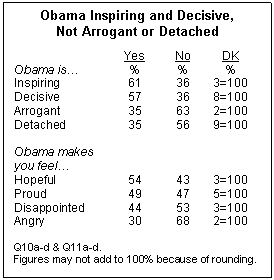
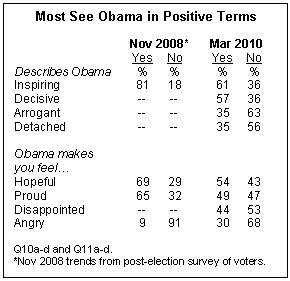
While the public is divided over Obama’s job performance, many Americans continue to express positive personal opinions of him. Majorities see Obama as inspiring (61%) and decisive (57%), and relatively few regard him as arrogant (35%) or detached (35%). Many also say that Obama makes them feel hopeful (54%) and proud (49%). Just 30% say that Obama makes them angry, while somewhat more (44%) say he makes them feel disappointed.

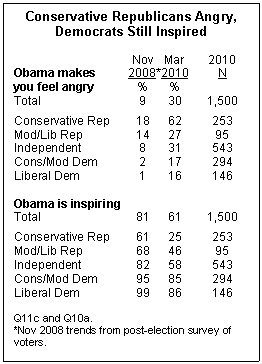
Obama’s personal ratings are less positive than they were just after his election in November 2008. The changes in opinion of him have occurred across the political spectrum. But far fewer conservative Republicans say Obama is inspiring (61% to 25%) and far more say he makes them angry (18% to 62%). There also have been substantial changes in the views of independents: In November 2008, 68% said Obama made them feel hopeful; 48% say that today. Democrats are somewhat less positive about Obama than they were just after the election, but relatively small percentages see him as arrogant, detached or disappointing.

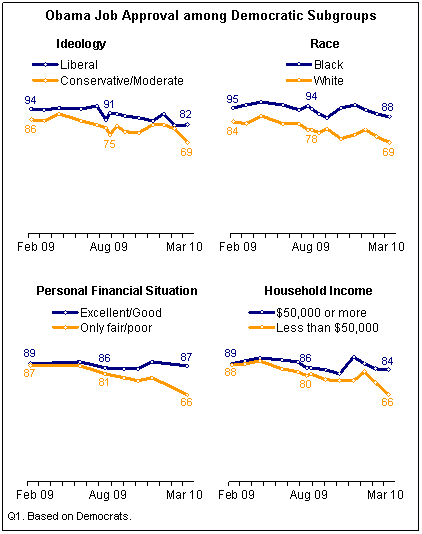
The survey finds that since the start of the year, most of the slippage in Obama’s job approval rating has come among Democrats – particularly Democrats with lower incomes. Currently, 74% of Democrats approve of the way Obama is handling his job as president, down from 84% in January. Obama’s approval rating is down 17 points over this period among Democrats with family incomes of less than $50,000 (from 83% to 66%), but is largely unchanged among those with incomes of $50,000 or more (89% to 84%).

Most Health Care Opponents Want New Bill

Opinion about the health care bills being discussed in Congress continues to be deeply split along partisan lines. Fully 81% of Republicans generally oppose the current bills while 62% of Democrats generally favor them. Far more independents still oppose (56%) than favor (32%) the health care bills.
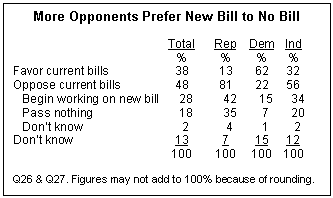
While the current bills draw more opposition than support, opponents generally prefer that Congress begin working on a new bill (28% of the public) rather than pass nothing and leave the health care system as it is (18%).

Notably, 71% of the bills’ opponents say they expect their own health care costs will go up in coming years if the legislation is enacted – but 62% predict their costs will rise if no changes are made to the health care system. Among the supporters of the current bills, far more say their future costs will increase if nothing is done on health care (67%) than if the legislation passes (27%).

Job Problems Cut a Wide Swath

The number of Americans reporting that they or someone in their household has been without a job and looking for work in the past year has risen sharply; currently 54% say that, compared with 42% last October and 39% in February 2009.
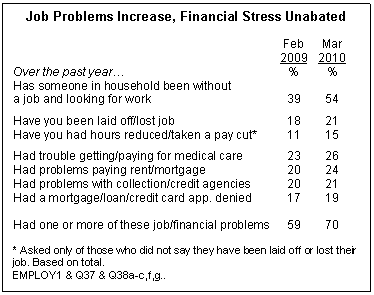
People are experiencing other job and financial stresses at similar or slightly higher levels than in February 2009. Roughly one-in-five (21%) say they have lost their job or been laid off, while 15% say they have had their hours reduced or taken a pay cut.

Aside from job-related issues, about a quarter (26%) say they had trouble getting or paying for medical care for themselves or their family, while 24% say they have had problems making their rent or mortgage payment. Overall, 70% of Americans say they have faced one or more job or financial-related problems in the past year, up from 59% in February 2009.

Moreover, these concerns show no sign of easing in the future: 25% of those who are currently employed say it is very or somewhat likely they may be asked to take a cut in pay, 24% say it as least somewhat likely they may be laid off. Comparable proportions say it is very or somewhat likely their health care benefits (23%) or retirement benefits (22%) will be reduced or eliminated by their employer. These levels of concern are similar to February 2009.

Section 1: Obama Approval and Image

For the first time in his presidency, public evaluations of president Obama’s job performance are split nearly evenly, with 46% approving and 43% disapproving. There has been a substantial erosion of support within Obama’s political base in recent months. In January 84% of Democrats approved of his job performance – 74% say the same today, while disapproval over this period has nearly doubled from 9% to 17%. More independents disapprove (49%) than approve (37%) of the president, virtually identical to the balance of opinion in January, though independent evaluations have fluctuated in recent months. Republicans remain overwhelmingly negative, with 73% disapproving and just 17% approving of the president’s job performance.

Inside the Democratic Base

The slide in Obama’s approval rating among Democrats crosses ideological lines. Currently, 82% of liberal Democrats approve of his performance, down slightly from 90% in January and 91% last August. But the president’s approval ratings remain significantly lower among conservative and moderate Democrats – 69% of whom approve today, down from 82% as recently as January. There also remains a difference along racial lines – 88% of black Democrats approve of the president’s job performance, compared with 69% of white Democrats.

Where Obama is notably losing support is among Democrats who are struggling financially and those with lower incomes, resulting in a widening economic division within the party when it comes to evaluations of the president. Among Democrats who rate their own personal finances as only fair or poor, only 66% approve of the president’s job performance, down from 81% in August and 87% last February. By contrast, Democrats who say they are in excellent or good shape financially continue to overwhelmingly back the president – 87% approve today, virtually unchanged from last August (86%) or February (89%).

Similarly, the share of Democrats with household incomes of less than $50,000 annually who approve of the president stands at 66% today, down from 80% last August and 88% last February. Meanwhile, approval has remained relatively steady among higher income Democrats– 84% approve today, virtually unchanged from last August (86%) or February (89%).

Obama Inspiring and Decisive, Not Arrogant or Detached

While the public divides about evenly in evaluating Obama’s overall job performance, the personal reactions people have to Obama remain generally positive. Solid majorities say they think of Obama as inspiring (61%) and decisive (57%), while only about a third thinks of him as arrogant (35%) or detached (35%).

When asked if Obama makes them feel hopeful, 54% say yes and 43% say no. About half (49%) say Obama makes them feel proud, though roughly as many (47%) say he does not. Fewer than half (44%) say they feel disappointed in Obama, while 53% are not disappointed. Three-in-ten (30%) say Obama makes them feel angry.

Positive personal reactions to Obama are far less widespread

today than was the case in a poll of voters conducted the week after his election in November 2008. Then, 81% found Obama inspiring, compared with 61% today. Roughly two-thirds in the post-election poll said Obama made them feel hopeful (69%) and proud (65%). Today, roughly half say each of these words applies. And right after his election, just 9% said Obama made them feel angry, compared with 30% today.

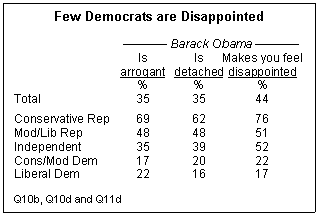
But anger with Obama is widespread only among those on the political right; 62% of conservative Republicans say Obama makes them feel angry, compared with 27% of moderate and liberal Republicans, 31% of independents and 17% of Democrats. Similarly, while most conservative Republicans see Obama as arrogant (69%) and detached (62%), fewer than half in all other political groups – including moderate and liberal Republicans – agree.

Just 20% of Democrats say they feel disappointed in Obama, while 79% do not, and there is little difference

between liberals (17% disappointed) and conservatives and moderates (22%) in the party. As with other negative assessments, disappointment is widespread among conservative Republicans (76%), though roughly half of moderate and liberal Republicans (51%) and independents (52%) say they also feel disappointed in Obama.

Barack Obama’s job approval ratings on the key domestic issues of the economy and health care are holding steady, with slim majorities disapproving on both issues. But there has been improvement in the public’s evaluation of how Obama is handling the situation in Afghanistan. Currently, 51% approve, up from 45% in January and a low of 36% in November when the president was still debating what approach to take in Afghanistan. Republicans, in particular, have a vastly improved impression of Obama’s handling of this issue – currently 42% of Republicans approve of how Obama is handling Afghanistan, while the same number disapprove. In November, just 19% of Republicans offered a positive assessment while 68% were negative.

Section 2: Views of Congress

Americans remain highly critical of the job performance of both Democratic and Republican leaders in Congress. Many offer harsh assessments when asked for one word impressions of the current Congress. Among the most frequently offered are variations on dysfunctional, corrupt, self-serving and inept.

Job approval ratings for the leaders of both parties (31% for Democratic leaders, 25% for Republican leaders) hover near all-time lows in 15 years of Pew Research Center surveys. Currently, 57% disapprove of how Democratic leaders are doing their job – the highest disapproval levels of the current term – while 59% disapprove of the job Republican leaders are doing – little changed from recent months.

Gridlock in Congress is undoubtedly a factor in these ratings, and here there is plenty of blame to go around. About eight-in-ten (81%) say Democrats and Republicans are not working together in Congress to deal with the important issues facing the country. And while slightly more blame the Republican leaders (25%) than the Democratic leaders (18%) for gridlock, a substantial share volunteers that both parties are equally to blame (27%).

The number of Democrats who say they disapprove of the job being

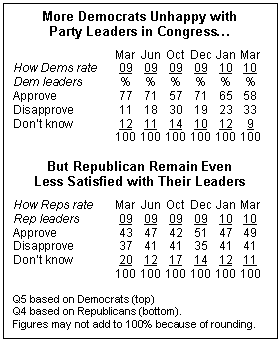
done by their party’s leaders in Congress increased from 19% in December to 23% in January to 33% today. The percentage approving of their performance fell from 71% to 58% over the same period. This marks a return to the low ratings Democrats gave their party’s leadership last October.

Even with growing Democratic frustration, it is the Republicans who continue to express broader disapproval of their leadership. Just 49% of Republicans approve of the job Republican leaders are doing, while 41% disapprove. Republican views have remained largely unchanged over the course of the past year.

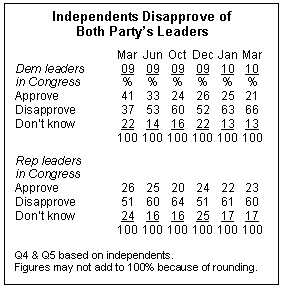
In the early part of 2009, Democratic leaders in Congress enjoyed more support from independents than did their Republican counterparts. But by the latter part of 2009 – and through today – independents have been offering equally negative assessments of both parties. Among independents, disapproval of Democratic leaders has nearly doubled over the

past year from 37% last March to 66% currently. Disapproval is largely unchanged since January (63%). Only 21% of independents now approve of the job being done by Democratic leaders. That is little changed from January (25%), but about half of where approval stood in March 2009 (41%).

Independent opinion of GOP leaders shows less movement. Currently, 23% approve of the job being done by Republican leaders, about the same as the 26% that said this in March 2009 or 22% this January. Disapproval among independents is up slightly from 51% last March to 60% now.

Negative Words for Congress

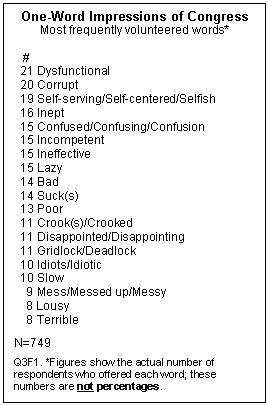
When Americans are asked to provide the one word that best describes their current impressions of Congress, the three most frequently offered terms are dysfunctional (21 people offered this), corrupt (20) and some version of self-serving, self-absorbed or selfish (19). Many of the words reflect perceptions that Congress has been unable or unwilling to enact legislation. For example, 16 people described Congress as inept, while 15 each offered variations on confusing, incompetent, ineffective or lazy. Slightly smaller numbers (11 each) refer to disappointment or gridlock.

Note that all of these figures represent the actual number of people offering each word, not percentages. With such a wide range of terms volunteered, no single word is offered by more than 3% of the 749 people asked the question.

While the complaints vary, the critical tone of peoples’ responses is nearly universal. Of people offering a description, fully 86% volunteered a word that was negative, while just 4% offered positive words such as good (7 people) or OK (4).

Few See Efforts at Bipartisanship

Eight-in-ten Americans (81%) say Democrats and Republicans in Congress are not working together. And the feeling crosses party lines – 89% of Republicans, 84% of independents and 79% of Democrats see partisan gridlock. The public puts slightly more of the responsibility for this on Republican leaders: 25% say GOP leaders are most to blame, while 18% say Democratic leaders are most to blame. Still, 27% volunteer that leaders of both parties are to blame for failing to work together.

Not surprisingly, Democrats tend to put more blame on Republican leaders (45% say GOP leaders are most to blame, 25% volunteer both and 3% say their own party’s leaders are to blame), while Republicans blame Democrats (44% say Democratic leaders are most to blame, 26% say both and 8% say Republican leaders).

Independents say leaders of both parties share responsibility for the lack of bipartisanship. Two-in-ten say leaders of each party are most to blame (20% say Republicans, 20% say Democrats). Three-in-ten (30%) independents volunteer that both parties’ leaders are to blame.

Who’s More Ethical?

Americans are divided over which political party demonstrates higher personal standards. About three-in-ten (31%) choose the Democrats, when asked which party has the higher moral and ethical standards, while a comparable number (29%) choose the Republicans. Notably, more than two-in-ten (22%) volunteer “neither.”

Not surprisingly, Democrats and Republicans are most likely to say their own party has higher standards (69% of Republicans choose the GOP, while 58% of Democrats choose their own party). Independents, again, are divided: 26% say the Republican Party has higher moral and ethical standards, while 25% say the Democratic Party does. Among independents, 30% volunteer “neither.”

Section 3: Views of Health Care Legislation

Public views of the health care bills being discussed in Congress have remained quite stable over the past few months. As has been the case since last July, there is more opposition than support for these proposals.

Currently, 48% say they generally oppose the health care bills in Congress while 38% say they generally favor them. That is almost identical to the balance of opinion in February and January.

When opponents are asked about what they prefer Congress to do, somewhat more (28% of the public) say they would prefer that Congress begin working on a new bill rather than pass nothing and leave the current system as it is (18% of the public).

As has been the case since last summer, there are wide partisan divisions in opinions about health care legislation. Republicans continue to overwhelmingly oppose the health care bills in Congress (by 81% to 13%) while Democrats favor the measures by a smaller margin (62% to 22%). A majority of independents (56%) generally oppose the bills while 32% generally favor them. The balance of opinion within all three partisan groups is largely unchanged in recent months.

A 42% plurality of Republicans would prefer that Congress begin working on new health care legislation, while 35% would prefer that Congress pass nothing and leave the current system as it is. Looking specifically at conservative Republicans, 85% of whom oppose the health legislation, preferences are divided almost evenly – 42% want to see new legislation started, while 39% would prefer that Congress pass nothing and leave the system as it is.

Regardless, Most See Their Health Costs Rising

About half of Americans (51%) say that if the health care bills in Congress become law, they expect their own health care costs would go up in coming years; nearly a third (32%) say their health costs would go up a lot.

Fewer than one-in-five (17%) say their health costs would go down if the legislation passes, while 22% say they expect their costs would stay the same.

But the public’s predictions about future health care costs are even more negative if no changes are made to the health care system: 63% say their own costs would go up in coming years, while 37% say they would go up a lot. Just 6% see their future costs decreasing if the status quo continues, while 25% say they would stay the same.

Opponents of the current bills overwhelmingly believe that passage of health care legislation will raise their own health costs in coming years: 71% expect their costs would go up with 52% saying they would go up a lot. But a sizeable majority of those who generally oppose the health care bills in Congress (62%) say they expect their future health care costs would rise if no changes are made in the health care system; however, far fewer (32%) say their costs would increase a lot under this scenario than if the bill passes.

Those who generally favor the health care bills being discussed in Congress mostly say they expect their costs to stay the s ame (36%) or decrease (31%) if the legislation passes; just 27% expect their health costs to rise in coming years. Two-thirds (67%) of supporters of health care legislation say their costs would rise in coming years if no changes are made in the system; 46% say their costs would increase a lot if the status quo continues.

Health Care Opinions Stable

As has consistently been the case over the past nine months, support and opposition to the health care bills before Congress divide along partisan lines. Even within the political parties, there are only modest differences of opinion between the more conservative and more liberal wings. Seven-in-ten (70%) liberal Democrats back health reform, compared with 61% of moderate and conservative Democrats. Last July, the margin among Democrats was only slightly wider, 74% of liberals and 57% of moderates and conservatives backed the bills.

Since last July, younger Americans repeatedly offered more support for the health bills in Congress than older Americans. Currently, 41% of 18 to 29-year- olds back the bill, compared with 34% of people age 65 and over. This is little changed from the 44% to 29% difference of opinion last July, and tracking opinions over the past nine months (see chart next page) shows little substantial variation over time.

Similarly, there is modestly greater support for the legislation among the roughly one-in-five Americans who are currently without health insurance. Currently, the uninsured favor the bills by a 48% to 37% margin, while Americans with coverage oppose it by a 51% to 36% margin. Again, these opinions are little changed over the course of the past nine months.

Gender, education and income have never been highly significant factors in views of the health care legislation. Across most polls, lower income Americans backed the bill by slightly higher margins than upper income Americans. Currently 45% of people with family incomes under $30,000 support the bills, compared with 39% of people earning $75,000 or more. This is consistent with previous polling; last July, the gap between low and high income support was 44% vs. 35%.

Section 4: National Economy and Personal Finances

Americans continue to offer negative views of the national economy. A majority (53%) of the public says economic conditions are poor and 39% say conditions are only fair. Only 7% rate the economy as excellent or good. Ratings of the national economy have remained very low for about two years. But far fewer say that economic conditions are poor than did so a year ago; in March 2009, 68% rated the national economy as poor.

Not only are assessments of the nation’s economy are quite negative, many think it will take time for the economy to improve. Nearly half (48%) of Americans say it will be a long time before the economy recovers; 37% say the economy is not yet recovering but will recover soon, and only 13% say the economy is now recovering.

Republicans and independents offer more negative assessments of current economic conditions and are more likely to think that recovery will take a long time. Majorities of Republicans (61%) and independents (57%) say the nation’s economy is in poor condition, compared with 43% of Democrats.

Similarly, 54% of Republicans and 51% on independents say that it will be a long time before the economy recovers. Democrats are more optimistic; 42% say the economy is not yet recovering but will recover soon while 39% say that it will be a long time before the economy recovers.

When asked which economic issue is most worrisome, 45% cite the job situation, far more than the percentage

saying the federal budget deficit (22%), rising prices (17%) or problems in the financial and housing markets (11%).

There are significant differences in the top national economic worry by party affiliation and income. Republicans are about as likely to say the budget deficit (35%) is their top concern as cite the jobs situation (39%). By comparison, 55% of Democrats say jobs is their top economic worry, 19% say rising prices and only 12% mention the deficit. About four-in-ten (41%) independents say jobs is their top national economic worry and 25% cite the budget deficit.

Among those with family incomes less than $30,000, 47% mention jobs and 24% cite rising prices as their top national economic worry; only 13% mention the deficit. But among those earning $75,000 or more, 38% cite jobs and 33% say the deficit is their top economic concern.

Jobs Scarce Locally

Fully 85% now say that jobs are difficult to find in their community, up from 80% in February 2009 and 53% a year earlier. Only 10% of Americans say there are plenty of jobs available in their area.

About nine-in-ten (92%) of those with family incomes of less than $30,000 a year say that jobs are difficult to find in their local community. Yet perceptions of the local job market are only somewhat better among more affluent Americans: 75% of those with incomes of $75,000 or more say that jobs are hard to find in their local community.

More Households Hit by Joblessness

Over the course of the past year, 70% of Americans say they have experienced at least one job-related or other personal financial problem, an increase from 59% who reported having one of these problems in February of last year. In particular, the proportion of Americans who report that over the previous 12 months that they or someone in their household has been without a job and looking for work is now 15 points higher than it was last year (54%, from 39%).

Consistent with these reports of financial problems, Americans’ overall assessments of their personal financial situations continue to be largely negative. About six-in-ten (61%) now say their financial situation is only fair (39%) or poor (22%), virtually unchanged since late 2008. However, there has been an uptick in optimism about the future; 61% now say they think their personal financial situation will improve in the next year, up from 53% in December and 54% in February 2009.

The increase in the proportion of Americans who say that they or someone in their household has been out of work in the past year has occurred across most demographic groups. Nevertheless, younger, less-educated and lower-income Americans remain more likely than older and more affluent people to say they have been affected by unemployment.

Seven-in-ten (70%) of those younger than 30 report household unemployment, compared with 58% of those 30 to 49 and 52% of 50 to 64-year-olds. Those 65 and older are less likely than younger people to report that someone in their household is unemployed and looking for work (29%); yet even among those in this age group there has been a 10-point increase in the percentage reporting household unemployment over the last year.

Majorities of those with a high school education or less (61%) and those with some college experience (54%) report having experienced household unemployment. Among both groups, this is up 15 points from February 2009. While household unemployment among college graduates has also risen, far fewer than those in other groups report this (41%). The pattern among income groups is similar, as two-thirds of those with annual family incomes of less than $30,000 (66%) report household unemployment, co mpared with 39% of those with annual family incomes of $75,000 or more.

Blacks (52%) and whites (50%) and are now about equally likely to say someone in their household has been unemployed over the past year. In February 2009, African Americans were more likely than whites to say this was the case (47% vs. 32%). The percentage of whites who report experiencing household unemployment has risen by 18 points, while the percentage among blacks has increased only slightly (by five points).

Poor Are Hit Hardest

Across a number of measures of financial hardship, low-income Americans consistently report more problems than those in higher income groups. This is little changed since last year.

The gap is particularly pronounced when it comes to medical costs, as 44% of those with family incomes of $30,000 or less say that they have had trouble getting or paying for health care in the past year, compared with 11% of those with incomes of $75,000 or more. There are also significant gaps in the percentages reporting difficulties paying rent or mortgage (37% vs. 11%), problems with credit or collection agencies (33% vs. 11%), and being laid off (26% vs. 12%).

About a quarter of all Americans (24%) – 39% of those who are currently employed – say that they have gotten a pay raise or or a better job over the past year. That is modestly lower from February 2009, with the decline

coming entirely among employed people with family incomes of less than $75,000 a year.

Slightly more than a third (36%) of those with family incomes between $30,000 and $74,000 say they have gotten a pay raise or a better job in the past year, down from 48% in February 2009. Similarly, there has been a 10-point decline in the percentage of those with incomes of less than $30,000 who have gotten a raise or better job.

By contrast, while those with higher incomes are no better off than in early 2009 – in terms of self-reported raises or better jobs – they are no worse off. Currently, 48% of of employed people with family incomes of $75,000 or more say they have gotten a raise or better job in the past year, which is virtually unchanged from February 2009 (49%).

Concern about Future Job Problems

In the face of current difficulties, many workers continue to anticipate problems with their jobs in the next 12 months. About half of all workers (49%) say it is very or somewhat likely they will face at least one job-related financial stress in the next year, which is largely unchanged from February 2009 (46%).

About a quarter of workers say it is likely that they will be asked to take a cut in pay (25%), be laid off (24%), have their health care benefits reduced or eliminated (23%), or have their retirement benefits reduced or eliminated (22%). Somewhat fewer (13%) say it is likely that their employer may go out of business or relocate.

As with experiences over the past year, workers with lower incomes are more likely to anticipate job-related problems; nearly six-in-ten (59%) say it is very or somewhat likely they will experience one or more of these job-related problems. By comparison, there is little change in the likelihood of these problems among moderate and higher incomes; about half say it is likely they will experience at least one of these problems.

In particular, concern that they may be laid off has risen considerably over the last year among workers with family incomes of $30,000 or less. Among this group, 36% say it is likely they may be laid off, up 17 points from last February and in contrast to just 15% of workers with incomes of $75,000 or more. Similarly, the proportion of those in the lowest income group who say it is very or somewhat likely that their employer may go out of business or relocate has grown to 25% from 14% a year ago; and this group is considerably more likely than those other income groups to say this.

Section 5: Opinions About Afghanistan and Iraq

The public’s views of the U.S. military effort in Afghanistan continue to improve. Currently, 52% say the military effort is going very or fairly well, up from 46% in December 2009 and just 36% a month earlier.

Since early last year, there has been little change in opinions about whether the United States will succeed in achieving its goals in Afghanistan. Currently, 58% say the United States will definitely or probably succeed in achieving its goals there.

Public perceptions of how things are going in Afghanistan have improved, especially among older Americans and college graduates. The proportion of

those 65 and older saying the U.S. military effort is going well has more than doubled since November 2009, from 28% to 59%. Those ages 50 to 64 also are much more positive: 57% now say the military effort is going very or fairly well, up from just 35% four months ago.

Among college graduates, 58% express positive opinions of the U.S. military effort, compared with 30% in November. There have been more modest gains in the percentages of those with some college (11 points) and with a high school education or less (nine points) saying the effort is going well.

More Republicans (61%) than Democrats (52%) and independents (50%) say the U.S. military effort is going well. Positive perceptions among all three groups have increased by about the same amount since November of last year.

There are similar partisan differences in opinions about whether the United States will succeed in achieving its goals in Afghanistan. Nearly seven-in-ten (69%) Republicans say the United States will definitely or probably succeed, compared with 58% of independents and 57% of Democrats.

Young people are more optimistic about the prospects for success in Afghanistan than are older Americans. About seven-in-ten (71%) under age 30 say the United States will definitely or probably succeed; fewer than six-in-ten in older age groups express this view.

Upbeat Views of Iraq

A majority of Americans also have a positive view of how the U.S. military effort in Iraq is going. Currently, 54% say the military effort is going very or fairly well, which is consistent with measures since the fall of 2008. Positive perceptions of the military effort in Iraq hit an all-time low in February 2007 (30%), but increased through 2007 and 2008, following former President Bush’s troop surge in Iraq.

Nearly six-in-ten Americans (59%) say the United States will definitely or probably succeed in achieving its goals in Iraq, which is little changed from December 2009 (63%).

Since early 2007, there has been a turnaround in the public’s perceptions of how things are going in Iraq. More also say the United States will succeed in achieving its goals there. In February 2007, a slim majority of Republicans

(51%), 26% of independents and just 15% of Democrats said the U.S. military effort was going very or fairly well. In the new survey, 70% of Republicans and about half of independents (52%) and Democrats (49%) say things are going well in Iraq.

In February 2007, fewer than half of Americans (47%) said the United States would definitely or probably succeed in achieving its goals in Iraq. Since then, Republicans’ views about the prospects for success have changed very little – 77% said the U.S. would succeed, while 72% say that today.

Over the same period, Democrats and independents have become much more optimistic about whether the U.S. will succeed in Iraq. In February 2007, just 34% of Democrats said the U.S. would definitely or probably succeed in achieving its goals in Iraq. That number rose to 54% in January 2009 and is 56% in the current poll. There has been a comparable shift among independents. Three years ago, just 40% of independents said the U.S. would succeed; that rose to 62% in January 2009 and is 60% today.

About the Survey

Results for this survey are based on telephone interviews conducted under the direction of ABT/SRBI Inc. among a national sample of 1,500 adults living in the continental United States, 18 years of age or older, from March 10-14, 2010 (1,000 respondents were interviewed on a landline telephone, and 500 were interviewed on a cell phone, including 198 who had no landline telephone). Both the landline and cell phone samples were provided by Survey Sampling International. Interviews were conducted in English and Spanish. For detailed information about our survey methodology, see https://alpha.pewresearch.org/pewresearch-org/politics/methodology/.

The combined landline and cell phone sample are weighted using an iterative technique t hat matches gender, age, education, race/ethnicity, region, and population density to parameters from the March 2009 Census Bureau’s Current Population Survey. The sample is also weighted to match current patterns of telephone status and relative usage of landline and cell phones (for those with both), based on extrapolations from the 2009 National Health Interview Survey. The weighting procedure also accounts for the fact that respondents with both landline and cell phones have a greater probability of being included in the combined sample and adjusts for household size within the landline sample. Sampling errors and statistical tests of significance take into account the effect of weighting.

The following table shows the error attributable to sampling that would be expected at the 95% level of confidence for different groups in the survey:

In addition to sampling error, one should bear in mind that question wording and practical difficulties in conducting surveys can introduce error or bias into the findings of opinion polls.