
Pew Research Center

FOR RELEASE FEBRUARY 12, 2010

Midterm Election Challenges for Both Parties

Obama's Ratings Are Flat, Wall Street's Are Abysmal

FOR MEDIA OR OTHER INQUIRIES:

Communications Department
202.419.4372
www.pewresearch.org

RECOMMENDED CITATION

Pew Research Center, February 2010, "Midterm Election Challenges for Both Parties"

About Pew Research Center

Pew Research Center is a nonpartisan, nonadvocacy fact tank that informs the public about the issues, attitudes and trends shaping the world. It does not take policy positions. The Center conducts public opinion polling, demographic research, computational social science research and other data-driven research. It studies politics and policy; news habits and media; the internet and technology; religion; race and ethnicity; international affairs; social, demographic and economic trends; science; research methodology and data science; and immigration and migration. Pew Research Center is a subsidiary of The Pew Charitable Trusts, its primary funder.

© Pew Research Center 2026

Table of contents

  • About Pew Research Center
  • Midterm Election Challenges for Both Parties
  • Section 1: Opinions of Obama
  • Section 2: The Midterm Elections
  • Section 3: Views of the Parties
  • Section 4: Economic Policies and Government’s Role
  • Section 5: Health Care, Gays in the Military, Supreme Court
  • About the Survey

Midterm Election Challenges for Both Parties

Obama's Ratings Are Flat, Wall Street's Are Abysmal

Summary of Findings

Nine months ahead of the midterm elections, voters have conflicted attitudes about both political parties. Opinions of the Republican Party have improved significantly, and for the first time in years the GOP’s favorable ratings nearly equal the Democratic Party’s. Voting intentions for the fall elections also remain closely divided. However, the Democratic Party is still better regarded in many respects than is the GOP and far more people continue to blame the Republicans than the Democrats for the current state of the economy. And despite frustrations with his stewardship of the economy, bottom-line opinions of Barack Obama have not changed in the past few months.

The wild card in voter opinion at this point is the level of anti-incumbent sentiment, which is as extensive as it has been in 16 years of Pew Research Center surveys. About three-in-ten voters (31%) say they do not want to see their own representative reelected, which is well above the average percentage expressing this view in 29 previous surveys (23%). The only recent midterm campaigns when anti-incumbent sentiment equaled its current levels were in 2006 and 1994 – which culminated in elections that changed the balance of power on Capitol Hill.

The climate of opinion today, however, is different than it was prior to those historic campaigns in two important ways. First, through most of the 2006 campaign the opposition party was viewed more favorably than the incumbent party. In 1994, both parties were favorably rated by substantial majorities of the public; currently, neither is.

Second, opinions about Barack Obama are not nearly as negative as were views of George Bush in 2006 and are somewhat better than opinions of Bill Clinton were for much of 1994. Currently, slightly more voters say they think of their vote as a vote for Obama (24%) than as a vote against him (20%). Throughout most of 2006, roughly twice as many said they were voting “against” Bush as “for” him. And in three surveys during the fall of 1994, slightly higher percentages said they thought of their vote as against Clinton rather than for him.

The latest nationwide survey by the Pew Research Center for the People & the Press, conducted Feb. 3-9 among 1,383 adults reached on cell phones and landlines, finds continuing public dissatisfaction with the economy and disapproval of major policies to address it. Yet President Obama’s overall job approval ratings have remained steady in recent months. Currently, 49% approve and 39% disapprove of the way Obama is handling his job as president, which is largely unchanged from surveys since October.

However, there is growing impatience with Obama’s handling of the economy, which most Americans continue to regard as the most important problem facing the nation. Currently, as many say Obama’s economic policies have made economic conditions worse (27%) as say those policies have made things better (24%). In most surveys last year, modestly higher percentages thought Obama’s policies had made conditions better rather than worse. Notably, a substantial proportion of Americans (45%) continue to say Obama’s policies have not had an effect so far or that it is too soon to tell – and that figure has not come down since October.

In the new survey, just 38% of Americans say they approve of Obama’s $800 billion economic stimulus plan that Congress approved a year ago; 49% disapprove of the plan. In October, opinion about the stimulus was evenly divided and last June a clear majority (55%) approved of the plan.

Half of the public (50%) says Obama could be doing more to improve the economy, up from just 30% last March. Yet even more people expressed this view about George W. Bush throughout most of his first term. And in 1992, fully 76% said that Bush’s father, George H.W. Bush, could be doing more to improve economic conditions.

While Americans have grown more critical of Obama with regard to the economy, more still blame the Republican Party (39%) than the Democratic Party (27%) for current economic conditions.

Nonetheless, the Democratic advantage for dealing with the economy has all but disappeared. About four-in-ten (41%) say the Democratic Party could do a better job in dealing with the economy, while about as many (38%) say the GOP could do better. In August, Democrats held a 10-point lead as the party better able to deal with the economy (42% to 32%).

The same pattern is evident on several other issues – the Democrats have lost ground to the Republicans. Nonetheless, Democrats continue to lead by wide margins on education (by 19 points), health care (13 points) and energy problems (12 points). The Republican Party holds a modest advantage on reducing the budget deficit (six points) as well as a substantial – and growing – advantage in dealing with the terrorist threat at home (17 points). Just six months ago, the Republican Party’s lead in dealing with terrorism was six points.

Similarly, the Democrats’ advantage on several specific image traits has narrowed since 2009. But the Democrats continue to get better ratings than the Republicans on a number of key dimensions, including concern for the average person, the ability to bring about change, selecting better candidates for office and being less influenced by lobbyists and special interests. However, the GOP has drawn even with the Democrats as the party seen as better able to manage the federal government.

Over the past year, most of the GOP’s image gains have come from Republicans themselves and independents. Democrats for the most part remain loyal to their party and continue to overwhelmingly approve of Obama’s performance in office. Moreover, a majority of Democrats give their party high marks for standing up for traditional Democratic positions. Fully 63% of Democrats say their party has done an excellent or good job in standing up for the party’s traditional positions, such as protecting the interests of minorities and helping the poor and needy. That represents little change from last April, at about the 100-day point in Obama’s presidency.

Few Want Congress to Give Up on Health Bills

Most Americans (52%) say the Democratic Party has done a poor job in offering solutions to the country’s problems; 40% say the Democrats have done a good job in proposing solutions. But the Republican Party gets even lower marks in this regard: 60% say the GOP has done a poor job offering solutions for national problems while only about half as many (29%) say the GOP has done well.
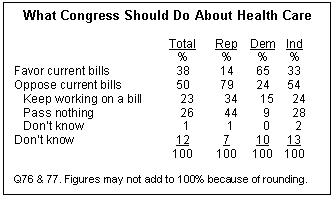
There are signs of public frustration as well with the lack of progress on health care legislation. More Americans continue to generally oppose (50%) than generally favor (38%) the health care bills being discussed in Congress. Yet only about a quarter of the public (26%) prefers that Congress pass nothing and leave the current system as it is. A majority (61%) either favors the current health care bills or would prefer that Congress keep working on a health care bill.

Opposition to increasing the size and influence of government and concern about the federal budget deficit have been key factors in opposition to the health care bills. Those concerns also are evident in other findings in the survey: As has been the case for the past year, more people say they would rather have a smaller government with fewer services (50%) than a bigger government with more services (40%).
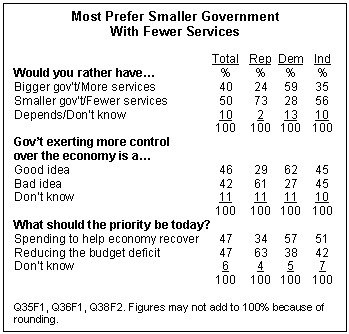
Moreover, the public is now evenly divided over whether it is a good idea for the government to exert more control over the economy than it has in recent years. Fewer than half (46%) say this is a good idea, while 42% say it is not. Last March, by a wider margin (54% to 37%), Americans said it was a good idea for the government to exert more control over the economy. Opinion also is split over whether the higher priority for the government should be more spending to help the economy recover (47%) or reducing the budget deficit (47%).

While the public is wary of too much government, it makes an exception when it comes to stricter regulation of major financial companies. A clear majority (59%) says it is a good idea for the government to more strictly regulate the way major financial companies do business; just 33% say this is a bad idea. Support for tougher regulation of financial firms is as high as it was last April (60% good idea).

There are other indications of a public backlash against large financial institutions. Just 25% say they have a favorable opinion of major U.S. banks and financial institutions while 68% have an unfavorable view. Negative views of large financial institutions are evident across political lines: 72% of Democrats, 68% of independents and 67% of Republicans have an unfavorable impression of such institutions.

Notably, there is considerably more public anger about banks and financial institutions paying large bonuses to their executives than there is over the government bailout of banks, partisan gridlock in Washington, or the growing budget deficit.

Fully 62% say they are angry over the large bonuses, while 48% say they are angry over the government bailing out financial institutions that made poor financial decisions. By comparison, fewer than half say they are angry over gridlock between Republicans and Democrats in Washington (39%) and the growing budget deficit (37%).

Other important findings include:

  • Most Americans (61%) continue to favor allowing gays and lesbians to serve openly in the military. Support for allowing gays to serve in the military has fluctuated very little since 2005.
  • Favorable ratings of the Supreme Court slipped from 64% in April 2009 to 58% currently. The survey also finds broad opposition to the Court’s recent decision allowing corporations to spend on behalf of candidates in elections; 68% disapprove of the decision while just 17% approve.
  • The Tea Party movement gets a mixed review from the general public. A third (33%) say they have a favorable opinion of the Tea Party movement while 25% have an unfavorable opinion; a relatively large minority (42%) have never heard of the group or offer no opinion.
  • The public cites economic problems as the most important ones facing the nation – 31% name unemployment, and 24% the economy generally. Healthcare and the budget deficit are named next most often (13% and 11% respectively)

Section 1: Opinions of Obama

Barack Obama’s job approval rating holds steady at 49% in the latest survey, with 39% saying they disapprove of the way he is handling his job as president. Obama’s approval ratings have been mostly unchanged over the last six months, though there have been some significant shifts in opinion among independents.

Ratings of Obama’s job performance among Democrats and Republicans are on par with his ratings over the last several months. About eight-in-ten Democrats (79%) now approve of the job Obama is doing, while just 17% of Republicans view Obama’s job performance positively. Currently, 46% of independents approve of Obama’s performance, up slightly from 39% last month.

Views of Obama’s Economic Policies

Americans are divided over whether Obama’s economic policies have made economic conditions better (24%) or worse (27%). As has been the case over the past year, a plurality (45%) say his policies have not had an effect so far or that it is too soon to tell. The share saying Obama’s policies have made things worse has grown slowly over the course of his presidency, from 15% in March of last year to 27% today. There has been a small decline in the proportion saying Obama’s policies have made conditions better; today, 24% say this, down from 30% in December.

Views about the effect of Obama’s policies differ considerably by party. Just 8% of Republicans say Barack Obama’s policies have made economic conditions better (53% say they have made conditions worse, while 36% say they have not yet had an effect or that it is too soon to tell). By comparison, 38% of Democrats say Obama’s policies have made economic conditions better (just 9% say they have made conditions worse, while 48% say they have not yet had an effect or that it is too soon to tell). Independents’ views largely mirror those of the overall public.

Is Obama Doing Enough to Improve the Economy?

The public also is divided over whether Obama is doing all he can to improve economic conditions. Half (50%) now say that Barack Obama could be doing more to improve economic conditions, while 43% say he is doing as much as he can.

In March 2009, the public’s views of Obama’s efforts on the economy were more positive; a majority (60%) said Obama was doing as much as he could. Nevertheless, assessments of Obama’s efforts remain relatively positive when compared to those of his predecessors. Although they are slightly less positive than views of George W. Bush’s efforts in January 2002, they are more positive than ratings of George W. Bush throughout the remainder of his first term and of George H.W. Bush in early 1992.

As was the case last year, there is a substantial partisan split on this question. Nearly two-thirds of Democrats (65%) say Obama is doing all he can, compared with 38% of independents and 22% of Republicans.

Obama’s Proposed Spending

There has been little change over the past year in opinions about Obama’s proposed spending to address the economic situation: 35% say Obama has proposed spending too much money, 33% say his spending is about right while 20% say he has proposed spending too little.

Nearly six-in-ten (58%) Republicans say Obama has proposed too much spending, down from the 70% who said this in March of last year. The plurality of Democrats (46%) say Obama has proposed the right amount of spending, which also is little changed from last year. However, the percentage of Democrats saying that Obama has not proposed enough spending has increased since March 2009 (28% today, up from 16%). As with the public overall, independents’ opinions are divided, and have shifted little since last year.

Obama’s Agenda

About half of the public (47%) now says that there are too many issues on Barack Obama’s agenda; 37% say he is focusing on about the right number of issues, while just 8% say he is focusing on too few issues. Over the course of the past year fewer Americans have come to think the number of issues on Obama’s plate is “about right” while there has been an increase in the percentage who say he is now addressing too many issues. Republicans are the most likely to say Obama is addressing too many issues (65%); just 31% of Democrats say the president is addressing too many issues (as do 48% of independents).

More Americans say Obama is listening to liberals i n his party than to moderates (44% vs. 35%). There have been no substantial overall shifts in these views over the last several months. Nearly two-thirds of Republicans (64%) say Obama is primarily listening to liberal Democrats, while just 23% say he is listening to moderates in the party. Conservative Republicans are particularly likely to hold this view; 72% say Obama is listening more to liberal Democrats. By contrast,

moderate and liberal Republicans are somewhat more divided on this question; 47% say Obama listens primarily to liberals, while 34% say he listens more to moderates.

The plurality of Democrats (47%), in comparison, say that Obama is listening to their party’s moderate wing; just a third (33%) say he listens more to liberals. There are no significant differences between liberal Democrats and their conservative and moderate co-partisans in these views. Independents are split on this question; 43% say Obama listens more to liberal Democrats, while 37% say he listens more to moderates.

Section 2: The Midterm Elections

Voting intentions for this fall’s midterm elections continue to be closely divided. Currently, 45% of registered voters say that if the election were held today they would vote for the Democratic candidate in their district, or lean to the Democrat, while 42% say they would for the Republican candidate or lean to the GOP candidate. Opinions about the 2010 election have fluctuated little since the summer.

At this stage in the 2006 midterm campaign, Democrats held a 50% to 41% advantage among registered voters. In Pew Research’s final pre-election survey in November 2006, the Democrats led by eight points (48% to 40%).

Overwhelming majorities of Republican (91%) and Democratic voters (90%) continue to favor their party’s candidate for Congress, while independents remain divided. In the current survey, 40% say they would vote for the Republican candidate, 33% for the Democratic candidate, while a relatively large proportion (27%) offer no opinion.

With nine months to go before the midterm election, a relatively large share of voters (31%) say that national issues will make the biggest difference in how they will vote. Indeed, about as many voters say national issues will be the biggest factor in their vote as cite the candidate’s character and experience (30%) or local and state issues (27%).

National issues also were regarded as important in the 2006 midterm: In the final pre-election survey by Pew Research Center in November, 34% of voters said national issues would make the biggest difference, more than the percentage citing other factors. But national issues were not as significant a factor for voters in earlier elections: In final pre-election surveys from 1994 to 2002, fewer than a quarter of voters said national issues would make the biggest difference in their vote.

In the current survey, there are only slight partisan differences in views about which factors are most important. Comparable percentages of Republicans (33%), Democrats (29%) and independents (27%) cite national issues as most important in their vote.

Party Control Less of a Factor than in ‘06

While national issues are nearly as important a factor for voters now as in the closing days of the 2006 midterm, the question of which party controls Congress is less of a factor than it was two years ago. And substantially fewer voters see this fall’s election as a referendum on the president as did so two years ago.

About half of voters (48%) say that the issue of which party controls Congress will be a factor in their vote while nearly as many (45%) say it will not. Throughout 2006, majorities consistently said party control would be a factor in their vote; in the final pre-election survey, 61% said the question of party control of Congress would be a factor. The current measure is in line with midterm campaigns in 1998 and 2002. In each campaign, the proportion saying the issue of which party controls Congress never surpassed 50%.

Currently, 24% say they think of their vote for Congress this fall as a vote for Barack Obama while 20% say they consider their vote as a vote against Obama; 51% say Obama is not much of a factor in their vote. President Bush was a much bigger factor in 2006: In the final election poll that year, 35% said they viewed their ballot as a vote against the president while 21% said their vote was for the president; just 41% said Bush would not be a factor.

Bush was much more of a positive factor in the 2002 midterm. In November that year, nearly twice as many voters said they considered the vote as one for Bush than against him (by 29% to 16%). In the two midterms during Bill Clinton’s presidency, about as many said they viewed their vote as for the president as against him, with substantial majorities saying Clinton would not be much of a factor.

At this early stage in the 2010 campaign, 60% of Republican voters and 53% of Democratic voters say the issue of which party controls Congress will be factor in their vote. As is typically the case, far fewer independents (35%) see the question of which party controls Congress as a factor in their vote.

Notably, fewer Democrats say partisan control of Congress is a factor in their voting decision than did so at the end of the 2006 campaign (53% today vs. 73% in November 2006). But in many ways, that election was unusual, for the high proportions of voters saying that party control of Congress and the president were factors in their votes.

In the closing days of the 2006 campaign, fully 65% of Democrats said they thought of their vote as a vote against Bush; in February 2006, 55% of Democrats expressed this view. Today, just 42% of Republicans see their congressional vote as a vote against Obama. Indeed, about as many Republicans say Obama will not be much of a factor in their vote (46%) as see their vote as against Obama (42%).

Bush also was a negative factor for independent voters in 2006: 35% said they thought of their vote as being against Bush while just 11% said their vote was for Bush. Today, 19% of independents say their vote would be a vote against Obama, while 14% say it would be a vote for him.

In November 2002, by comparison, relatively small percentages of Democrats (32%) and independents (14%) said they considered their vote as a vote against Bush. And nearly six-in-ten Republicans (59%) thought of their vote as being for Bush; today, 49% of Democrats say their vote would be a vote for Obama.

Broad Anti-Incumbent Sentiment

Just 49% of voters say they would like to see their own congressional reelected this fall, while only about a third (32%) would like to see most members of Congress reelected. While these measures are largely unchanged from November, they are among the most negative attitudes toward congressional incumbents in two decades of Pew Research Center polling.

Anti-incumbent sentiment is currently at least as extensive today it was during 2006 and 1994 campaigns, when partisan control of Congress changed hands. At the end of the 2006 campaign, most voters (55%) wanted their own representative reelected while 37% wanted to see most members returned to Congress. Even late in the 1994 campaign, more voters wanted their own representative reelected than do so today (58% then, 49% today) and about the same percentage wanted most representatives reelected as do so currently (31% then, 32% today).

As expected, anti-incumbent sentiment remains particularly intense among Republicans and independents. Fewer than half of Republican voters (45%) and independent voters (43%) say they want to see their own representative reelected, compared with 60% of Democrats. These numbers are largely unchanged from November 2009.

Section 3: Views of the Parties

Democrats Lose Favorability Edge

The favorability advantage the Democratic Party has held over the Republican Party has disappeared over the past year. Currently, 48% of Americans offer a favorable assessment of the Democratic Party, while 46% view the GOP favorably. This reflects a combination of a steep decline in the Democratic Party’s image over the first half of 2009, and a more modest uptick in the GOP’s image more recently.

For the first time since a brief spike in positive opinion in the week following the Republican Convention in 2008, as many Americans view the GOP favorably as unfavorably (46% each). For the better part of four years, GOP favorability has held steady at around 40%, with half or more expressing an unfavorable view of the party. The last time the Republican Party’s ratings were substantially higher than they are today was in 2004.

Republicans are happier with their party than they were in early 2009. A year ago, just 74% of Republicans gave their own party a favorable rating; 82% do so today. But the GOP also looks somewhat better to Democrats than was the case in August (23% favorable today, 16% in August). There has been little change in the assessments of independents; 42% of independents now view the GOP favorably, compared with 49% who view it unfavorably.

There has been little change in the Democratic Party’s overall image over the past six months; today 48% view the party favorably and 44% unfavorably, little changed from a 49% to 40% division in August 2009. But favorability ratings of the Democratic Party had dropped steeply in the early part of 2009 – from 62% to 49% between January and August of last year.

The downturn in ratings of the Democratic Party over the course of the year is driven by increasingly negative reactions from both Republicans and independents. In particular, the share of independents who rate the Democratic Party favorably fell from 58% last January to 40% both last August and today. As a result, independents’ ratings of the GOP (42% favorable, 49% unfavorable) and the Democratic Party (40% favorable, 50% unfavorable) are virtually identical today.

The Democratic Party had consistently enjoyed a favorability advantage over the past four years. In fact, in January of last year, the 22-point difference between ratings of the Democratic Party (62% favorable) and the Republican Party (40% favorable) was the largest gap in Pew Research Center polling since 1992. The combination of Democratic declines and Republican gains over the past year has resulted in the smallest gap in party ratings since July 2005.

Party Images

Americans offer a wide range of responses when asked to describe in their own words what the political parties stand for these days. Some of the most common descriptions of the Republican Party are negative – that it is for the rich, corporate interests and greed, or that it is only looking out for its own political interests. By contrast, the most common descriptions of the Democratic Party are that it stands for the average person, the middle class or working class Americans. Critics, though, say the party stands for bigger government and more spending, and socialism or communism.

Neither Party Seen as Offering Solutions

While favorability ratings of the Republican Party now rival the Democrats, the party gets poor ratings for its political performance. Just 29% of Americans say the Republican Party has done a good job of offering solutions to the country’s problems over the past year – twice that number (60%) say they have done a poor job. The Democratic Party does only somewhat better – 40% good job, 52% poor job.

The Republican Party lags in this measure because Republicans themselves are far from enthusiastic about how their leaders have performed. Just 54% of Republicans say that their party has done a good job of offering solutions to the country’s problems over the past year. This compares with 70% of Democrats who say their party has done a good job in this regard.

As with overall favorability, independents are equally sour toward both parties; just three-in-ten (30%) say the GOP has done a good job of offering solutions to the country’s problems over the past year, and 36% say the same about the Democrats.

In terms of both favorability and performance, the Republican Party in 2010 lags far behind where the party stood in early 1994, when it went on to win majorities in both the House and Senate later in the year. Fully 63% of Americans had a favorable impression of the GOP in July 1994 – on par with the Democrats’ positive image (62% favorable) at the time. And in March 1994, 41% felt the GOP had done a good job of offering solutions to the country’s problems, compared with 29% who say this about the Republican Party today.

Democrats Satisfied With Party’s Performance

While the Democratic Party has lost some of its advantages over the GOP over the past year, there is little evidence that Democrats themselves are becoming dissatisfied with their party’s performance. Fully 84% of Democrats continue to offer a favorable assessment of the party, down only slightly from a year ago (90% in January 2009). There is, however, a more substantial drop in the number rating the party very favorably: from 35% a year ago to 20% today.

At the same time, 63% of Democrats continue to say that the party is doing an excellent or a good job of standing up for its traditional positions on such things as protecting the interests of minorities, helping the poor and needy, and representing working people. This is virtually unchanged from last April (61%) and represents a continuing upward trend in Democratic ratings from 54% in September 2008 and 43% in October 2007.

While Republicans are substantially happier with their party now than they were last April, most Republicans still offer a negative assessment of party leaders when it comes to traditional party issues. The number of Republicans who believe the party is doing an excellent or good job standing up for its traditional positions on such things as reducing the size of government, cutting taxes and promoting conservative social values rose from 24% last April to 37% today. But 61% say that the party’s leaders are doing only a fair or a poor job in this regard.

There are no substantial ideological divides within either party in rating their party’s performance on traditional issues. Comparable percentages of conservative Republicans (63%) and moderate and liberal Republicans (57%) offer critical assessments of the GOP’s performance on traditional party positions. Among Democrats, wide majorities of both liberal (61%) and moderate and conservative (64%) Democrats offer positive ratings for the party.

Who Wants Compromise?

There is far more of a partisan gap in willingness to compromise today than was the case a few years ago. Just 52% of Americans who believe the GOP can do the best job of handling the nation’s most important issue say they think Republican leaders should be willing to compromise on that issue with Democrats. This is down from 63% in January of 2007, after the Democrats regained control of the House and Senate.

By contrast, Democratic supporters are overwhelmingly supportive of compromise. Roughly seven-in-ten (71%) Americans who believe the Democrats can do a better job on the nation’s most important issue say that party leaders should be willing to compromise on that issue, up from 60% three years ago.

Party Strengths

While the Democratic Party continues to maintain an edge on most issues, the GOP has narrowed many of the gaps in public assessments of the parties’ relative capabilities over the past six months. The proportion saying the GOP is better able to handle the economy has risen six points (from 32% to 38%), and there have been similar increases in the share preferring the Republican Party on the issues of deficit reduction (from 35% to 42%), education (22% to 29%), energy (25% to 32%) and dealing with terrorist threat at home (38% to 46%). On all of these issues, there has been no significant change in the number saying the Democrats can do the better job.

As a result of these GOP gains, Republicans now lead (42% vs. 36%) as the party viewed as better able to reduce the budget deficit; six months ago the parties were virtually tied (36% Democrats, 35% Republicans). In addition, the GOP has widened its lead as the party seen as better able to deal with terrorist threats, from six points last August to 17 points (46% vs. 29%) today.

On most other issues, Democrats hold substantially narrower leads today than they did last August. Roughly as many now choose the Republican Party (38%) as the Democratic Party (41%) to better handle the economy, and Republicans have gained ground on health care and energy.

The same pattern is evident when it comes to many public assessments of the parties’ relative strengths. For example, in August just 25% said the Republican Party could bring about needed change, while 47% said the Democratic Party. Today, 34% select the GOP

as the party of change, while the proportion choosing the Democrats has not changed (46%).

The Republican Party has pulled even with the Democratic Party in terms of who can better manage the government (40% Democrats, 40% Republicans). The GOP still trails the Democratic Party in assessments of which selects better candidates for office (35% Republican Party, 42% Democratic Party), but the Democratic Party’s lead on this trait is considerably narrower than it was six months ago. The GOP continues to be viewed as the party more often influenced by lobbyists and special interests; 40% say this better describes the Republican Party compared with 32% for the Democratic Party.

Independents’ evaluations of the political parties have shifted substantially on many issues since last year. The proportion of independents who think the Republican Party can better handle the economy has increased from 27% to 37% since August. Currently, independents rate the two parties about evenly on the economy; last August, the Democrats were favored by 11 points on this issue. Similarly, wide Democratic leads among independents on the issues of education and energy have been reduced, as confidence in the GOP among independents has risen.

And on two key issues, the deficit and terrorism – the GOP has opened large leads among independents. In August, roughly as many independents favored the Democratic Party (30%) as the Republican Party (33%) to better reduce the budget deficit. Today, the GOP holds a 42% to 28% lead on this issue among independents. And while the GOP held a slim edge (33% to 27%) among independents as the party better able to deal with the terroorist threat at home, its advantage has grown to a 48% to 19% lead in the latest poll.

A similar pattern is seen in evaluations of leadership traits. For example, the proportion of independents saying the GOP can better manage the federal government rose from 29% to 43% since August, opening up a 12-point Republican advantage on this trait.

Views of the Tea Party Movement

More Americans express a favorable (33%) than unfavorable (25%) view of the Tea Party movement, but a large plurality of Americans (42%) either have never heard of the movement or if they have heard of it do not have an opinion.

Republicans are somewhat more likely to offer an opinion of the Tea Party movement, and their opinion is overwhelmingly favorable (51% vs. 10% unfavorable). This is driven by particularly favorable opinions (59%) among conservative Republicans. Among Democrats, just 21% offer a favorable assessment of the Tea Party movement, while 37% see it unfavorably. The balance of opinion is most negative among liberal Democrats, 46% of whom offer an unfavorable assessment. More independents see the Tea Party movement favorably (34%) than unfavorably (24%).

Men are slightly more likely than women to view the Tea Party movement favorably (37% vs. 30%). There is little difference in the balance of opinion across age groups. The movement’s negatives are higher among more educated Americans: 32% of college graduates view the Tea Party movement unfavorably, compared with just 19% of people who did not attend college

Section 4: Economic Policies and Government’s Role

In the year since Congress passed Barack Obama’s economic stimulus bill, the public has steadily grown less supportive of the plan. Nearly half of Americans (49%) now disapprove of the $800 billion package, while just 38% approve of the measure. In October, opinion was evenly divided (44% approved, 44% disapproved). Last June, a 55% majority approved and 39% disapproved.

While opinions remain divided along partisan lines, support

for the stimulus plan has dropped among Republicans, independents and Democrats alike. The share of Democrats who approve of the stimulus has fallen from 78% to 60% since June of last year. The already low 27% approval among Republicans has slipped to just 13% over the same time period. A slim majority of independents (52%) supported the stimulus in June, but the balance of opinion is negative today (48% disapprove and 39% approve).

Bank Bailout Now Seen as Wrong Decision

Much like the stimulus plan, the government’s decision in 2008 to make loans to secure financial institutions also faces greater public opposition today than it did nearly a year ago. About half (51%) now say it was the wrong thing for the government to make loans of roughly $700 billion to keep financial institutions and markets secure, while 40% say it was the right thing to do. Last March, nearly half (48%) said it was the right thing for the government to do, while 40% said it was the wrong thing.

Opposition to the bailout has increased mostly among Democrats and independents. Independents were divided over the bailout in March 2009 (46% right thing, 42% wrong thing); today independents oppose the plan by a 56% to 36% margin. Over the same time period, opposition to the loans among Democrats has increased from 23% to 36%. Among Republicans, 62% opposed the bailout last March, as do 67% today.

Views of Government’s Role

As has been the case since last March, more Americans say they prefer a smaller government providing fewer services (50%) rather than a bigger government providing more services (40%). At the same time, support for government to exert more control over the economy than it has in recent years is down somewhat from roughly a year ago. Americans are now evenly divided on whether it is a good idea (46%) or a bad idea (42%) for greater government involvement in the economy.

As expected, most Republicans (73%) say they would rather have a smaller government with fewer services; a majority of independents (56%) agree. Most Democrats (59%) favor a bigger government providing more services.

Republicans and Democrats also hold opposing views on whether the government should exert more control over the economy than it has in recent years. About six-in-ten Republicans (61%) say this is a bad idea, while roughly the same percentage of Democrats (62%) think it is a good idea. Independents are divided: 45% take a negative view of greater government control over the economy, while the same percentage sees this as a good idea.

Despite the public’s reservations over more government control over the economy, there is substantial support for the government to more strictly regulate the way financial companies do business. Nearly six-in-ten (59%) say this is a good idea, compared with 33% who see stricter financial regulations as a bad idea.

Nearly eight-in-ten Democrats (79%) say that stricter government regulations of financial firms are a good idea. But there is much less support for this idea among independents (52% good idea). As many Republicans see tougher regulations on financial firms as a bad idea (48%) as a good idea (45%).

Most Angry About Executive Bonuses

More than six-in-ten Americans (62%) say the large bonuses paid to executives of some banks and financial institutions makes them angry. This is substantially more than say they are angry about bailing out banks and financial institutions that made poor decisions (48% angry). Comparatively, anger about the gridlock between Republicans and Democrats in Congress (39%) and the growing federal budget deficit (37%) is less widespread.

Anger over the bank bonuses crosses party lines. Still, somewhat more Democrats (72%) than independents (61%) or Republicans (57%) say the bonuses for financial executives make them angry.

Close to half (48%) of the public says the federal bailout of major banks and financial institutions makes them angry. This is the same as the percentage that expressed anger over the bailout in March 2009. A much higher share of Republicans (60%) than Democrats (41%) or independents (49%) say the government bailouts of banks and financial institutions makes them angry.

About four-in-ten Americans (39%) say the gridlock in Washington between Democrats and Republicans makes them angry. Independents (44%) are somewhat more likely than Republicans (33%) to express anger over partisan gridlock; 40% of Democrats say they are angry over gridlock in Washington.

Roughly the same percentage (37%) says that growing federal deficits make them feel angry, which is unchanged from March 2009. Far more Republicans (49%) and independents (41%) than Democrats (25%) express anger over growing deficits.

Banks Viewed Unfavorably

Most Americans (68%) say they have an unfavorable opinion of major U.S. banks and financial institutions. Within that group, 29% say they have a very unfavorable opinion of these businesses and 39% say they have a mostly unfavorable opinion.

None of the other business sectors tested elicits such negative opinions. Public opinion toward U.S. automakers is divided (43% favorable, 45% unfavorable). Technology companies, by contrast, are viewed favorably by 71% of Americans with just 13% expressing an unfavorable opinion.

The negative opinions of major U.S. banks and financial institutions are shared across the partisan spectrum. About seven-in-ten Democrats (72%) say they have an unfavorable opinion of these businesses, as do 68% of independents and 67% of Republicans.

There also are no significant partisan differences in views of U.S. automakers; 47% of independents have a favorable opinion of U.S. automakers as do 42% of Republicans and 41% of Democrats. And solid majorities across party lines hold a favorable impression of technology companies.

Section 5: Health Care, Gays in the Military, Supreme Court

Opposition to Current Health Bills; But Desire for Legislation

More Americans continue to oppose (50%) than favor (38%) the health care bills currently being discussed in Congress. Opposition to health care legislation has been relatively stable in recent months, with opponents outnumbering supporters by similar margins in five of the last six Pew Research surveys since October. However, the current polls finds that almost half of the people who oppose the health care bills being discussed in Congress – 23% of Americans overall – say they would like to see Congress keep working on a health care bill. About a quarter of Americans (26%) oppose the current bills and want Congress to pass nothing, leaving the current system as it is.

As has consistently been the case, there are stark divisions between Republicans and Democrats when it comes to health care legislation. By a 79%-14% margin Republicans overwhelmingly oppose the current legislation in Congress, while Democrats favor it by a 65% to 24% margin. Among independents, more oppose (54%) than favor (33%) the bills being discussed in Congress. The balance of opinion within all three partisan groups is virtually unchanged in recent months.

Nonetheless, significant percentages of Republicans (34%) and independents (24%) say that while they oppose the current legislation, they would prefer to see Congress keep working on a health care bill than do nothing. A 44% plurality of Republicans say they would prefer to see Congress pass nothing and leave the current system as it is. Far fewer independents (28%) take this view, as do just 8% of Democrats.

Most Favor Gays Serving Openly

By a two-to-one margin, more Americans favor than oppose allowing gays and lesbians to serve openly in the U.S. military. Currently, 61% favor allowing gays and lesbians to serve openly, while 27% are opposed. There has been a modest drop in opposition over the past year. In March 2009 and two earlier polls, 32% of Americans opposed allowing gays and lesbians to serve openly. The current survey was conducted in the week following a congressional hearing in which Defense Secretary Robert Gates and Admiral Mike Mullen, chairman of the Joint Chiefs of Staff, voiced support for Obama’s call to end the “don’t ask, don’t tell” policy.

Older Americans continue to express less support for gays serving openly than do younger age groups. Nonetheless, a plurality (46%) of those 65 and older favor the change in policy, while 34% are opposed. Younger Americans remain strongly in favor, with 71% of 18-29-year-olds in support of gays serving openly and just 21% opposed.

Roughly two-thirds of both Democrat s (67%) and independents (65%) support allowing gays to serve openly in the military, with just under a quarter in both groups opposed. Nearly half (47%) of Republicans also say they are in favor of allowing gays and lesbians to serve openly in the military, while 41% are opposed. These figures are largely unchanged from previous polls in 2009 and 2006. In March of last year, Republicans were also split evenly on this issue (45% favor, 48% oppose) and this was the case in March of 2006 as well (46% favor, 46% oppose).

Ideology is a substantial factor within the Republican Party. Moderate and liberal Republicans support this policy by a 63% to 23% margin, while conservative Republicans are more opposed (40% favor, 49% oppose). Three quarters of liberal Democrats (75%) support allowing gays to serve in the military while just 13% oppose the proposal. An only slightly smaller majority of conservative and moderate Democrats (65%) favors permitting gays to serve openly while 27% are opposed.

More women (66%) than men (55%) favor letting gays and lesbians serve openly in the military, but the gender gap is mostly among younger Americans. Fully 73% of women under age 50 back gays serving openly in the military, compared with 57% men under 50. Among people age 50 and older, there is little gender gap (58% of women, 52% of men).

There also are differences among religious groups in views on this issue. Nearly three quarters (73%) of religiously unaffiliated Americans favor allowing gays to serve; smaller majorities of white mainline Protestants (67%) and white Catholics (65%) express this view. By comparison, 41% of white evangelical Protestants support allowing gays to serve openly in the armed forces while 45% are opposed, though this is a slight decrease in opposition from March 2009 (when 55% were opposed).

Supreme Court Favorability Down Slightly

In the wake of the Supreme Court’s decision in Citizens United vs. FEC, which struck down major restrictions on corporate contributions to political campaigns, the court has a favorability rating of 58%. This is a slight decrease from the 64% of Americans who had a favorable view of the high court in April 2009. About a quarter (27%) of Americans hold an unfavorable view of the court.

These are the lowest ratings of the court since July 2007, when 57% held a favorable view and 29% held an unfavorable view of the institution. At that time – the conclusion of the first full year with two Bush appointments on the court and some controversial decisions on topics including abortion and school desegregation – partisanship was a substantial factor. Just 49% of Democrats viewed the court favorably compared with 73% of Republicans. The partisan gap is much smaller today, though Republicans continue to be slightly more favorable toward the Court than Democrats (64% vs. 57%).

A large majority of Americans disapprove of the recent Supreme Court decision that allows corporations to spend on behalf of candidates in elections. Almost seven-in-ten (68%) disapprove of that decision, with only 17% approving. Republicans are slightly more likely to approve of the ruling, though only 22% saying they approve while 65% disapprove. Among Democrats, only 13% approve of the ruling while 76% disapprove.

When asked how much, if anything, they had heard of the Supreme Court’s decision on campaign finance rules, 19% had heard a lot, 46% a little, and 35% had heard nothing at all. Regardless of how much people have heard, the vast majority express disapproval of the decision, though people who heard a lot about the case are somewhat more likely to approve (29%) than people who heard only a little (17%) or nothing (11%) about it.

The minority of Americans who approve of the Supreme Court’s decision in Citizens United vs. FEC have a more favorable opinion of the court overall. Roughly three-quarters (74%) of those who approve of the recent decision have a favorable view of the court, compared with 55% of those who disapprove of the ruling.

About the Survey

Results for this survey are based on telephone interviews conducted under the direction of Princeton Survey Research Associates International among a national sample of 1,383 adults living in the continental United States, 18 years of age or older, from February 3-9, 2010 (1,024 respondents were interviewed on a landline telephone, and 359 were interviewed on a cell phone, including 132 who had no landline telephone). Both the landline and cell phone samples were provided by Survey Sampling International. Interviews were conducted in English. For detailed information about our survey methodology, see https://alpha.pewresearch.org/pewresearch-org/politics/methodology/.

The combined landline and cell phone sample are weighted using an iterative technique that matches gender, age, education, race/ethnicity, region, and population density to parameters from the March 2009 Census Bureau’s Current Population Survey. The sample is also weighted to match current patterns of telephone status and relative usage of landline and cell phones (for those with both), based on extrapolations from the 2009 National Health Interview Survey. The weighting procedure also accounts for the fact that respondents with both landline and cell phones have a greater probability of being included in the combined sample and adjusts for household size within the landline sample. Sampling errors and statistical tests of significance take into account the effect of weighting.

The following table shows the error attributable to sampling that would be expected at the 95% level of confidence for different groups in the survey:

In addition to sampling error, one should bear in mind that question wording and practical difficulties in conducting surveys can introduce error or bias into the findings of opinion polls.