Pew Research Center

FOR RELEASE NOVEMBER 13, 2008

High Marks for the Campaign, a High Bar for Obama

Republicans Want More Conservative Direction for GOP

FOR MEDIA OR OTHER INQUIRIES:

Communications Department
202.419.4372
www.pewresearch.org

RECOMMENDED CITATION

Pew Research Center, November 2008, "High Marks for the Campaign, a High Bar for Obama"

About Pew Research Center

Pew Research Center is a nonpartisan, nonadvocacy fact tank that informs the public about the issues, attitudes and trends shaping the world. It does not take policy positions. The Center conducts public opinion polling, demographic research, computational social science research and other data-driven research. It studies politics and policy; news habits and media; the internet and technology; religion; race and ethnicity; international affairs; social, demographic and economic trends; science; research methodology and data science; and immigration and migration. Pew Research Center is a subsidiary of The Pew Charitable Trusts, its primary funder.

© Pew Research Center 2026

Table of contents

  • About Pew Research Center
  • High Marks for the Campaign, a High Bar for Obama
  • Section 1: Report Card on the Campaign
  • Section 2: The President-Elect’s Image and Expectations
  • Section 3: A New Political Landscape
  • Section 4: Early Voting, Campaign Outreach and the Issues
  • Section 5: The Press and Campaign 2008
  • About the Survey

High Marks for the Campaign, a High Bar for Obama

Republicans Want More Conservative Direction for GOP

Overview

A week after the election, voters are feeling good about themselves, the presidential campaign and Barack Obama. Looking ahead, they have high expectations for the Obama administration, with two-thirds predicting that he will have a successful first term.
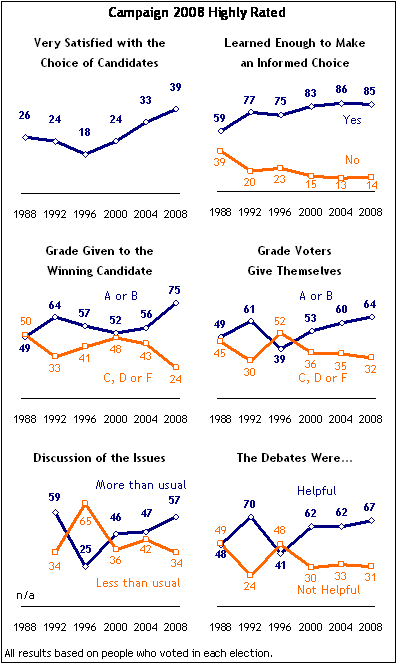
The quadrennial post-election survey by the Pew Research Center for the People & the Press finds greater satisfaction with the choice of presidential candidates than after any election in the past 20 years. In addition, Obama gets by far the highest grades for any winning candidate in that period. The survey was conducted Nov. 6-9 among 1,500 voters reached by both landline and cell phone who were originally interviewed in mid-October.

Fully 75% of voters in the re-contact survey give Obama a letter grade of A or B for the way he conducted himself during the campaign, with 45% awarding Obama an A. Voters also gave Bill Clinton high grades following his 1992 victory (64% A or B; 26% A). But Obama’s grades far surpass Clinton’s.

Voters applaud their own work on Nov. 4: 64% give themselves grades of A or B. Four years ago, 60% of voters gave themselves grades of A or B. The campaign itself also is highly rated: fully 85% say they learned enough about the candidates and the issues to make an informed choice. And nearly six-in-ten (57%) say there was more discussion of the issues compared with past elections; that is the highest percentage expressing this view since 1992 (59%).

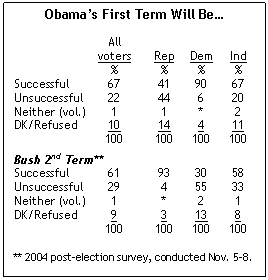
The belief that Obama will have a successful first term is nearly universal among his own supporters (92%). Nearly four-in-ten of those who voted for McCain (39%) also believe that Obama will have a successful first term, while slightly more (45%) say he will be unsuccessful. After the 2004 election, far fewer supporters of John Kerry (26%) said they anticipated that Bush would have a successful second term.
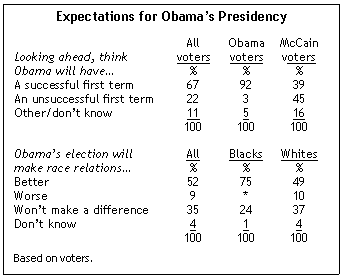
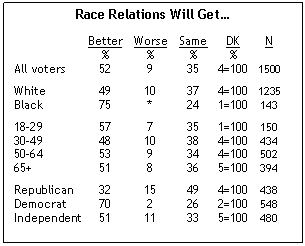
A majority of all voters (52%) say that Obama’s election will lead to better race relations in the United States; 35% say the election will not affect race relations, while 9% say Obama’s election will make race relations worse. Fully three-quarters of African Americans expect race relations to improve as a result of Obama’s election. White voters, however, are evenly divided with about as many saying they expect race relations either to stay the same or get worse (47%) as say they will get better (49%).

Roughly three-quarters (74%) of all voters – including a solid majority of Republicans (56%) – say that GOP leaders should work with Obama to accomplish things, even it means disappointing some supporters; a comparable percentage (77%) says that Democratic leaders should work cooperatively with their Republican counterparts, even if it means disappointing their party’s supporters.

Notably, most voters (60%) say that Obama should appoint Republicans to serve in important positions in his administration; very few (4%) oppose an appointment from the opposing party, while 35% say it does not matter. As expected, support for an appointment of a member of the opposing party is widespread among Republicans (71%), but a narrow majority of Democrats (51%) also favor Obama choosing a Republican for a key administration post.

Despite the support for bipartisanship among members of both parties, the proportion of voters who say they expect relations between Republicans and Democrats to improve has increased only modestly. Fewer than four-in-ten (37%) say they expect relations between Republicans and Democrats to get better in the coming year, up from 29% following the 2006 midterm elections which resulted in divided government. Nearly all of the increased belief in improved relations has come among Democrats; slightly fewer Republicans believe that relations between the parties will get better than did so two years ago.

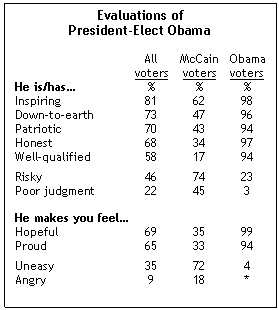
After a hard-fought election campaign, most Republican and Republican-leaning voters (63%) describe Obama as “inspiring.” Almost four-in-ten GOP voters (38%) say Obama makes them feel “hopeful,” and 36% say he makes them feel “proud.” In March, just 22% of registered voters who were Republicans or leaned toward the GOP said Obama made them feel proud. However, a large majority of Republican voters (72%) say the term “risky” describes the president elect.

As Republicans contemplate the party’s future, they are expressing support for a more conservative approach from GOP leaders. Six-in-ten Republican and Republican-leaning voters say they would like to see Republican leaders in Washington move in a more conservative direction; just 35% say they favor the party’s leaders pursuing a more moderate approach.
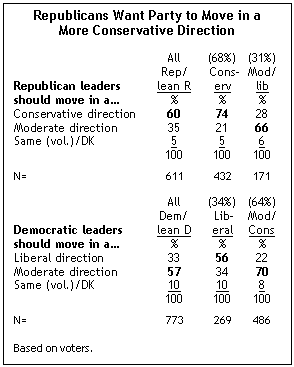
In part, this reflects the fundamentally conservative balance within the GOP electorate. Roughly two-thirds (68%) of Republican and Republican-leaning voters identify themselves as conservative, and three-quarters of these voters think the party should turn further to the right. While a majority of the moderates and liberals within the party advocate a centrist approach, they make up fewer than a third (31%) of Republican voters overall.

Democrats, by contrast, favor their leaders moving in a more moderate, rather than a more liberal, direction in the coming years. A 57% majority of Democrats and Democratic-leaning voters say the party’s leaders should move in a more moderate direction; just 33% say the party should pursue a more liberal course. A majority of Democrats and Democratic-leaners describe themselves as moderate or conservative ideologically, and 70% of these voters favor the party pursuing a more moderate agenda.

About a third of Democratic voters overall describe themselves as liberal, and most want the party to move further to the left. Nonetheless, while 56% of liberal Democrats favor the party moving in a more liberal direction, 34% say the party should move to the center. By contrast, conservative Republicans are far more unified in saying that their party’s leaders should turn to the right (74%), rather than the center (21%).

Election Reactions
Nearly six-in-ten voters (58%) say they are happy that Barack Obama was elected president. These opinions – as well as overall reactions to the election – are divided along partisan lines. Nearly all Democratic voters are happy that their party’s candidate won, while 75% of Republicans express unhappiness. Among independent voters, a majority says they are happy about Obama’s win (57%) and about a third (32%) says they are unhappy.

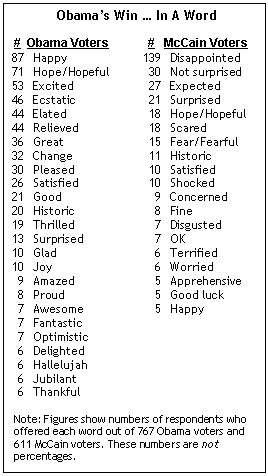
When voters are asked for a single word that describes their reaction to Obama’s victory, Obama supporters mentioned their joy over his triumph, with words like “happy,” “excited,” and “ecstatic” frequently used. A substantial number of Obama voters also mentioned the words “hope” or “hopeful” to characterize their reaction to the election.

McCain’s supporters generally expressed disappointment over the election outcome, although many said that they had anticipated his defeat. Indeed, more McCain voters said they were “not surprised” or used the word “expected,” than said they were surprised or shocked by the election result. Some McCain supporters also used the words “hope” and “hopeful” to describe their reaction to the election, while others expressed fear or apprehension.

Section 1: Report Card on the Campaign

Voters award very high marks to Barack Obama’s campaign and th e Democratic Party this year – the highest for a candidate and party since the Center first asked voters to grade the candidates, parties and other campaign actors in 1988. Roughly three-quarters (76%) of voters who gave a grade to Barack Obama said he earned an A or B for the way he conducted himself in the campaign. Prior to now, the highest marks received by a candidate and party were in 1992 when 66% gave Clinton an A or B. George W. Bush earned an A or B from 56% of voters four years ago.

As is generally the case for the unsuccessful candidate, John McCain receives substantially poorer marks; only 40% of voters gave McCain an A or B for his campaign. This is lower than the 47% for Kerry in 2004 and 54% for Gore in 2000 (though the 2000 race was not yet decided at the time of the survey). But McCain’s grades are substantially higher than either Bob Dole’s in 1996 (34%) or George H.W. Bush’s in 1992 (31%) and on par with the grades given to Michael Dukakis (39%) in 1988.

The Democratic Party’s grades are also at a 20-year high. Fully 70% of voters give positive scores to the winning party, surpassing the previous highs of 60% for the Democrats in 1992 and 51% for the Republicans in 2004. While this reflects the overwhelmingly positive marks from Democratic voters themselves, the grades conferred by independents – and even Republicans – are notably high. Nearly seven-in-ten independents (68%) and fully half of Republicans give favorable grades to the Democratic Party.

In contrast, grades for the GOP are at their lowest level in over a decade – only 28% of voters now give the Republican Party a grade of A or B for the campaign, and a third give the party a D or F. And the criticism of the GOP is not all from outside the party. For the first time, more Republicans give the Democratic Party a grade of A or B (50%) than their own party (44%). The gap in ratings among independents is stark – just 22% give the GOP good grades compared with 68% for the Democratic Party. This is the lowest grade for the Republican Party among independents since 1996 (20% A or B).

Of the other players in the campaign, voters and pollsters, in particular, earned high grades. Two-thirds of voters say the electorate deserves an A or B for how it conducted itself this year, the highest grades given since 1992. Fully 58% of voters also give pollsters good scores, their highest marks since the question was first asked in 1988. Compared with 2004, Democrats and independents give pollsters higher grades, while Republican grades for pollsters are largely unchanged.

Ratings of the press overall are similar to those seen in 2004, though these have become increasingly partisan. Today, fully 62% of Democratic voters give the press positive grades, up from 46% in 2004. By contrast, just 13% of Republicans now give the press an A or B, and more than four-in-ten Republicans (44%) give the press an F grade (up from 28% in 2004). Independents also give the press lower grades than in 2004.

Satisfaction with the Candidates

Overall, two-thirds of voters say they were very or fairly satisfied with the choice of candidates this year. Nearly all Obama voters (95%) say they were satisfied with the choices, and 69% report being very satisfied. Just 37% of McCain voters say they were satisfied with the choice of candidates, with only 9% very satisfied.

Voters who supported the winning candidate are typically happier with the quality of the candidates in Pew’s post election surveys, but the level of satisfaction among Obama voters this year is remarkably high. Four years ago a record number of Bush voters (58%) said they were very satisfied with the choice of candidates; but that record was easily broken this year with 69% of Obama voters expressing strong satisfaction.

While McCain’s supporters were less satisfied, no records were broken. In 1996, only 31% of Bob Dole’s supporters said they were satisfied with the choice of candidates, compared with 37% of McCain voters today. Satisfaction on the losing side today is comparable to what George H.W. Bush voters in 1992 and Michael Dukakis voters in 1988 expressed. Notably, McCain voters were considerably less satisfied with their choices than supporters of John Kerry in 2004.

Debates and Commercials

Two-thirds of voters said the debates were very or somewhat helpful in deciding which candidate to vote for, the highest number since the 1992 debates between Bill Clinton, George H.W. Bush, and Ross Perot. At the same time, despite the unprecedented spending on campaign commercials in this race, voters were only slightly more likely than in 2004 to say that campaign commercials were helpful in making their decision, and less likely than voters in 1992 to say this.

Most Issue-Focused Campaign since 1992

Increased public satisfaction with Campaign 2008 reflects the fact that most voters (57%) say that

there was more discussion of issues in this campaign compared with previous elections. Four years ago, fewer than half (47%) described the campaign this way, as did 46% in 2000 and just 25% in 1996. The last time voters saw the campaign as particularly focused on the issues was in 1992; following that campaign, 59% said that issues were discussed more than usual.

Independents, who historically have tended to be critical of the lack of issue discussion of campaigns, largely share the view that the 2008 campaign was different. A 52% majority today say issues were discussed more than usual this year, the first time a majority has said this since 1992.

However, this view is not held across the board. Almost three-quarters (76%) of Democrats say the election was more focused on issues than in the past, up from just 45% in 2004 and the greatest percentage of Democrats saying this in 16 years. This view is even more widely shared by liberal Democrats, 81% of whom say the campaign discussion was more issue-driven this year than it has been in the past. But Republicans are much less likely than they were in 2000 or 2004 to say this year’s campaign was issue-oriented. Only four-in-ten Republicans, down from 56% in 2004, say issues were discussed more than usual.

More Mudslinging, But Not as Bad as 2004

While a majority of voters (54%) say that the 2008 campaign had more negative campaigning, or mudslinging, than they had seen in the past, this represents a substantial decline from 2004 when more than seven-in-ten (72%) voters said the tenor of the Bush-Kerry contest was particularly negative. There are no significant partisan differences in views about the tenor of the campaign, and the shift from 2004 is seen across the political spectrum.

However, while the election overall is not viewed as particularly negative, voters split in their evaluations of the two campaigns. As had been the case with registered voters in early October, almost half of voters (49%) now say John McCain was too personally critical of Barack Obama in this campaign. About one-in-five voters (21%), on the other hand, say the same about Barack Obama’s treatment of John McCain.

Opinion among independent voters mirrors that of voters as a whole – they are more than twice as li kely to say McCain was too critical of Obama as to say the reverse. While both Democratic and Republican voters are considerably more likely to view the opposing party’s candidate as too critical (and less likely to view their own candidate as too critical), about a third of Republicans (34%) say Obama was too critical of McCain (compared with 74% of Democrats who say McCain was too critical of Obama).

Section 2: The President-Elect’s Image and Expectations

High Expectations for Obama’s First Term

Two-thirds of voters (67%) expect Obama to have a successful first term, while only 22% think the new president will be unsuccessful. Nearly all Democrats (90%) are optimistic about Obama’s first term, as are 67% of independent voters. Republicans are nearly evenly divided; 41% believe Obama’s first term will be successful and 44% say it will be unsuccessful.

Voters are somewhat more upbeat about the prospects for Obama’s first term than they were four years ago about George W. Bush’s second term. After the 2004 election, 61% expected Bush to have a successful second term, while 29% predicted an unsuccessful second term. Democrats were particularly pessimistic in 2004: More than half (55%) thought Bush would be unsuccessful. Republicans, on the other hand, were about as confident that Bush’s second term would be a success as Democrats are about Obama’s first term.

While those who voted for Obama express the same level of optimism about his first term as Bush voters did about their candidate’s second term (92% and 94%, respectively), McCain voters are much more positive about Obama’s first term than were Kerry voters about Bush’s second term. Currently, 39% of McCain voters say they expect Obama to be successful, compared with 26% of Kerry voters who said the same about Bush.

Obama Inspiring to Most Voters

Majorities of voters view Obama as inspiring (81%), down-to-earth (73%), patriotic (70%), honest (68%), and well-qualified (58%). The percentages saying that each of these traits apply to Obama is higher than it was in the weeks leading up to the election. Most also say the president-elect makes them feel hopeful (69%) and proud (65%). However, a sizable minority continues to see Obama as risky (46%) and more than one-third say that he makes them feel uneasy (35%).

Nearly three-quarters of McCain voters describe Obama as risky (74%), and about the same proportion says he makes them feel uneasy (72%). Even among those who voted for Obama, nearly a quarter say their chosen candidate is risky (23%), though very few (4%) say he makes them feel uneasy. Obama voters nearly unanimously say the president-elect makes them feel hopeful (99%) and proud (94%), sentiments that are echoed by about a third of those who voted for McCain (35% feel hopeful and 33% feel proud).

Overall, the feelings Obama elicits from voters are far more positive than they were early in the campaign, and the change is most notable among Democrats. Fully 92% of Democratic voters say Obama makes them feel proud, up from 60% in March, when Obama was competing with Hillary Clinton for their party’s nomination. Democrats are also much more likely to say the president-elect makes them feel hopeful (96% vs. 72% in March) and considerably less likely to say he makes them feel uneasy (7% vs. 25% in March).

More Republican and independent voters also say Obama makes them feel proud and hopeful than did so in March. However, 68% of Republicans say the next president makes them feel uneasy, compared with 62% in March; the percentage of independents who express this view is virtually unchanged (36% in the current poll vs. 39% in March).

But one reaction to Obama that has dissipated almost entirely is anger. In March, roughly a quarter (26%) of registered voters said that Barack Obama made them feel angry, and this sentiment was shared by 37% of Republicans, 26% of independents and 18% of Democrats. Today, just 9% of voters say Obama makes them feel angry, including 17% of Republicans, 8% of independents, and 2% of Democrats.

Optimism about Race Relations

A majority of voters (52%) believe that Obama’s election as president will lead to better race relations in the United States; just 9% think race relations will get worse, while 35% say it will not make a difference. African Americans are especially optimistic about the future of race relations; fully three-quarters of black voters say race relations will improve now that Obama has been elected president, compared with 49% of white voters.

When asked if, before the campaign started, they thought the country would elect an African American as president in their lifetime, a narrow 52% majority says they thought it would happen while 42% say they did not think so. Just a quarter of black voters say that, before the campaign, they thought an African American would be elected president; many more white voters (56%) express this view. Voters over 65 were less confident prior to this campaign that this would be achieved in their lifetime (36%), while a majority of voters under 65 thought it would.

The election of the first African American as president and the widespread support Hillary Clinton garnered in the Democratic primaries have contributed to the impression among voters that the country will elect a female president in the future. Fully 85% say they think this will happen in their lifetime while just 12% say it will not. By comparison, a 1996 Newsweek poll showed the public much less confident, with 54% saying they thought a woman would be president in their lifetime and 43% saying it would not happen.

Overwhelming majorities of voters across demographic and partisan groups expect the country to elect a female president in their lifetime. More than eight-in-ten women (82%) and men (87%) think it will happen. Three-quarters of those 65 and older also say a woman will be elected president in their lifetime, as do even larger majorities of younger voters.

Section 3: A New Political Landscape

As Democrats look forward to a president from their party and expanded majorities in Congress, they are optimistic about the coming years. Most foresee a decrease in partisanship in Washington and say that their party’s leaders should try to work with Republican leaders to get things done, even if it means disappointing some groups of Democratic supporters. About half say Obama should appoint Republicans to serve in important administration positions, and most say the party should move in a more moderate, rather than a more liberal, direction.

By contrast, most Republicans want their leaders to move in a more conservative – rather than a more moderate – direction in the coming years, and a significant minority say congressional leaders should stand up to Obama on issues that are important to the base, even if it means less gets done in Washington. Not surprisingly, Republicans are far less optimistic than Democrats about the possibility of improved partisan relations. While most Democrats think partisanship will decrease, Republicans tend to see things at best staying the same, if not getting worse.

Most Want Bipartisanship

The public’s desire for bipartisanship – already strong following Democratic gains in the 2006 midterm election – has increased fol lowing Obama’s victory. Roughly three-quarters (77%) of voters say that Democratic leaders in Washington should try as best as they can to work with GOP leaders to accomplish things, even if it means disappointing some groups of Democratic supporters. About the same number (74%) say Republican leaders should do all they can to work with Obama.

Two years ago, there was less unanimity, particularly when it came to how the Democratic leaders should deal with the Republican president. While 73% of voters wanted Republican leaders, who had just lost their majorities in Congress, to do all they could to work with Democrats, 58% said the new Democratic majority should try as best as it could to work with George W. Bush. Instead, 34% wanted Democrats to stand up to Bush, even if it meant less got done in

Washington.

The difference is in the amount of frustration Democrats – and many independents – felt with Bush two years ago. At that time, half of Democratic voters wanted their party’s leaders to stand up to Bush, as did a third of independents. Today, fewer Republicans (39%) want GOP leaders to stand up to Obama and 17% of independents say the same.

In keeping with the theme of bipartisanship, six-in-ten voters say that the president-elect should appoint Republicans to serve in important positions in his administration. This includes 71% of Republicans, 59% of independents, and 51% of Democrats. Within the Democratic base, liberals are slightly more supportive of this idea than are conservatives and moderates (57% vs. 48%).

Republicans Favor More Conservative Course

While most Republican voters want party leaders to work with Obama even if it means disappointing some supporters, a clear majority says their leaders should pursue a more conservative, not a more moderate, agenda.

Fully six-in-ten (60%) Republicans and Republican-leaning independents say GOP leaders should move in a more conservative direction in the coming years, while just 35% advocate a more moderate course. This sentiment crosses gender, age and income lines within the party, and reflects the fundamentally conservative ideological balance within the GOP electorate. Roughly two-thirds (68%) of Republicans and Republican leaners identify themselves as conservative, and three-quarters of these voters (74%) think the party should turn further to the right. While a majority of the moderates and liberals within the party advocate a centrist approach, they make up fewer than a third (31%) of Republican voters overall.

Most Democrats, by contrast, favor their leaders moving in a more moderate, rather than a more liberal, direction in the coming years, and this reflects the more moderate cast of the party’s electoral base. A 57% majority of Democrats and Democratic-leaning independents say party leaders should move in a more moderate direction; just 33% say the party should pursue a more liberal course. Not surprisingly, 56% of liberal Democrats want the party to move further to the left, but they make up barely a third of Democratic

voters overall. A majority of Democrats and Democratic leaners describe themselves as moderate or conservative ideologically, and 70% of these voters favor the party pursuing a more moderate agenda.

Virtually all elements of the Democratic Party favor moving in a more moderate direction. Majorities of younger and older Democrats, white and black Democrats, and higher and lower education Democrats all favor moderation. There is substantial regional variation, however – with far more support for moving in a more liberal direction among Democrats in the Northeast and West than among Democrats in the South and Midwest.

There is little disagreement among Democrats over who should take the lead in setting the policy agenda. By a margin of 72% to 21%, Democrats and Democratic-leaning independents say that Obama, not Democratic leaders in Congress, should take the lead in setting the policy agenda in the coming year. Conservatives, moderates and liberals within the party all agree that the incoming president should set the agenda.

Democrats Foresee Better Relations in Washington

Overall, voters are a bit more optimistic about improved partisan relations in Washington this year than they were after the 2006 midterm election. After that election, Democrats controlled both chambers of Congress, while Bush entered the final years of his presidency. The shift is mostly due to the broad optimism of Democrats. Republicans have, if anything, become slightly more pessimistic about the chances of partisan comity than they were after the Democrats won majorities two years ago.

Most Democratic voters (57%) say they think relations between the parties in Washington will get better in the coming year. About a third (34%) says things will stay the same and just 6% see partisan divisions getting worse. This represents far more optimism than Democratic voters expressed two years ago, when 36% saw partisan relations getting better with Bush still in the White House.

The Republican outlook is far less positive. Just 17% think partisan relations will improve, while 31% say they will get worse over the coming year; 49% say things will stay about the same. The balance of GOP opinion is slightly more pessimistic than it was two years ago.

Independent attitudes about bipartisanship are more positive than negative by nearly two-to-one (34% say relations will get better; 18% say they will get worse). Still, a 44% plurality of independents foresees no change in the level of partisan conflict. The balance of opinion among independents is improved from how these voters felt following the 2006 midterms. At that time, about as many thought partisanship would get worse (21%) as better (26%).

More voters say they are happy (53%) than unhappy (41%) that the Democratic Party maintained control of Congress. But the balance of opinion is less lopsided than two years ago when the Democrats first regained majorities in both houses. In November 2006, 60% of voters were happy about the Democratic victory, while 27% were unhappy. The shift in opinion is starkest among independents. Two years ago, 62% of independent voters were happy about the Democrats taking the majority and just 16% were unhappy. The balance is still favorable today, but by a much slimmer 50% to 38% margin.

Section 4: Early Voting, Campaign Outreach and the Issues

Increase in Early Voting

One of the dramatic changes in this year’s election is the significant increase in the number of voters who cast their ballots before Nov. 4. About a third of voters (34%) say they cast their ballots before Election Day, up from only 20% in 2004 and 2006. Almost one-in-five (19%) say they voted early in person and 14% say they voted early by mail.

Early voters and Election Day voters were nearly identical in their preferences: 53% of early voters and 50% of those who voted on Election Day cast their ballots for Obama. Similarly, 43% of early

voters supported McCain, compared with 45% of Election Day voters.

Women were more likely than men to vote early, particularly by mail. Women made up 60% of early voters overall, and 66% of those voting by mail. Early voters also were older than those who voted on Election Day. A quarter of early voters were 65 or older compared with 18% of all voters. Nearly a third (32%) of voters who mailed their ballots were 65 or older. There were no significant differences in when people cast their ballot by education or income.

Early voting was more prevalent in the South and West than in the East, where the largest states have more restrictive policies regarding early and absentee voting. Just 3% of all early voters were in the East, though that region made up 21% of the nation’s voters. Early voting by mail, which is universal in Oregon and very common in Washington and Colorado, was widely reported by Western voters: 59% of those who reported voting early by mail live in the West. By contrast, early voters in the South, where many states provided early voting sites, were more likely to vote in person: 62% of early voters who cast their ballots in person live in the South.

Of voters who cast ballots

in person, 36% say they had to wait in line. Most of these voters waited less than an hour, but 10% say they waited for an hour or more. Although 41% of in-person early voters say they voted early to avoid long lines or crowds at the polls, these voters were more likely than Election Day voters to say they waited in line at the polls. Nearly half of in-person early voters say they had to wait in line (48%), compared with 33% of Election Day voters. On average, in-person early voters waited 21 minutes to vote, compared with an average of 15 minutes for those who voted on Election Day.

Voting Early More Convenient for Many

Nearly half of those who voted early (48%) say they did so because they thought the process would be more accessible or convenient than voting on Election Day; 31% said they wanted to avoid lines or crowds at the polling place, 11% said they voted early for convenience, and 5% said they thought it would be easier to vote. Early voters who cast their ballots in person were much more likely to say they voted early to avoid waiting in line than those who voted by mail (41% vs. 16%).

Nearly a third (32%) say they voted early because they would have been unable to vote or would have had difficulty getting to their polling place on Nov. 4. More than one-in-ten (11%) say they could not vote on Election Day because they were out of town, while 9% cite work as a reason they voted early. More people who voted by mail say their health was a reason for voting early than those who voted early in person (8% vs. 2%).

Small shares of voters say they voted early because they had already made up their mind (5%), they wanted to get it done (5%) or they always vote early (4%). Of those who voted by mail, 13% say they voted early because it was the only option in their state or county.

Confidence in Voting

Among voters nationwide, 73% are very confident that their vote this year was accurately counted. This is an increase of five points from 68% in the 2004 post-election survey, when Kerry voters, in particular, expressed skepticism about whether their votes were accurately counted. Just 54% of Kerry supporters felt their vote had been accurately counted, compared with 83% of Bush’s supporters. Today, there is no such gap. About the same number of Obama and McCain voters (73% and 74%, respectively) say they are very confident their vote was registered correctly.

The differing reactions of voters who backed the winning and losing candidates are greater when it comes to the accuracy of the voting process in general. This year, just 43% of voters say they are very confident that votes around the country were accurately counted, down slightly from 48% after the 2004 election. Among Obama voters, 56% are very confident in the accuracy of the vote count this year,

compared with about half-as-many McCain voters (29%).

The gap in confidence was even greater – in the other direction – four years ago. In November 2004, just 18% of Kerry’s supporters said they were very confident that votes around the country had been accurately counted (30% said they were not too or not at all confident in the vote count.) At the same time, fully 72% of Bush’s supporters were very confident in the accuracy of the 2004 election count nationwide.

Role of Churches Slips

Compared with 2004, far fewer voters who attend religious services say that information on political parties or candidates was made available to them at their place of worship this year. Among all voters who attend religious services at least once or twice a month, 15% say they received such information at their house of worship. That is significantly below the 27% who said they obtained this type of information in 2004, but is comparable to the number that said they did in 2000 (14%).

Across most religious groups, fewer people report having heard about candidates and political parties at their churches this cycle. Most noticeably, fewer than half as many white evangelicals say they were exposed to this kind of political outreach compared with four years ago (16% vs. 33%). Catholics, too, were much less likely to receive this kind of information (14% vs. 31% in 2004). Compared with other religious groups, black Protestants were most likely to hear about candidates and parties during this election year (29%).

The 2008 election cycle also saw a drop in the number of people who say that information on state or local ballot initiatives or constitutional amendments was made available at their places of worship. In 2004, nearly one-in-five (19%) voters who attend religious services received this kind of information, compared with 13% in this year’s campaign. Here again, declines occurred across most religious groups.

Few voters say that their clergy or other religious groups explicitly encouraged them to vote in a particular manner. Just 8% of those who attend services say they received this kind of encouragement in 2008. That is similar to the 11% who said they were urged to vote in a particular way by clergy or religious groups in 2004.

Catholics continue to stand out as the group most likely to say they were urged by clergy or other religious groups at their church to vote in a particular way. Among white Catholics, fully 18% say they were urged to vote in a certain way at church, more than double the number for any other religious group. By contrast, on the other questions of religiously-based political mobilization (receiving information on candidates, parties, and ballot initiatives), Catholics tend to closely resemble the public as a whole.

Campaigns Turning More to Email

While McCain backers were more likely than Obama backers to have been contacted by telephone over the course of this year’s campaign, Obama supporters were more likely to have received emails and to have been contacted in person. When it comes to telephone outreach, Pew’s election weekend survey found that McCain supporters received more automated “robo-calls” than Obama supporters, but there was no difference in the percentage of supporters of each candidate who received live calls from a campaign. And, reflecting the enthusiasm among Democrats, Obama voters were far more likely than McCain voters to have volunteered time or donated money to help their candidate.

Email has been a growing part of campaign communications strategy – nearly a quarter of voters (24%) say they received email from a campaign or other group urging them to vote in a particular way, up from 14% in the November 2004 post-election survey. And email outreach is not limited to the youngest voters; roughly a quarter of voters age 30-49 (27%) as well as those age 50-64 (28%) report having received campaign emails this year. The rate is lower only among voters age 65 and older.

There continues to be a socioeconomic skew to campaign email contacts, with wealthier and higher educated voters substantially more likely to get these emails. And as was the case in 2004, Democrats are more likely to have received campaign-related emails than Republicans. This year, 27% of Obama supporters say they got email from a campaign or group urging them to vote in a particular way, compared with 21% of McCain voters. The gap was almost identical in 2004, with 18% of Kerry voters and 11% of Bush voters receiving emails.

Top Issues in the Election

Pew surveys throughout 2008 found that the economy was seen by voters as the most important issue facing the country, a judgment echoed by voters in the national exit poll. Asked to choose from a list of five issues on the exit poll, 63% picked the economy as the top problem. Similarly, 58% of voters in the Pew post-election survey chose the economy when they were read the same list and asked to pick the most important issue affecting their vote. The other items on the list were chosen by about the same percentages as in the exit poll – the war in Iraq (10%), health care and terrorism (8% each), and energy policy (6%).

Yet when a separate sample of respondents in the poll was asked the same question in an open-ended format, the results were quite different. The economy remained the top choice, but received only a 35% plurality. No other issue was mentioned by more than 9% of voters, but some different issues matched or topped items on the close-ended list: 7% mentioned moral values, abortion, or gay marriage; and 7% mentioned taxes, socialism, or distribution of income. Energy policy, which had been a subject of intense focus earlier in the campaign, was mentioned by fewer than one-half of one percent of voters.

Although the economy was the number one issue for both Obama voters (68%) and McCain voters (46%) in the fixed issue list, it was the choice of far fewer McCain voters in the open-ended format. Just 18% volunteered the economy or a related topic, compared to 50% of Obama voters. In the open-ended format, more McCain voters mentioned taxes or the redistribution of income (8%) than the war in Iraq (3%) or health care (2%).

Section 5: The Press and Campaign 2008

Television remains the dominant source for campaign news, with fully 68% of voters saying they got most of their presidential campaign news from TV. However, fewer voters cite television as their main campaign news source than did so in 2004 (76%).

Far more voters cite cable (44%) rather than network news (18%) as their top source of election information. The balance of campaign news viewership has shifted increasingly toward cable and away from network broadcasts. While the proportion citing cable has increased slightly since 2004, the share saying network news has fallen substantially (from 29% to 18%).

Among the cable news networks, 22% of voters say they got most of their campaign news from the Fox News Channel, 21% from CNN, and 9% from MSNBC. More voters cite CNN as a main campaign news source than in 2004 (from 15% to 21%), while the Fox News audience has remained stable (21% in 2004, 22% currently). Local TV news continues to make up a small share of the campaign news picture: just 10% of voters name it as their main source.

The proportion of voters citing the internet as a main source for campaign news has risen from 21% in 2004 to 36%. By contrast, newspapers have lost ground since 2004; at that time, 46% said newspapers were their main source of campaign news, but just 33% cite newspapers currently. Radio also is down (from 22% in 2004 to 16%), and magazines are down slightly (6% in 2004, 3% currently).

While television is the top campaign news source for all voters, the internet is as important as television for younger voters. Nearly six-in-ten voters under age 30 (58%) say they get most of their campaign news from the internet, and about the same percentage cites television (60%).

Overall, a solid majority of voters now say that they get any news about the presidential election from the internet. Fully 56% of voters say this, up from 41% in 2004. And among voters ages 18 to 29, 76% say they get any campaign news from the internet, more than in any other age group.

Top Websites for Campaign News

Among the majority of voters who now get some election information online, well-known websites tend to predominate as the sites that voters went to most often for information about the election.

Overall, CNN is mentioned most frequently by voters who got campaign news online: 27% cited CNN as one of the websites they used most often. Other established online entities such as Yahoo, MSNBC/NBC and Fox are also mentioned by at least one-in-ten voters. MSN/Microsoft was cited by 9% of voters as top destination for campaign news, while Google was cited by 7%. The candidates’ websites were visited most often by 13% of voters.

Numerous political blogs and aggregator sites – with a range of partisan leanings – were mentioned by voters as top sources for election information, though generally in smaller numbers. Some 4% of voters who got campaign news online say they visited the Drudge Report most often, while 2% mentioned the Huffington Post. In addition, 5% say they often went to other conservative blogs or websites, while 3% went to polling sites, 2% cited other liberal blogs or websites, and 2% cited the Politico website.

While about the same percentage of Obama voters (59%) and McCain voters (55%) got at least some campaign news from the internet, their website choices differed. Obama voters were about twice as likely to visit CNN as McCain voters (35% vs. 18%). Obama voters were also more likely to name the New York Times and the Huffington Post as websites they used most often to get election information. By contrast, McCain voters were more than three times as likely as Obama voters to most often visit the Fox News website (18% vs. 5%) and the Drudge Report (9% vs. 1%).

Following Election Returns

Overall, 82% of voters say they followed the returns as they were coming in on election night. Obama voters were much more likely than McCain voters to have tracked the election results: nearly nine-in-ten (89%) Obama voters followed the returns compared with 75% of McCain backers.

Most voters (79%) watched the election results on television. Nearly one-in-five (19%) followed election returns on the internet, with voters under age 40 and liberal Obama voters being among the most likely to log on for election night updates.

For some Obama voters, election night was an evening spent with friends: 23% say they followed returns with friends compared with far fewer McCain voters (7%). Liberal and young Obama backers were especially likely to watch with others: more than a quarter of both groups did so. Among McCain voters, 16% of those under 40 followed return with friends, compared with only 4% of older McCain voters. Conservative McCain backers were no more likely than

moderate and liberal supporters to have watched with a group.

Overall, news organizations received positive reviews for their election night coverage. Three-quarters (76%) of voters who followed returns say news organizations did either an excellent (28%) or good (48%) job on election night, while just 23% rated their performance as only fair or poor. In 2004, just 17% rated election night coverage as excellent, compared with 28% currently.

Public Divided Over Press Influence on Election

Many voters express concern over the role of the press in influencing the election outcome. Nearly half (46%) say the press had too much influence on the election outcome, while 48% say news organizations had about the right amount of influence. In 2004, about as many voters (43%) said the press had too much influence on the outcome of the election, while 45% said they had about the right amount of influence.

There are wide partisan differences in views of whether the press has too much influence on the election: Nearly three-quarters (74%) of Republicans say the press had too much of an impact on the election. By contrast, an identical 74% of Democrats take a different view and say the press had the right amount of influence. Independents divide almost evenly, with 48% saying too much and 45% saying the right amount.

By contrast, four years ago, when Republican George W. Bush won a second term in office, partisans held roughly the same views: 46% of Republicans said news organizations had about the right amount of influence on the election outcome as did 45% of Democrats. Similarly, 45% of Republicans and 39% of Democrats said the press had too much influence in 2004.

More voters think the press was fair in the way it covered Obama’s campaign than say the same of the McCain campaign. Two-thirds (67%) say the press was fair toward Obama’s election campaign, compared with a narrower majority (53%) who say that McCain’s election effort was covered fairly. In 2004, 65% said the press was fair to John Kerry’s campaign, while 56% said that Bush was treated fairly.

Currently, an overwhelming percentage of Democrats (83%) think the press was fair toward Obama’s campaign, compared with just 22% of Republicans who say the press was fair to McCain. In 2004, 67% of Democrats thought the press was fair toward Kerry’s campaign and 40% of Republicans said the press was fair to Bush.

About the Survey

Results for this report are based on telephone interviews conducted from November 6-9, 2008 under the direction of Princeton Survey Research Associates International among a sample of 1,500 voters (“Voters” are those respondents who said they voted in the 2008 election.). The interviews were conducted among a population of 2,599 registered voters, 18 years of age or older, previously interviewed by Pew from October 16-19, 2008. Interviews were conducted on both landline telephones and cell phones (1,125 respondents were interviewed on a landline telephone, and 375 were interviewed on a cell phone, including 114 who had no landline telephone).

The combined landline and cell phone samples are weighted using an iterative technique that matches gender, age, education, race/ethnicity, region, and population density to parameters from the March 2007 Census Bureau’s Current Population Survey. The sample is also weighted to match current patterns of telephone status and relative usage of landline and cell phones (for those with both), based on extrapolations from the 2007 National Health Interview Survey. The weighting procedure also accounts for the fact that respondents with both landline and cell phones have a greater probability of being included in the sample.

To improve comparability of the recontacted cases with the final 2008 election results, the data were also weighted to reflect the margin of the election results (an approximately 7-point Obama advantage). This step helps to minimize bias that could occur because certain types of respondents may have been easier or more difficult to re-interview.

The following table shows the error attributable to sampling that would be expected at the 95% level of confidence for different groups in the survey:

Group Sample Size Plus or minus…
All voters 1,500 3.0 percentage points
Form 1 voters 744 4.0 percentage points
Form 2 voters 756 4.0 percentage points
Obama voters 767 4.0 percentage points
McCain voters 611 4.5 percentage points
Republican voters 438 5.5 percentage points
Democratic voters 548 5.0 percentage points
Indepen dent voters 480 5.0 percentage points
Republican and Republican-leaning voters 611 4.5 percentage points
Democratic and Democratic-leaning voters 773 4.0 percentage points

In addition to sampling error, one should bear in mind that question wording and practical difficulties in conducting surveys can introduce error or bias into the findings of opinion polls.