Pew Research Center

FOR RELEASE OCTOBER 23, 2008

Liberal Dems Top Conservative Reps in Donations, Activism

More Than a Quarter of Voters Read Political Blogs

FOR MEDIA OR OTHER INQUIRIES:

Communications Department
202.419.4372
www.pewresearch.org

RECOMMENDED CITATION

Pew Research Center, October 2008, "Liberal Dems Top Conservative Reps in Donations, Activism"

About Pew Research Center

Pew Research Center is a nonpartisan, nonadvocacy fact tank that informs the public about the issues, attitudes and trends shaping the world. It does not take policy positions. The Center conducts public opinion polling, demographic research, computational social science research and other data-driven research. It studies politics and policy; news habits and media; the internet and technology; religion; race and ethnicity; international affairs; social, demographic and economic trends; science; research methodology and data science; and immigration and migration. Pew Research Center is a subsidiary of The Pew Charitable Trusts, its primary funder.

© Pew Research Center 2026

Table of contents

  • About Pew Research Center
  • Liberal Dems Top Conservative Reps in Donations, Activism
  • Section 1: The Internet and Campaign 2008
  • Section 2: Campaign Contacts and Election Emotions
  • Section 3: Voting Concerns and Confidence
  • Section 4: First-Time Voters, Early Voters and Engagement
  • About the Survey

Liberal Dems Top Conservative Reps in Donations, Activism

More Than a Quarter of Voters Read Political Blogs

Overview
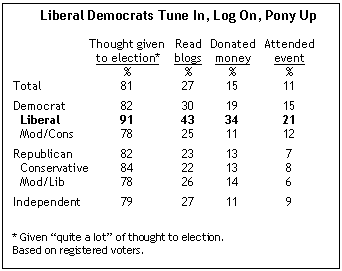
With less than two weeks to go before Election Day, voters remain riveted to the presidential campaign. But liberal Democrats are leading the way by engaging in far more activism than other partisan and ideological groups.

By almost any measure of political interest or activity, liberal Democratic voters are more strongly connected to this election than are conservative Republicans or other voters. Fully nine-in-ten liberal Democrats (91%) say they are giving quite a lot of thought to the election; somewhat fewer conservative Republicans (84%) say they are giving a great deal of thought to the election.

However, when it comes to direct political involvement – making campaign contributions or attending events – liberal Democratic voters hold much larger advantages over conservative Republicans. More than a third of liberal Democrats (34%) say they have contributed money to any of the presidential candidates during course of this campaign, which is more than double the percentage of conservative Republicans who say they have made donations (13%). And nearly three times as many liberal Democrats as conservative Republicans say they have attended a political event during the campaign (21% vs. 8%).

The latest national survey by the Pew Research Center for the People & the Press, conducted Oct. 16-19 among 2,599 registered voters interviewed on landline phones and cell phones, finds new indications of the internet’s expanding reach in political communication. Fully 39% of voters say they have watched some form of online video relating to the election – either candidate debates, interviews with the candidates, speeches or campaign commercials.

Liberal Democrats also are far more likely than others to watch online campaign videos or find election information on the internet. Six-in-ten liberal Democratic voters say they have watched some form of campaign video (debate, commercial, etc.), compared with 33% of conservative Republicans. In addition, 43% of liberal Democrats say they read blogs about politics and the campaign; only about half as many conservative Republicans (22%) say they have read political blogs.

Perhaps not surprising given their intense interest, liberal Democrats more often than other voters say they would have an intense emotional reaction if their candidate does not win the election.

In general, large majorities of Obama supporters and McCain supporters say they would be disappointed and worried if the opposing candidate wins on Nov. 4. But far more Obama supporters than McCain supporters say they would be angry and depressed if their candidate lost. Nearly four-in-ten Obama supporters (37%) say they would feel angry if McCain won, while 33% say they would feel depressed; among McCain supporters, just 18% say they would feel angry – and 17% depressed – if Obama wins.
Liberal Democratic supporters of Obama far more often than other Obama supporters say that, if McCain prevails, they would experience all of the emotions mentioned. More than half of liberal Democratic supporters of Obama (56%) say they would be angry if McCain wins, compared with 37% of all Obama supporters. The possibility of an Obama victory generates far less anger among conservative Republicans; just 20% say they would feel angry if Obama wins the election.

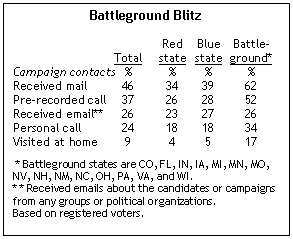
The survey finds that both campaigns are devoting the lion’s share of their political outreach efforts to targeting voters in the political battleground states. Fully 62% of voters in battleground states say they have received mail about one or more of the candidates, while 52% have received pre-recorded telephone calls about the campaign. Far fewer voters in so-called red and blue states report being inundated with mail and robo-calls from the campaigns.

Campaign Outreach

In the battleground states, more McCain supporters than Obama supporters say they have received mail and pre-recorded phone calls about the campaign. About six-in-ten McCain supporters in the battleground states (58%) say they have received pre-recorded campaign calls, compared with 47% of Obama supporters in these politically contested states. Comparable percentages of the supporters of both candidates say they have received personal phone calls or been visited at home by someone talking about the campaign.

The survey finds that, in general, the allegations of possible voter fraud and vote suppression in the upcoming election have stirred only modest concern among voters. Just a third of all voters believe that the possibility of ineligible voters casting votes – or some voters voting multiple times – represents a major problem. However, a substantial minority of Republican voters (45%) view this as a major problem; by comparison, just 23% of Democratic voters say the possibility of ineligible voters casting ballots is a major problem.
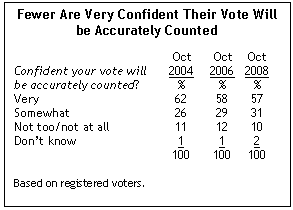
Somewhat fewer voters than in the last presidential election in the percentage of voters saying they are very confident that their vote will be counted accurately (57% vs. 62%). Republicans are less confident in an accurate vote count than in October 2004 (66% now, 75% then). Still, more Republicans than Democrats (54%) say they are very confident their vote will be counted accurately.
Section 1: The Internet and Campaign 2008

The internet is playing a large role in the current presidential campaign, both as a source of information for voters, as a means of communication between voters and political organizations, and among voters themselves. A solid majority of voters (59%) say they have sought out election content online or had some type of online communication about the campaign. Younger voters and Democrats are outpacing older voters and Republicans in using the internet for campaign information and activity. The use of online video has exploded, and significant numbers of voters have visited candidate websites and read blogs about the campaign. However, the use of social networking sites – such as MySpace or Facebook – for campaign information has not grown much since early in the campaign season.

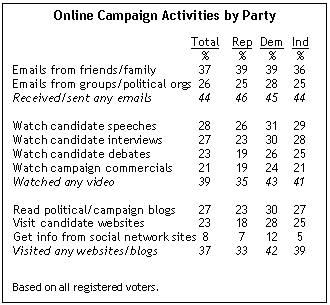
Last December, just 18% of voters said they had exchanged emails about the campaign with friends or family; now 37% have done so. About a quarter of voters (26%) now say they have received an email from one of the political campaigns or from a political group or organization, up from 17% in December.

The proportion of voters who have gone online to view videos about the campaign has increased substantially since the start of the election season. Overall, 39% of voters say they have watched some type of campaign-related video online. In December, 24% had done so. There has been an increase in viewing of all types of campaign videos, including candidate speeches (28% now, up from 14%), interviews (27%, up from 14%), campaign commercials (21%, up from 12%), and candidate debates (23% now, 12% in December).

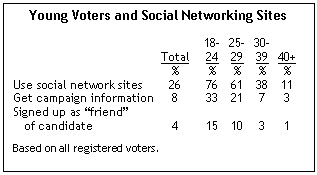
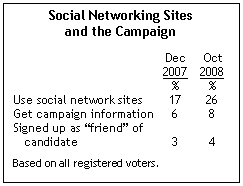
Nearly one-in-four voters (23%) have visited a candidate’s website; in November, just 16% had done this. And 27% have read blogs about politics and the campaign. But social networking sites remain a small part of the overall story about the internet and the campaign. Somewhat more voters now say they visit such sites (26% vs. 17% in December), but just 8% say they have visited a social networking site for campaign information, up two points since last year. Just 4% have signed up as a “friend” of a candidate (vs. 3% in December).

Partisan Differences in Campaign Web Use

There is little partisan difference in the use of email for the campaign, with roughly similar levels of Democrats, Republicans, and independents saying they have traded campaign-related emails with friends and family, or received emails from political groups. However, liberal Democrats far outpace other groups of partisans, including moderate and conservative Democrats, with 58% having traded emails with family and friends and 43% having received emails from political organizations.

Though the overall numbers are small, significantly more Democrats (12%) than Republicans (7%) or independents (5%) have gotten campaign information from social networking sites. All of these differences are driven by the behavior of liberal Democrats, 58% of whom have visited any websites or blogs about the campaign; by comparison, fewer than 40% of other partisan groups have done so (conservative and moderate Democrats at 35%, moderate and liberal Republicans at 37% and conservative Republicans at 32%).

Democrats also outpace Republicans in viewing video about the campaign, with 43% of Democrats – and 60% of liberal Democrats – saying they have seen at least some type of election-related video, compared with 35% of Republicans who have done this. Independents (at 41%) are more like Democrats in this respect. More Democrats than Republicans report viewing each type of online video asked about in the survey.

Young Voters and the Internet

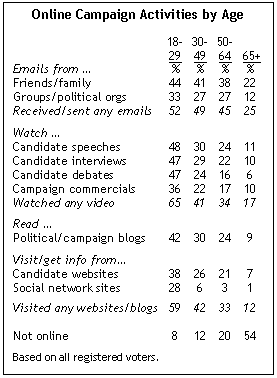
Young voters, who use the internet more than older voters, are much more likely to use the net for certain kinds of political information and activity. Roughly half of voters in all age groups – except those ages 65 or older – have sent or received emails about the election. Among those ages 65 or older, only a quarter have sent or received campaign-related emails.

Nearly two-thirds of voters under age 30 (65%) have watched a campaign-related video online, and almost as many (59%) have read blogs, visited candidate websites, or used social networking sites. About half of young voters report having watched speeches (48%), interviews (47%) or the debates (47%) online; slightly fewer (36%) have watched campaign commercials on the web. More than one-third of older voters, including 41% of those ages 30 to 49 and 34% of those ages 50 to 64, have watched some type of video.

Political and campaign blogs have emerged as a popular internet destination for young voters, but significant minorities of older voters report reading them as well. Among those under age 30, 42% have visited blogs, as have 30% of voters ages 30 to 49 and 24% of Baby Boomers ages 50 to 64. About one-in-ten older voters (9%) have read political or campaign blogs.

Social networking sites were cited as sources of campaign information and activity by many young voters in December, as the primary season was heating up. But the use of such sites for political purposes does not appear to have grown very much since then.

Social networking sites remain a source of information for many of the youngest voters; a third of those ages 18-24 say they have gotten campaign information from such sites. Far smaller percentages of older voters have done this. Notably, the proportion of the youngest voters who have gotten campaign information from social networking sites has not increased since December; at that time, 37% of 18-24 year-olds said they received campaign information from such sites.

Section 2: Campaign Contacts and Election Emotions

More voters say they have received mail from a candidate than say they have received a pre-recorded campaign call (46% vs. 37%), despite the increasing use of campaign “robo-calls” in this cycle. Reports of receiving campaign mail are now markedly higher than they were in March during the primary campaign (36% to 46%), but the proportion of voters saying they have received pre-recorded calls has remained stable.

Nearly a quarter of voters (24%) say they have received a personal, non-recorded call about the campaign, up from 16% in March. Overall, 46% of voters say they have received either pre-recorded campaign calls, personal calls or both. A relatively small share of voters (9%) say they have been visited at home by someone talking about the campaign.

At this point in the campaign, fully 15% of voters say they have contributed money to a presidential candidate, up from 9% in March. The current level is equal to the total reported immediately following the 2004 campaign. Today, more than one-in-ten voters say they have attended a campaign event (11%), up slightly from 8% in March. More Democrats, especially liberal Democrats, than Republicans or independents have attended campaign events and donated money to one of the candidates.

Battleground Campaign

While a greater proportion of committed Obama supporters have donated money to a presidential candidate or attended an event, McCain’s committed supporters are more likely than certain Obama backers to say they have received campaign mail or pre-recorded calls. Not surprisingly, campaign contacts are considerably higher for voters in battleground states, who receive more mail, phone calls and visits than voters in other states.

In these highly contested states, 68% of certain McCain supporters say they have received mail about one or more of the candidates, compared with 60% of swing voters and 59% of certain Obama supporters. Similarly, in these states, comparable percentages of certain McCain supporters (57%) and swing voters (54%) say they have received pre-recorded campaign calls; somewhat fewer certain Obama supporters living in the politically contested states (47%) report receiving such calls.

However, there are only slight differences in the percentages of McCain and Obama supporters and swing voters in the battleground states who say they have received personal campaign calls or been visited at home by someone talking about the campaign.

Campaign Calls Increase

Currently, 46% say they have received calls – recorded, personal or both – about the campaign.

In October 2004, only about a quarter of voters (26%) said they had been contacted by phone by a campaign, candidate or other group urging them to vote in a particular way (no distinction was made between personal and pre-recorded calls).

The current survey suggests that the frequency of campaign calls has increased substantially since the previous presidential campaign.

Emotional Reactions

With most national polls showing Barack Obama with a lead over John McCain, Obama supporters are optimistic about the election and appear more emotionally invested in the outcome compared with McCain voters. In particular, Obama supporters are much more likely to say they would feel angry or depressed if their candidate loses.

Asked about a series of emotions, 37% of Obama supporters say they would feel angry if the Democrat loses the election; 18% of McCain voters say they would feel angry if their candidate lost. Asked if they would feel depressed if the other candidate wins, 33% of Obama supporters say yes, compared with 18% of McCain voters. Similar levels of voters in each camp say they would feel disappointed (80% of Obama supporters, 78% of McCain’s) or worried (74% of Obama’s, 69% of McCain’s) if their candidate lost.

Younger Obama supporters say they would react strongly to a loss. About half (49%) of Obama voters ages 18 to 29 say they would be angry if the candidate loses. By contrast, just 31% of those ages 50 to 64 and 26% of those ages 65 and older say they would feel angry if McCain wins. In addition, Obama supporters who have attended college are more likely to say they would be angry if McCain wins than are with those with high school diplomas or less (41% vs. 31%). Among McCain supporters there is little difference between various age and education levels in the proportions who say they would be angry if their candidate does not win.

There are no significant differences by gender among supporters of either candidate in those who say they would be angry if the other candidate wins. Among Obama supporters, blacks and whites are just as likely to say they would be angry if their candidate loses. Nearly four-in-ten (37%) white Obama supporters say they would be angry if he loses, compared with 31% of black Obama supporters.

Notably, those who have been more involved in the campaigns, either by giving money or by attending campaign events, are more likely than others to say they would be angry if their candidate loses the election. For example, among Obama supporters, 51% who say they have contributed to a candidate say they would be angry if he loses, compared to 34% of those who have not contributed.

Section 3: Voting Concerns and Confidence

Reports about the accuracy of the voting process have received a good deal of public attention this year; 43% say they have heard a lot about voter registration records and concerns about voter fraud and suppression. The issue has received particular attention among Republicans; half of GOP voters have heard a lot about this, compared with just under four-in-ten Democrats.

Moreover, Republicans express substantially more concern about possible voter fraud than Democrats do about the possibility of voter suppression. Fully 45% of Republicans believe it is a major problem that “people who are not eligible to vote may cast votes anyway or that some voters may vote multiple times.” This rises to fully two-thirds (66%) of Republicans who say they have heard a lot about these issues.

By comparison, just 29% of Democrats express the same amount of concern that “there are people trying to prevent eligible voters from voting by removing them from rolls or challenging their eligibility at the polls.” Even among Democrats who have heard a lot about these issues, this rises to only 37% seeing it as a major problem

But concerns about voter suppression are particularly acute among African Americans, 43% of whom say that people trying to prevent eligible voters from voting is a major problem. That is nearly double the number of whites (22%) who see this as a major problem. A solid majority (58%) of blacks who have heard a lot about these issues see possible voter suppression as a major problem. There is no difference in the share of whites and blacks who see the possibility of voter fraud as a major problem (32% and 35%, respectively.)

Confidence in Voting Process Dips

Voters’ confidence that their own ballots will be counted accurately has declined somewhat since 2004. Four years ago, 62% of American voters were very confident that their votes would be counted accurately. Today, 57% are very confident. The share saying they are “somewhat” confident has risen from 26% to 31% since 2004, while about the same number (11% in 2004, 10% today) say they are not too or not at all confident.

What had been a growing racial divide in views of the accuracy of the voting process has narrowed greatly, as African American confidence in the process has surged in the past two years. Just more than half (51%) of black voters are very confident that their votes will be counted properly, which is a substantial change from 2006 when just 30% of black voters had such expectations. In 2004, 47% of black voters were very confident their votes would be counted. Meanwhile, 59% of white voters are very confident that their ballots will be counted accurately, down slightly from 63% in 2006 and 65% in 2004.

Though Republican voters remain more confident about the accuracy of voting than Democrats or independents, there has been a notable decline in confidence among GOP voters this year. In 2004, 75% were very confident that their vote would be accurately tallied, and in 2006, 79% were very confident in an accurate vote count. Currently, 66% of Republicans hold that view.

By comparison, Democrats and independents are far less assured than are Republicans about the accuracy of the voting process, with 54% of each group saying they are very confident that their votes will be accurately counted. In October 2004, half of Democratic voters and 60% of independents said they were very confident their vote would be accurately counted.

There are fairly consistent disparities in confidence about the voting process across gender, age and educational lines, compared with the past two elections. Women are six points less likely than men (54% vs. 60%) to say they are very confident their vote will be counted accurately. Just under half (48%) of 18-29 year-old voters say they are very confident their vote will be counted accurately, compared with about two-thirds (66%) of voters age 65 and over. Voters with a college degree are far more confident about their vote being counted than voters who never attended college (62% vs. 53%).
Section 4: First-Time Voters, Early Voters and Engagement

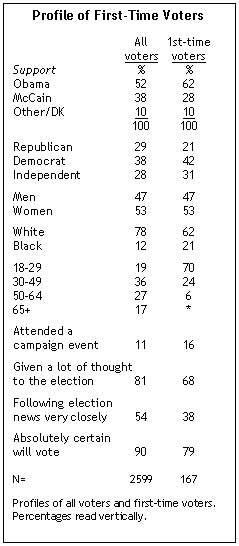
One-in-ten voters say that 2008 is the first year in which they will have voted. This includes 3% who say they voted for the first time this primary season, and another 7% who say the general election will be their first vote. This election cycle is the first time voting for nearly four-in-ten (38%) voters ages 18-29.

Not only are first-time voters much younger than the electorate overall (fully 70% of first time voters are younger than 30), but they also include a lower percentage of Republicans than the overall electorate. Just 21% of first-

time voters are Republicans, compared to 29% of all voters.

And while African Americans represent 12% of registered voters nationwide, fully 21% of first time voters are black.

Overall, people who are voting for the first time this year favor Obama over McCain by more than two-to-one (62% vs. 28%).

When it comes to interest in the election and certainty of voting, first-time voters lag behind all voters on several key measures. While first-timers are at least as likely to have attended a campaign event this cycle (16% compared with 11% of voters overall), they are 13 points less likely than all voters to have given a lot of thought to the election (68% vs. 81% overall). They also are far less likely to be following election news very closely (38% vs. 54% overall) and to be absolutely certain that they will vote in this election (79% vs. 90% of registered voters overall.)

Early Voters

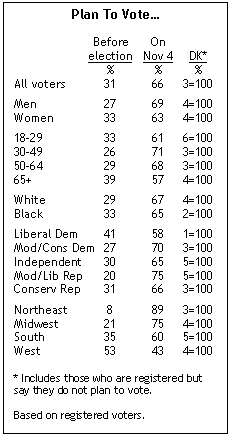
While most registered voters (66%) say they plan to cast their ballot on Election Day, roughly three-in-ten (31%) say that they plan to vote before Election Day, including 7% who say they already have cast a ballot in the presidential election. If these early voting rates prove to be accurate, it represents a substantial rise from 20% in 2004 and 14% in 2000, according to figures from the Early Voting Information Center.

Barack Obama’s lead is wider among the 31% who either have already voted or plan to vote early. He holds a 25-point lead over McCain (59% to 34%) among early voters, compared with an 11-point lead (51% to 40%) among those who intend to vote on Election Day. A large share of early voters affiliate with the Democratic Party this year (41% vs. 27% for Republicans).

This stands in contrast to findings from the 2004 National Election Pool exit polls, which included a telephone sample of Americans who reported having voted early or by absentee ballot. These voters favored Bush over Kerry by a 50% to 48% margin, virtually identical to the vote among those who cast their ballots at their polling place (51% to 48%).

A 53% majority of voters living in the West say they will cast their ballot before Nov. 4, as do 35% of those living in the South and 21% in the Midwest. Just 8% living in the Northeast say they will vote early, while 89% will vote on Election Day.

Liberal Democrats are the most likely partisan group to say they will vote early – 41% will do so compared with 31% of conservative Republicans. Nearly four-in-ten (39%) voters 65 and older say they either have already voted or plan to cast their ballot before Election Day.

Voters Engaged in 2008 Campaign

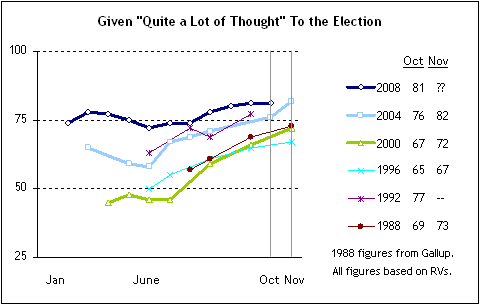
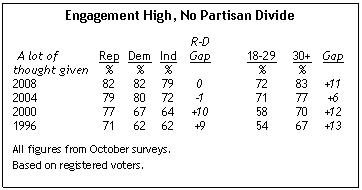
More than eight-in-ten voters (81%) have given a lot of thought to the coming presidential election, which is among the highest levels of consideration recorded by Pew surveys since the question was first asked in 1992. Voters have shown record high levels of engagement in this election throughout the year. The percentage of voters giving a lot of thought to the election has been over 70% since late winter; in past election cycles the share of voters giving a lot of thought to the election often hovered at around 60% until the final months of the campaign.

The high levels of engagement are shared across party lines. An identical 82% of Republicans and Democrats have thought a lot about the presidential race, as have 79% of independents. This is comparable to 2004, when partisan groups were about equally engaged in the race. However, in earlier elections, such as 2000 and 1996, Democrats and independents generally lagged behind Republicans in the amount of thought given to the election; in 2000, 67% of Democrats and 64% of independents had thought a lot about the race in October, far fewer than the 77% of Republicans who had done so.

Younger voters are less likely than their elders to say they have given a lot of thought to the election. About seven-in-ten (72%) voters under age 30 say they have given quite a lot of thought to the election, compared with 83% of those age 30 and older. The share of 18-29 year olds who have given a lot of thought to the election today (72%) is almost identical to where it was at this point four years ago (71%). Meanwhile, the share of voters age 30 and over who have given a lot of thought to the campaign is up from 77% to 83%.

Barely Half of Swing Voters Say it Matters Who Wins

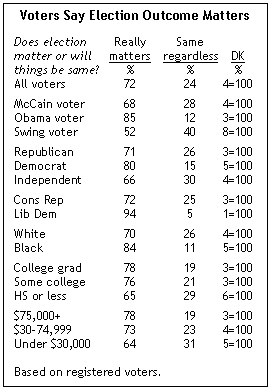
Fully 72% say that when it comes to making progress on the important issues facing the country, it really matters who wins the election. Just under a quarter (24%) say that things will be pretty much the same regardless of who is elected president. Democrats are more likely than Republicans and independents to say the winner of this election matters; fully 94% of liberal Democrats feel this way, compared with 72% of conservative Republicans. Swing voters are more ambivalent, with 52% saying the outcome matters and 40% saying things will pretty much be the same regardless.

Those with low levels of education and lower incomes are less likely than the more educated and affluent to say the election matters; 64% of those with family incomes of under $30,000 a year and 65% of those with no more than a high school degree say it matters who wins, compared with nearly eight-in-ten of those with a college degree or annual incomes of $75,000 or more (78% each).

About the Survey

Results for this survey are based on telephone interviews conducted under the direction of Princeton Survey Research Associates and Abt SRBI, Inc. among a nationwide sample of 3,016 adults, 18 years of age or older, from October 16-19, 2008 (2,264 respondents were interviewed on a landline telephone, and 752 were interviewed on a cell phone, including 267 who had no landline telephone). Both the landline and cell phone samples were provided by Survey Sampling International.

The combined landline and cell phone sample are weighted using an iterative technique that matches gender, age, education, race/ethnicity, region, and population density to parameters from the March 2007 Census Bureau’s Current Population Survey. The sample is also weighted to match current patterns of telephone status and relative usage of landline and cell phones (for those with both), based on extrapolations from the 2007 National Health Interview Survey. The weighting procedure also accounts for the fact that respondents with both landline and cell phones have a greater probability of being included in the sample.

The following table shows the error attributable to sampling that would be expected at the 95% level of confidence for different groups in the survey:

Group Sample Size Plus or minus…
Total sample 3,016 2.0 percentage points
Registered voter sample 2,599 2.5 percentage points
Form 1 registered voter sample 1,299 3.0 percentage points
Form 2 registered voter sample 1,300 3.0 percentage points
Republican registered voter sample 803 4.0 percentage points
Democratic registered voter sample 953 3.5 percentage points
Independent registered voter sample 726 4.0 percentage points
Certain McCain voters 911 4.0 percentage points
Certain Obama voters 1,101 3.5 percentage points
Swing voters 587 4.5 percentage points

In addition to sampling error, one should bear in mind that question wording and practical difficulties in conducting surveys can introduce error or bias into the findings of opinion polls.