Pew Research Center

FOR RELEASE AUGUST 17, 2008

Key News Audiences Now Blend Online and Traditional Sources

Audience Segments in a Changing News Environment

FOR MEDIA OR OTHER INQUIRIES:

Communications Department
202.419.4372
www.pewresearch.org

RECOMMENDED CITATION

Pew Research Center, August 2008, "Key News Audiences Now Blend Online and Traditional Sources"

About Pew Research Center

Pew Research Center is a nonpartisan, nonadvocacy fact tank that informs the public about the issues, attitudes and trends shaping the world. It does not take policy positions. The Center conducts public opinion polling, demographic research, computational social science research and other data-driven research. It studies politics and policy; news habits and media; the internet and technology; religion; race and ethnicity; international affairs; social, demographic and economic trends; science; research methodology and data science; and immigration and migration. Pew Research Center is a subsidiary of The Pew Charitable Trusts, its primary funder.

© Pew Research Center 2026

Table of contents

  • About Pew Research Center
  • Key News Audiences Now Blend Online and Traditional Sources
  • The News and Daily Life
  • Watching, Reading and Listening to the News
  • Online and Digital News
  • News Attitudes and Habits
  • News Interest and Knowledge
  • A News Audience Segmentation
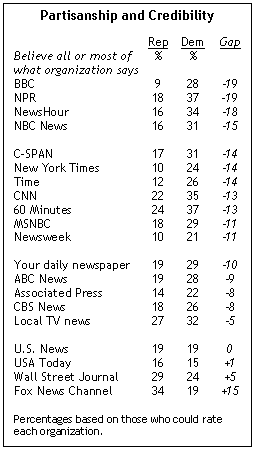
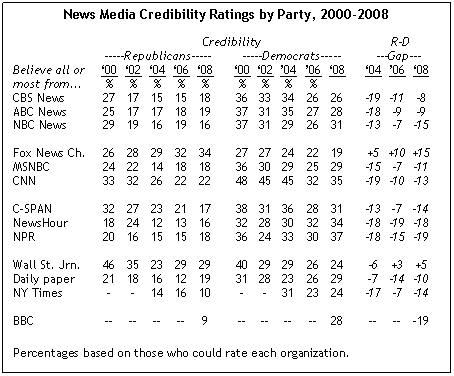
  • Media Credibility
  • Other Findings
  • About the Survey

Key News Audiences Now Blend Online and Traditional Sources

Audience Segments in a Changing News Environment

Overview

For more than a decade, the audiences for most traditional news sources have steadily declined, as the number of people getting news online has surged. However, today it is not a choice between traditional sources and the internet for the core elements of today’s news audiences.

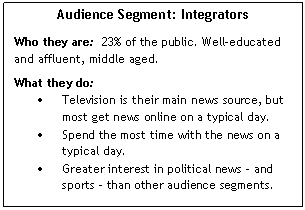
A sizable minority of Americans find themselves at the intersection of these two long-standing trends in news consumption. Integrators, who get the news from both traditional sources and the internet, are a more engaged, sophisticated and demographically sought-after audience segment than those who mostly rely on traditional news sources. Integrators share some characteristics with a smaller, younger, more internet savvy audience segment – Net-Newsers – who principally turn to the web for news, and largely eschew traditional sources. (For a complete description of how the news audience segments are classified, see pg. 45.)
Figure

Like web-oriented news consumers, Integrators are affluent and highly educated. However, they are older, on average, than those who consider the internet their main source of news. Overall, Integrators spend more time with the news on a typical day than do those who rely more on either traditional or internet sources; far more enjoy keeping up with the news a lot than in any other news segment.

Integrators also are heavier consumers of national news – especially news about politics and Washington – and are avid sports news consumers. Television is their main news source, but more than a third cite the internet as their primary source of news during the day. This reflects the fact that a relatively large proportion of Integrators log on to the internet from work (45%).

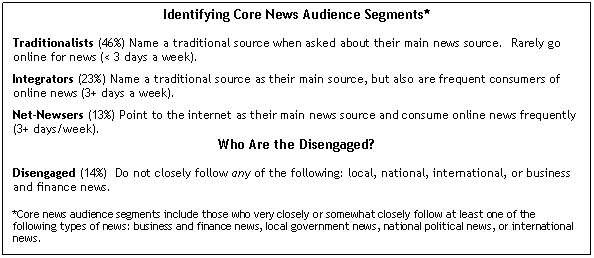
The 2008 biennial news consumption survey by the Pew Research Center for the People & the Press was conducted by telephone – including both landline phones and cell phones – from April 30 to June 1 among 3,612 adults nationwide. It finds four distinct segments in today’s news audience: Integrators, who comprise 23% of the public; the less populous Net-Newsers (13%); Traditionalists – the oldest (median age: 52) and largest news segment (46% of the public); and the Disengaged (14%) who stand out for their low levels of interest in the news and news consumption.

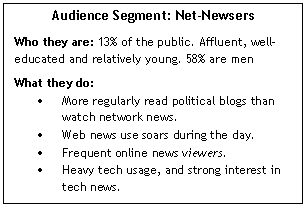
Net-Newsers are the youngest of the news user segments (median age: 35). They are affluent and even better educated than the News Integrators: More than eight-in-ten have at least attended college. Net-Newsers not only rely primarily on the internet for news, they are leading the way in using new web features and other technologies. Nearly twice as many regularly watch news clips on the internet as regularly watch nightly network news broadcasts (30% vs. 18%).
Figure

This web-oriented news segment, perhaps more than the others, underscores the challenges facing traditional news outlets. Fewer than half (47%) watch television news on a typical day. Twice as many read an online newspaper than a printed newspaper on a typical day (17% vs. 8%), while 10% read both.

However, Net-Newsers do rely on some well known traditional media outlets. They are at least as likely as Integrators and Traditionalists to read magazines such as The New Yorker and The Atlantic, and somewhat more likely to get news from the BBC.
Figure

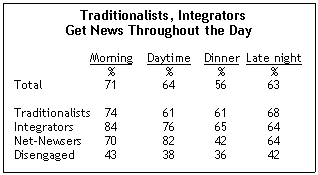
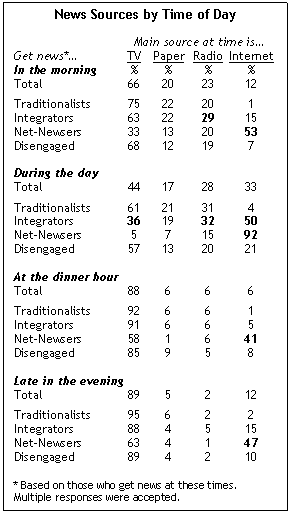
Fully 82% of Net-Newsers get news during the course of the day, far more than the Traditionalists and the Disengaged, and slightly more than the Integrators. Nearly all who get news at this time go online for information (92%). Yet they do tap traditional sources at other times of the day; nearly two-thirds get news late in the evening and of these, more rely on television news than the internet.

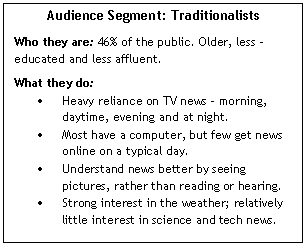
Despite sweeping changes in the news landscape, Traditionalists remain the largest segment of the overall news audience. Compared with the Integrators and Net-Newsers, Traditionalists are downscale economically – 43% are not employed and 60% have no more than a high school education.

Figure

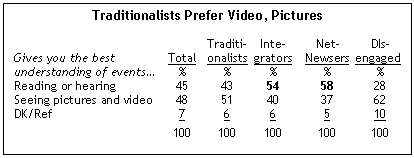
Television dominates as the favored news source among Traditionalists. And at each time of the day – whether morning, daytime, dinner hour, or late at night – overwhelming majorities who get news at these times cite television as their main source. Unlike the news Integrators, or those who mostly get news from the web, most Traditionalists say that seeing pictures and video, rather than reading or hearing the facts, gives them the best understanding of events.

Most Americans fall into the three core news audiences – Integrators, Traditionalists, or Net-Newsers. The fourth group – the Disengaged – are very much bystanders when it comes to news consumption. They are less educated on average than even the Traditionalists and exhibit extremely low interest in – and knowledge of – current events. Just 55% of the Disengaged get any news on a typical day, and just 20% know that the Democrats have a majority in the House of Representatives.

Trends in News Consumption

The diversity of news audience segments identified reflects the long-term changes in news consumption observed in the biennial survey, conducted April 30-June 1 among 3,615 Americans.

Figure

Since the early 1990s, the proportion of Americans saying they read a newspaper on a typical day has declined by about 40%; the proportion that regularly watches nightly network news has fallen by half.

These trends have been more stable in recent years, but the percentage saying they read a newspaper yesterday has fallen from 40% to 34% in the last two years alone. Newspapers would have suffered even greater losses without their online versions. Most of the loss in readership since 2006 has come among those who read the print newspaper; just 27% say they read only the print version of a daily newspaper yesterday, down from 34% in 2006.

The television news audience, by contrast, has generally remained stable since 2006, and the proportion regularly watching cable news in particular has increased (from 34% to 39%). The appeal of television news is seen in the large percentages of the news segments – particularly Integrators – that continue to watch: A majority of Integrators (56%) get news online on a typical day while an even larger share (66%) got news from television.

Cable news draws substantial numbers of viewers among Integrators and Net- Newsers. More than four-in-ten Net-Newsers (43%) regularly watch cable news, far more than the proportion that regularly watches network or local news. A majority of Integrators also regularly tunes in to cable news (53%); by comparison, just 37% say they regularly watch one of the nightly network news broadcasts.

Notably, radio news also is an important element in Integrators’ news diet. Nearly half of Integrators (46%) listen to news on the radio during a typical day. While the internet is the main news source for Integrators during the course of the day, about as many in this segment rely on radio news as TV news during the day (32% radio vs. 36% TV news).

Online News Still Growing

Since 2006, the proportion of Americans who say they get news online at least three days a week has increased from 31% to 37%. About as many people now say they go online for news regularly (at least three days a week) as say they regularly watch cable news (39%); substantially more people regularly get news online than regularly watch one of the nightly network news broadcasts (37% vs. 29%).

Since 2006, daily online news use has increased by about a third, from 18% to 25%. However, as the online news audience grows, the educational divide in online news use – evident since the internet’s early days in the mid-1990s – also is increasing. Currently, 44% of college graduates say they get news online every day, compared with just 11% of those with a high school education or less.

Net-Newsers and Integrators take advantage of a range of web features to get the news. Roughly four-in-ten (39%) Net-Newsers – and about a third of Integrators (32%) – have gotten a news story emailed to them in the past week. And while 30% of Net-Newsers regularly watch news online, 19% regularly listen to news on the web.

Net-Newsers and Integrators also rely on news and political blogs as a part of their news diet. Roughly a quarter of Net-Newsers (26%) and somewhat fewer Integrators (19%) say they regularly read blogs on politics or current events. Overall, only 10% of the public regularly reads political and news blogs.

Other Key Findings:

Figure
  • In spite of the increasing variety of ways to get the news, the proportion of young people getting no news on a typical day has increased substantially over the past decade. About a third of those younger than 25 (34%) say they get no news on a typical day, up from 25% in 1998.
  • A slim majority of Americans (51%) now say they check in on the news from time to time during the day, rather than get the news at regular times. This marks the first time since the question was first asked in 2002 that most Americans consider themselves “news grazers.”
  • Social networking sites are very popular with young people, but they have not become a major source of news. Just 10% of those with social networking profiles say they regularly get news from these sites.
  • As in past news consumption surveys, the audiences for specific cable news outlets remain divided along political lines. Currently 51% of regular CNN viewers are Democrats, up from 45% two years ago. Nearly four-in-ten regular Fox News viewers are Republicans (39%), about the same as in 2006.
  • Regular readers of magazines such as The New Yorker, The Atlantic and Harper’s Magazine stand out for their high level of political knowledge. Nearly half (47%) answered three political knowledge questions correctly – the highest percentage of any news audience.
  • Overall, 15% of Americans say they have a smart phone, such as an iPhone or a Blackberry. More than a third of smart phone owners (37%) say they get news from these devices.
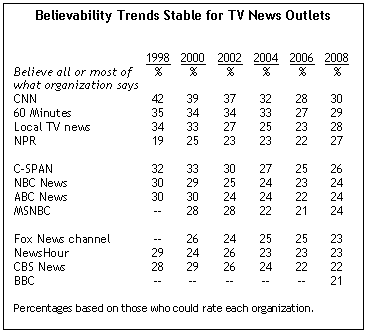
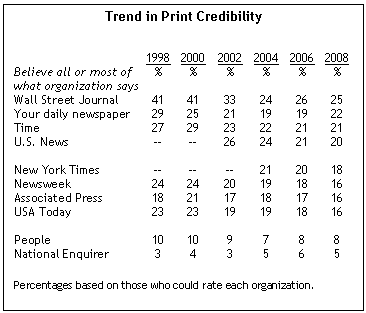
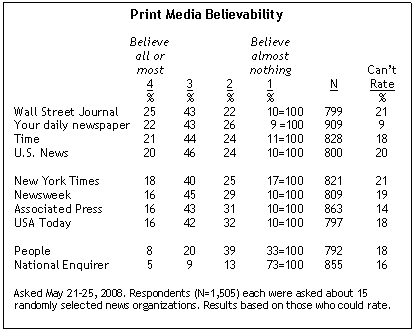
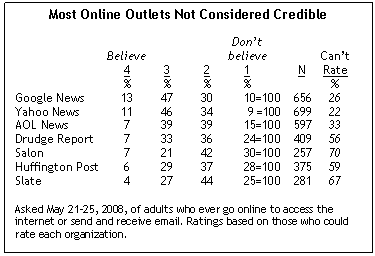
  • Believability ratings for national news organizations remain very low. If anything, believability ratings for major online news outlets – including news aggregators such as Google News and AOL News – are lower than for major print, cable and broadcast outlets.
  • Though the audience for nightly network news broadcasts are smaller than they were a decade ago, regular viewers of these broadcasts are loyal. Nearly seven-in-ten (69%) say they would miss these broadcasts a lot if they were no longer available.
Figure

The News and Daily Life

News Consumption ‘Yesterday’

Getting news in one form or another remains a daily habit for the vast majority of Americans. On any given day, roughly eight-in-ten people report seeing, reading or listening to some kind of news. However, reflecting the steep declines in newspaper and radio news consumption, the overall share using any traditional news source on a given day has fallen from 90% in 1994 to 85% in 1998 to 73% today.

The arrival of the web has counterbalanced this slow-but-steady decline. When the share getting news online is included in the total, 81% of Americans report having gotten some kind of news the previous day, unchanged from 2006 and down just four points over the past decade. There are no signs that the web is expanding the overall news audience, however. It still has a smaller reach than any other medium on any given day, and the vast majority of Americans who do get news online also are using other traditional sources on the same day.

TV news remains the most widely used source. On any given day, 57% of Americans watch news on TV, a rate that has remained largely stable over the past 10 years (59% in 1998). By comparison, the share that reads a newspaper yesterday stands at 34%, down six points in just the past two years and down 14 points from 48% a decade ago. Radio news is suffering comparable losses. The share that listened to news on the radio yesterday also has slipped 14 points since 1998, from 49% to 35%.

Figure

Overall, 29% of Americans say they got news online yesterday, up from 23% in 2006. At this point, the web still trails TV, radio and newspapers in terms of the percentage of users each day. Relatively few Americans report the internet as their sole source of news. Instead, the vast majority of people who get news from the web also are using traditional sources. Of the 29% who got news online yesterday, 84% also got news from TV, radio or a newspaper. Just 5% of Americans got their news only from the web.

Figure

As was the case two years ago, TV news viewers spend much more time getting the news than do those who get news on the radio, newspapers and the internet. Nearly half of Americans (48%) watched TV news for a half-hour or more yesterday, and the average among TV news viewers was nearly an hour (54 minutes).

Users of other news sources spend far less time, on average, with those sources than do TV news viewers. People who say they listened to radio news spent 41 minutes, on average, doing this; newspaper readers spent an average of 39 minutes reading the paper. By comparison, online news users spent an average 35 minutes getting the news from the web.

The internet is used as a news source at about the same rate among both young and middle-aged Americans. For example, 50-to-64-year-olds are about as likely as 18-to-24-year-olds to report having gotten news over the internet yesterday (29% vs. 30%, respectively). Fewer than half as many people ages 65 and older got news from the internet yesterday (13%).

Figure

Age is an even bigger factor when it comes to watching TV news and reading a daily newspaper. Only about a third of those younger than 25 watched any TV news yesterday (34%) by far the lowest percentage in any age group; even those who are slightly older (ages 25 to 34) are much more likely than the very young to say they watch TV news on a typical day (50%).

Similarly, just 15% of the youngest age group says they read a newspaper yesterday. In this case, that is only somewhat less than the proportion of those ages 25 to 34 who read a newspaper yesterday (24%). The only age group in which a majority of people say they read a newspaper yesterday is those ages 65 and older (55%).

Time with the News

While somewhat fewer people are following the news on a typical day, on average, Americans, including young people, are spending about the same amount of time with news as they did a decade ago. This year’s news consumption survey finds that people spend just over an hour – 66 minutes – watching, reading and listening to the news on a given day. Nearly half of that time (30 minutes) is spent watching television news, 14 minutes listening to news on the radio and 13 minutes reading a newspaper. The average time spent getting news online among the American public is just nine minutes.

Figure

Figure

While the total time that people spend with the news is largely unchanged from a decade ago, time devoted to reading newspapers is down from an average of 18 minutes in 1998 to 13 minutes today. That is mostly because fewer people are reading papers. However, the time that a newspaper reader spends reading the paper has not changed over the past decade; they spend an average of 39 minutes with the paper, which is virtually unchanged from 1998 (38 minutes).

There is a consistently large gap in time spent on the news by age. People who are younger than 30 spend just 46 minutes with the news on a typical day. That compares with 63 minutes on average among people in their 30s, and higher averages for older age groups.

This age gap is based on the fact that younger people are much less likely to read a newspaper or watch television news on a typical day. However, even when younger people do get the news they spend less time with these sources than do older people. Overall, those younger than 30 who get news on a typical day spend, on average, 65 minutes with the news; that is substantially less than the average for older news consumers.

News Throughout the Day

Figure

About seven-in-ten Americans (71%) say that on a typical weekday they start their morning with some type of news. Somewhat fewer people say they get news during the course of the day (64%), around the dinner hour (56%), or late in the evening (63%). The overall patterns of daily news consumption have not changed substantially in recent years.

Young people, who generally spend less time with the news than do older people, are far less likely than their elders to get news in the morning, and particularly at the dinner hour. Fully two-thirds of Americans older than 50 (66%) say they get news on a typical day around the dinner hour; that compares with about half of people ages 35 to 49 (53%), and even smaller shares of younger age groups.

Figure

Since 1998, there has been a noticeable decline in the proportion of young people getting news around the dinner hour. A decade ago, a solid majority of those younger than 25 (59%) said they got news at this time; today, just 39% get news around the dinner hour. The age gap in news consumption at the dinner hour has grown substantially over the past decade, as two-thirds of those older than 50 continue to get news at this time.

However, there are no age differences in news consumption during the course of the day: Fully 63% of those 18 to 24 regularly get news during the day, making it the most popular time for this age group to get news. That is comparable to the proportions of people in older age groups saying they get news during the course of the day.

TV Still Dominates Late in Day

Figure

Television remains the dominant source for news, both overall and at each time of day, but newspapers and radio continue to attract substantial minorities of the news audience, particularly in the morning and during the day.

However, the rise in the internet’s prominence as news source is the largest change in news consumption at different times of day. Today, one-third of daytime news consumers say they get their daytime news online, up from just 5% who said the same 10 years ago.

Figure

The web is now the dominant source for younger people who get news during the course of the day. By a wide margin (52% to 26%), more people younger than 35 who get news during the day rely on the internet rather than television. For those 50 and older, television remains the leading news source during daytime hours. This is particularly the case for people ages 65 and older; 76% of seniors who get news during the day mainly rely on television compared with 6% who mainly use the internet.

Radio also is a popular source for people who get news during the day. Nearly three-in-ten of those who get news during the day (28%) say radio is their main source. Among working people, slightly more turn to radio for news during the day than go to television (32% vs. 30%); many more rely on the internet for news at this time.

A decade ago, television was the leading source of news during the day for every age group. Since then, there has been a major migration from television to the internet among younger people who get news during the day. But older people (ages 65 and older) continue to rely on television about as much as they did a decade ago.

While online news has overtaken television as a source for young people during the day, TV news still remains the top news source at other times. For example, about quarter of those younger than 25 (24%) who start their morning with the news cite the internet as their top source, but many more (62%) cite television as their main source of news at this time.

Watching, Reading and Listening to the News

Six years ago, about as many people said they regularly watched one of the nightly network news broadcasts as said they regularly watched a cable news channel. But in subsequent news consumption surveys, cable news has steadily increased its advantage over the nightly network news. In the current survey, 39% of the public reports watching cable news channels such as CNN, MSNBC or the Fox News Channel regularly, while 29% say they regularly watch one of the big three nightly network news broadcasts.

Local television news remains more popular than either cable news or network news – 52% regularly watch the local news about their own viewing area. However, as with network news viewership, the percentage watching local TV news has fallen steadily in recent years. In 1998, nearly two-thirds of the public (64%) regularly watched their local TV news.

TV News Outlets Maintaining Audiences

Roughly a quarter of the public (24%) regularly watches CNN and about an equal percentage (23%) regularly watches the Fox News Channel. These numbers are basically unchanged from two years ago. The percentage watching MSNBC has increased marginally since 2006 but has nearly doubled over the past 10 years; today, 15% of Americans watch MSNBC regularly. CNBC is viewed regularly by 12% of the public.

Figure

Equal proportions (14%) say they watch either the NBC Nightly News or ABC’s World News Tonight. The audience for the CBS Evening News is significantly smaller (8%) and has decreased by more than half in recent years. In 2002, 18% regularly watched CBS’s nightly newscast. While the percentage watching ABC and NBC has fallen over that same time period, the decline has not been nearly as dramatic.

Viewership of the network morning shows has remained very stable in recent years: currently 22% report regularly watching the Today Show, Good Morning America or the Early Show. The Sunday morning news shows such as Meet the Press, This Week and Face the Nation have also maintained a steady audience. Currently 13% regularly watch one or more of these programs, which is largely unchanged from 2006 and 2004.

Cable Audience Younger, Better Educated

Figure

Not only is the cable news audience larger than the network news audience, it also is younger, more educated and more knowledgeable about current events. Only 21% of those younger than 30 regularly watch a nightly network news show, compared with 36% who regularly watch a cable news channel. Men are much more likely than women to watch cable news, and among men under age 30, fully 42% regularly watch cable news. That compares with 29% of women younger than 30.

More than four-in-ten college graduates (45%) watch cable news regularly, compared with only 28% who watch the network news. And more than half (55%) of those who are highly knowledgeable about current events watch cable news. Only 28% of this highly knowledgeable group watches network news regularly.

Another area where the cable and network news audiences differ is in their political orientation. Democrats are more likely than Republicans to regularly tune into nightly network news shows, while similar numbers of Republicans and Democrats regularly watch cable TV news. However, not all cable audiences are alike, and there have been changes in the partisan profile of the various cable news networks just in past two years.

News Audiences More Democratic

Figure

The general public has become more Democratic since 2006, and this is reflected in the audiences for leading TV news outlets. The audiences for CNN and MSNBC, which were heavily Democratic two years ago, have become even more so: fully 51% of CNN’s regular viewers are Democrats while only 18% are Republicans. MSNBC’s audience makeup is similar – 45% of regular viewers of MSNBC are Democrats, 18% are Republicans.

The regular audience for nightly network news also is now about two-to-one Democratic (45% vs. 22% Republican). In 2006, 40% of the regular viewers of nightly network news were Democrats compared with 28% who were Republicans.

The regular audience for the Fox News Channel continues to include more Republicans than Democrats. Currently, 39% of regular Fox News viewers are Republicans while 33% are Democrats; in 2006, the margin was 38% to 31%.

Talk Shows and Ideology

In addition to providing round-the-clock news coverage, the major cable news networks feature a range of talk shows that focus on politics and current events. The talk show hosts, rather than the networks, generally set the tone for these programs, and the audiences tend to be much more ideologically polarized than the public at large.

Rush Limbaugh’s radio show has the most conservative audience, among the eight talk shows included in the survey. Some 5% of the public listens to Limbaugh’s show regularly and another 9% listen some of the time. Among Limbaugh’s regular listeners, 80% describe their political views as conservative. Just 7% say they are political moderates and 10% are liberals. By contrast, the general public is 35% conservative, 35% moderate and 20% liberal.

Figure

Two Fox News Channel talk shows, Hannity & Colmes and The O’Reilly Factor, also have highly conservative audiences. Hannity & Colmes is viewed regularly by 7% of the public; among the show’s regular viewers, 68% describe themselves as politically conservative. The O’Reilly Factor with Bill O’Reilly is the most widely viewed talk show included in the poll: 10% of the public watches this show regularly and another 19% watch sometimes. Roughly two-thirds of O’Reilly’s regular viewers are conservatives, while a mere 3% describe themselves as liberals.

The audiences for Lou Dobbs Tonight, Hardball with Chris Matthews and Larry King Live are more in line with the public ideologically. Dobbs’ audience is slightly more conservative than the general public, while Matthews’ and King’s audiences are slightly more liberal. Of the three, Larry King has the largest audience – 27% tune into Larry King Live at least sometimes.

Regular viewers of The Colbert Report with Stephen Colbert and The Daily Show with Jon Stewart are much more liberal than the public at large. More than a third of Colbert’s regular viewers (36%) describe their political views as liberal and 45% of regular Daily Show viewers say they are liberal. The audiences for these two shows are roughly equal in size; 19% watch The Colbert Report regularly or sometimes while 23% watch The Daily Show.

Despite the ideological bent of many of these talk show audiences, majorities of the shows’ viewers say they prefer to get political news from sources that don’t have a particular political point of view rather than sources that share their point of view. Rush Limbaugh’s regular listeners are among the most likely to say they prefer sources that share their point of view – 37% express this view while 53% say they prefer news sources that don’t have a particular point of view. Similarly, 37% of Larry King’s regular audience prefers sources that share their political views. Stephen Colbert’s viewers are among the least likely to seek out sources that reflect their political views. Only 15% of regular viewers of The Colbert Report say they prefer news sources that share their point of view, while 79% say they prefer sources without a political point of view.

Colbert and Stewart Attract Young Viewers

Figure

The audiences for radio and cable talk shows tend to be dominated by older Americans, with two notable exceptions – the Colbert Report and the Daily Show. Fully 43% of Colbert’s regular viewers are younger than 30, as are 42% of Stewart’s regular viewers. That is roughly double the proportion of people younger than 30 in the general public (21%).

The audiences for Larry King and Rush Limbaugh are more representative of the population at large, though still slightly older than the average. Slightly less than a quarter of their regular viewers are younger than 30, and about the same percentage are 65 or older. Lou Dobbs has the oldest audience, among the shows included in the survey. About three-in-ten (31%) regular viewers of Dobb’s program are 65 or older, about twice the proportion in the general public (16%). Among regular viewers of O’Reilly, Hannity & Colmes, and Hardball, older viewers outweigh younger ones by a significant margin.

Newspapers Down, Online Papers Show Promise

Figure

This year for the first time in roughly 15 years of asking the question, fewer than half of all Americans report reading a daily newspaper on a regular basis. Only 46% say they read the paper regularly – this number is down from 52% in 2006 and was as high as 71% in 1992. In a similar vein, fewer now report having read a newspaper “yesterday,” a more reliable measure of newspaper readership. Only 34% say they read a newspaper yesterday, down from 40% in 2006.

The falloff in readership over the past two years has occurred across the board – men and women, whites and blacks, college graduates and those who never attended college are all reading the newspaper at lower rates than in 2006. Age continues to be strongly correlated with newspaper readership. Young people are much less likely than their older counterparts to read a daily newspaper. Currently, only 15% of those younger than 25 report having read a newspaper yesterday. Among those ages 25 to 34, 24% read a newspaper yesterday. This compares with roughly half (46%) of those 50 and older.

Figure

The audience for online newspapers has grown modestly since 2006. In the current survey, 13% say they read the web version of a newspaper yesterday, or both the print and online versions, up from 9% two years ago. Yet that increase has not made up for the steep loss in print readership (from 34% to 25%).

Still, online newspapers are gaining readers, especially among people ages 25 to 34. Among people in this age group who read a newspaper yesterday, fully 16% report having read the paper online; slightly fewer (12%) say they read the paper version. The proportion of this age group reporting it read an online newspaper yesterday has doubled – from 9% in 2006 to 19% in 2008. Even so, total newspaper readership among those ages 25 to 34 has not increased over the past two years.

Community Papers’ Stable Niche

Figure

At a time when daily newspapers are losing readers, the audience for local weekly community newspapers has remained relatively stable. Currently, 33% say they read such newspapers regularly, about the same as in 2006 (35%) and 2004 (36%).

Somewhat more women than men say they regularly read weekly community papers (36% vs. 29%). And in contrast with the regular audience for daily newspapers, there are only slight educational differences in the readership for local papers; people with a high school education are almost as likely to be a regular reader of these papers as are college graduates (31% vs. 36%).

As is the case with daily newspapers, however, weekly community newspapers are much more popular with older people than young people. Four-in-ten of those 50 and older say they regularly a community newspaper, double the percentage of those 24 and younger (19%).

Magazines

Readership rates for news magazines, national news publications and magazines such as The New Yorker, The Atlantic and Harper’s Magazine have remained relatively steady in recent years, as newspaper readership has dipped. Currently, 12% of the public regularly reads a news magazine such as Time, U.S. News, or Newsweek. That proportion is down only marginally from 14% in 2006. Young people are as likely as their older counterparts to read these national weeklies.

Figure

Personality magazines such as People and Us Weekly are a regular part of the news diet for 8% of the public. Another 22% sometimes read these magazines. The most loyal readers are young women: 23% of women under age 30 regularly read magazines such as People. This compares with only 6% of men in that same age group.

One-in-twenty Americans reads business magazines such as Fortune or Forbes on a regular basis. These magazines appeal mainly to men, college graduates and those with annual incomes of $100,000 or higher. About one-in-five men (22%) in families with annual incomes of $150,000 or more read a business magazine regularly. Men are also more likely than women to read technology magazines such as Wired: 6% of men vs. 1% of women read these types of magazines regularly.

Political Talk Radio

Figure

The audience for political talk radio remains more conservative and more Republican than the public at large. Among those who listen to these shows regularly, 44% describe themselves as conservatives, while only 19% consider themselves liberals. Nearly three-in-ten conservative Republicans (28%) regularly listen to radio shows that invite listeners to call in to discuss current events, public issues and politics. This compares with only 17% of the general public. Men are more likely than women to listen to talk radio; men between the ages of 30 and 49 are among the most likely to tune in.

Conservative Republicans also represent the core audience for religious radio shows such as Focus on the Family. While only 6% of the general public listens to religious radio on a regular basis, 14% of conservative Republicans tune in regularly and another 20% listen sometimes. Some 15% of white evangelical Protestants regularly listen to religious radio as do 17% of black Protestants. Among white mainline Protestants, only 3% regularly listen to these types of shows.

Online and Digital News

Online news consumption continues to grow, and substantial minorities of Americans are now taking advantage of specialized web-based and digital tools to get the news. Overall, 37% of the public – including more than half of those who go on the internet (55%) – say they regularly get news online. A decade ago, just 13% of the public, and 35% of internet users, went online for news at least three days a week.

Figure

From online news feeds to social networking sites and news updates by cell phone, Americans use a variety of technologies to get the news.

Overall, 22% of Americans say they have a customizable web page, such as iGoogle, that includes news items. Among the heaviest web news consumers – those who go online for news daily – fully 44% say they have a customizable web page that incorporates news items.

A third of all Americans – and half of those who go online – say they regularly or sometimes watch news programs or video clips on the web. And while social networking sites have yet to catch on as a major news source for young people, one-in-ten of those who have social networking profiles say they regularly get information about the news from social networking pages – about the same proportion that regularly watches “The Daily Show” or listens to NPR.

Despite the popularity of new web-based and other information sources, there are persistent demographic differences in online news consumption. A decade ago, college graduates were far more likely than those with less education to regularly go online for news; that remains the case today, as fully 61% of college graduates go online for news at least three days a week, compared with just 19% of those with no more than a high school education.

More whites than African Americans regularly get news online, in part because a greater proportion of whites go on the internet. Although the percentage of blacks who regularly go online for news has tripled over the past decade (from 8% to 24%), African Americans continue to lag behind whites in regular online news consumption (38% of whites vs. 24% of blacks).

Figure

Since the Pew Research Center’s 2006 news consumption survey, there has been a substantial increase in the proportion of Americans who get the news online every day. A quarter say they go online for news every day, up from 18% two years ago; a decade ago, just 6% said they got news online on a daily basis.

This trend also underscores the education gap in online news consumption: Nearly all of the growth over the past two years has been among those who have attended at least some college. Fully 44% of college graduates now say they get news from the internet every day, up from 32% two years ago; the increase has been comparable among those who have attended but not completed college (from 18% to 30%). By contrast, just 11% of those with no more than a high school education get news online every day, which is virtually unchanged from 2006 (10%).

Online News Sources

Figure

Web portals, such as Yahoo and MSN, and other familiar names dominate the list of most frequented news sites among web news users. Yet the list of most-used news sites also reveals the internet’s diversity: While a large proportion of online news users mention a well-known site -28% mention Yahoo alone – numerous sites are mentioned by just 2% of respondents or fewer.

Aside from web portals, television news organizations also are frequently named by web news consumers; fully 17% name CNN.com, while 10% cite MSNBC/NBC, and 7% say Fox. The New York Times is the most frequently mentioned newspaper (4%), although The Wall Street Journal, USA Today, and The Washington Post are each named by 2% of the public.

Search Engines Used for News

Search engines continue to be an increasingly popular means of getting news on particular subjects. The proportion of all web news consumers who use search engines to look for stories has not grown appreciably; 83% say they use search engines to find stories of interest, about the same as in 2006.

Figure

But a growing percentage is using search engines more frequently. Nearly a third of online news users (31%) deploy search engines to look for stories at least three days a week, up from 24% two years ago and 19% in 2004.

There are relatively few demographic differences in search engine use among those who go online for news. Those 18 to 29 (86%) are somewhat more likely than the oldest web news consumers to use search sites, but even among those 65 and older, more than seven-in-ten (73%) use search engines for news. The highly educated search for news in higher percentages than those with no more than a high school degree, though, again, the gap is relatively modest (college graduates 86%, high school or less 77%).

Using a search engine does not necessarily mean that online news consumers are being taken to unfamiliar sites to read about stories of interest to them. In fact, a slim majority (51%) say that when searching for news, they are not usually taken to sites that are unfamiliar to them. Nearly as many (48%) say the opposite, and report going to unfamiliar websites when using search engines to find news.

Other Tools: News Ranking Sites

News-ranking websites, such as reddit.com and digg.com, have been growing in popularity, yet only a small share of internet news consumers (5%) say they have ever used one of these sites to find news stories.

The relatively small group that uses these sites is disproportionately young and male. About one-in-ten men younger than 30 who go online for news (11%) say they use news-ranking websites to find stories. By contrast, among those who get news online, only 3% of women under 30 and only 4% of men over 30 use these ranking sites.

Young People ‘Graze’ the Web

Overall, 73% of all online users say they come across news online when they have been on the web for another purpose. This is largely unchanged from 2006 (76%), but a decade ago far fewer people inadvertently got news online (54% in 1998).

The practice of coming across news inadvertently on the internet is prevalent among all age groups but is most popular among the very young: 84% of 18-to-24-year-old online news users get news in this way, compared with about three-quarters (73%) of internet news users between 25 and 64, and just 58% of those 65 and older.

Figure

This is one of several ways in which the online news habits of very young people differ from older people. For example, a solid majority of online news users younger than 25 (64%) say they more often follow links to news stories, rather than go directly to the homepages of news organizations themselves. By contrast, those who are a little older are more likely to go directly to the homepages of news sources; nearly half (48%) of those ages 25 to 29 do this, compared with only about a third (34%) of those just a few years younger.

Online News Activities

Figure

Reflecting the rapid growth of online video in recent years, a third of all Americans say they regularly or sometimes watch news programs or video online. Among those who go online, half either regularly (14%) or sometimes (36%) watch news video on the internet.

Nearly a quarter of Americans (24%) say they at least sometimes listen to newscasts online (5% regularly). About the same proportion of the public (23%) says they regularly or sometimes read blogs about politics or current events, with 10% doing this on a regular basis.

One-in-five people reports that they at least sometimes read comments from readers about news stories, though far fewer – just 7% – say they regularly or sometimes post comments on news stories themselves. Even among those who get news online, 75% say they never post comments about news stories.

Just 5% say they regularly or sometimes read online magazines, such as Slate or Salon. Among college graduates, one-in-ten does so.

Online Video’s Broad Appeal

Figure

Among internet users, online news video is particularly popular with young people and African Americans. Nearly two-thirds (65%) of blacks who go online say they regularly (18%) or sometimes (47%) watch news video clips or programs; that compares with 47% of whites.

Almost six-in-ten (58%) internet users younger than 30 say they at least sometimes watch news video; those 50 and older are far less likely to do this.

Of those with a high school education who go online, fully 44% sometimes watch news video on the web. By comparison, online college graduates are only slightly more likely to do this (51% regularly/sometimes). These differences are more pronounced when based on the general public, because people with a high school education are less likely to go online than are those who have attended college (particularly college graduates).

Older Blog Readers

Figure

Older Americans – those ages 65 and older – lag far behind younger people in their use of the internet and in adapting to new web technologies, such as online news videos and social networking sites.

However, seniors who go online are at least as likely as younger people who go online to regularly read blogs about politics and current events. Roughly one-in-five of those 65 and older who go online (19%) say they regularly read such blogs; that compares with 14% of those ages 50 to 64, 15% of those in their 30s and 40s, and 12% of those younger than 30.

Those with no more than a high school education who go online are about as likely as college graduates to regularly read political or news blogs (13% vs. 14%). There are only modest partisan differences in regular blog reading: 22% of liberal Democrats who go online say they regularly read political or news blogs, compared with slightly smaller shares of other political groups.

Social Networking Sites

Figure

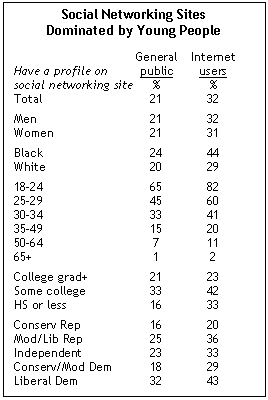
Fully 65% of people 18 to 24 – 82% of those who go online – say they have a profile on MySpace, Facebook or another social networking site. Online social networking is an activity dominated by those in their teens and early 20s: only about half as many people in their early 30s who go online have created social networking profiles (41%). Among older age groups, much smaller minorities have created profiles.

There also are sizable racial differences in social networking: among online users, African Americans are much more likely than whites to have a profile on MySpace, Facebook or a similar site (44% vs. 29%).

Roughly four-in-ten liberal Democrats (43%) who go online – and 32% of liberal Democrats overall – say they have a profile on social networking site. That is a greater percentage than in other political groups and fully twice the proportion of conservative Republicans who have social networking profiles.

Checking Profiles…Several Times a Day

Figure

Reflecting the popularity of social networking, more online young people say they visit a social networking site where they have a profile each day than say they go online for the news each day (46% vs. 31%). Among all online users, by contrast, far more people say they go online daily to get news than to check social networking websites (37% vs. 25%).

Most people younger than 25 who have a social network profile (56%) check their site at least daily, and a significant minority (31%) says they check the site several times a day. Older social network users check their sites much less frequently.

Getting the News from Facebook & MySpace

Figure

For a minority of Americans, social networking sites themselves are a source of information about news and current events. Three-in-ten of those who have social network profiles say they regularly (10%) or sometimes (20%) get information about local, national or international news through social network sites.

For people with social network profiles, local TV, cable news, newspapers and other traditional outlets are far more frequent news sources than are the pages of social network sites. However, about as many people with social network profiles say they regularly get news from these sites as say they regularly listen to NPR (11%) or watch the late-night comedy programs “The Daily Show” or “The Colbert Report” (10% each).

Social network pages also offer the opportunity to share news stories. About a quarter of those with social network profiles either regularly (6%) or sometimes (18%) shares information about local, national or international news on their social network page.

Online News on Demand

Figure

Many web news consumers take advantage of a variety of online tools to tailor the news to their needs and time demands. More than a third (36%) say they have a customizable web page, such as iGoogle or My Yahoo, that includes news items; 12% say they have an RSS reader that includes news items; and 25% say they receive email news alerts and summaries. Fully half of all online news users say they have at least one of these tools or services.

Figure

There are few demographic differences among online news consumers in the use of these tools. Women are about as likely as men to report receiving the news in these ways and there are no significant differences across education levels. Compared with younger people, fewer Americans 50 and older who go online for news have a customizable news webpage. But older people are just as likely as middle-aged and younger people to have the news delivered to them by email or to receive an RSS feed. Blacks are somewhat more likely than whites to get news delivered by e-mail.

Not surprisingly, those who go online for news daily are more likely than those who do so less often to say they get news via email, RSS or customizable web pages.

Emailing News Stories

Figure

A large majority of those who go online (68%) say they have been emailed a news story by a friend or associate. Somewhat fewer (47%) say they have sent a news story to someone. More people report both of these activities now than did so in 2006.

However, the proportions saying they have received or sent emailed stories in the past week have remained stable since 2006; 27% of internet users say they received an emailed story in the past week, including 12% who said this had happened today or yesterday.

Online at Work

Figure

More than four-in-ten full-time and part-time workers (44%) say they regularly go online from their place of work. There are substantial education and income gaps among those who go online from work and those who do not: three-quarters of those who have attended graduate school say they go online from work, nearly four times the proportion among those with no more than a high school education (20%). And while 66% of those with family incomes of $100,000 or more go online from work, just 20% of those with incomes of less than $30,000 do so.

Whites (45%) are somewhat more likely than blacks (34%) to go online from work, while workers older than 65 are significantly less likely than younger workers – especially those ages 30 to 49 – to say they access the internet at their job.

Figure

A third of those who regularly go online at work say they get most of their news through the internet on a typical weekday, compared with 12% of those who do not regularly access the internet at work. Nonetheless, somewhat more online workers (39%) name television as their main source for news.

Interestingly, a majority of those who regularly go online from work (56%) say keeping up with the news is not important to their job.

News Attitudes and Habits

Most Americans continue to enjoy keeping up with the news – and more than half (52%) say they enjoy it a lot. Despite the pace of modern life, a large majority of people (68%) say they do not feel they are too busy to keep up with the news. And for the most part, people do not feel overloaded with the amount of news and information available these days.

Figure

Consistent with the Pew Research Center’s past media consumption surveys, young people are far less likely than older Americans to say they get a great deal of enjoyment from following news. Enjoyment of the news has consistently been associated with higher levels of both news interest and news consumption.

Just a third of Americans younger than 25 say they enjoy keeping up with the news a lot, while nearly as many (26%) say they get little or no enjoyment from following the news. Among those 50 and older, fully 61% say they enjoy keeping up with the news a lot, while just 10% get little or no enjoyment from this.

In addition, many people in their mid-20s through their mid-30s say they are simply too busy to keep up with the news. Overall, just 30% are too busy to follow the news, while 68% say it is “pretty easy.” But about four-in-ten (41%) younger adults – those ages 25 to 34 – say they often are too busy to follow the news. For those 50 and older, finding time for the news is much less of problem: Compared with younger adults, roughly half as many (21%) say they are often too busy to keep up with the news.

A majority of Americans (60%) say they do not feel overloaded by the amount of news available these days, while 38% say they do feel overloaded. In this case, nearly identical proportions of the youngest people (those younger than 25) and those 50 and older say they feel overloaded (40% and 41%, respectively). Women are somewhat more likely than men to say they feel overloaded by the amount of news available these days (42% vs. 34%).

While some Americans feel overburdened by the amount of news available, many more say they like having news on in the background while they are doing other things. Overall, 55% say they like having news on in the background while 43% do not. As might be expected, those who like having news on in the background are more likely to get news on a typical day – whether from television, radio, newspapers or the internet – than those who do not.

Attitudes and News Consumption

Figure

No single attitude is more closely associated with high attention to “hard” news – local, national, international and business news – than deriving a lot of enjoyment from keeping up with the news.

The vast majority of the hard news audience (73%) – those who regularly follow all four news topics – say they enjoy keeping up with the news a lot; that compares with barely half (51%) of those with moderate interest in hard news and just 15% of those who express little or no interest in these subjects.

Similarly, a large proportion of the hard news audience (82%) says it is pretty easy to find time to get the news. That is nearly double the proportion among those with low attention in local, national, international and business news (42%). Those highly attentive to hard news also are more likely to say they like having news on in the background compared with those who are less interested in hard news. Comparable majorities of those with high, moderate and low interest in hard news say they do not feel overloaded by the amount of news available.

Most Want Broad Overview

When Americans get the news, they generally are interested in getting an overview of the top news of the day. Fully 62% say it is more important to them to get an overview of the news than to get news about topics of particular interest to them (27%).

Figure

The preference for an overview of the news vs. specific topics is generally consistent across major demographic groups. Yet as with other attitudes about the news, young people are an exception. Those who are 18 to 24 are evenly divided about which is more important: 48% say they prefer to get an overview of the news, while 44% say they like getting news about topics of particular interest to them.

In terms of the news sources they use, a narrow majority of Americans (51%) say they mostly rely on a few sources while nearly as many (46%) say they get news from many sources. There are no major demographic differences in views about whether people prefer a few news sources or multiple sources.

‘News Grazers’ Now a Majority

Figure

Somewhat more Americans now say they are the kind of person who checks in on the news from time to time rather than gets the news at regular times (51% vs. 45%). That represents the first time since the question was asked six years ago that a majority said they get the news from time to time.

Figure

An over-whelming proportion of very young people are news grazers, checking in on the news from time to time. Nearly eight-in-ten of those younger than 25 (78%) say they get the news from time to time. Even among people only somewhat older – those ages 25 to 34 – a much smaller majority (56%) says they check on the news rather than getting it at regular times. Among those 50 and older, most say they get the news at regular times.

News Grazers Watch Less, Go Online More

Americans who gather news from time to time watch and read less news overall than do those who get news at regular times. News grazers spend on average 56 minutes per day consuming news. By contrast, regular-time news consumers on average spend 79 minutes per day consuming news.

Figure

News grazers are less inclined than regular-time news consumers to watch most types of TV news. Just 41% of grazers regularly watch local television news, compared with 67% of regular-time news consumers. And the grazers are about half as likely as regular-time consumers to regularly watch network evening news broadcasts, Sunday talk shows or listen to NPR. Cable news, which is available at any time of the day, is more attractive to grazers than most other television news. But the regular-time viewers still outpace the grazers as regular consumers of this source of news (44% vs. 35%).

Compared with news grazers, people who get news at regular times also are more likely to read traditional print publications – daily newspapers and weekly community papers. But news grazers are far more likely to regularly go online for news. About six-in-ten (59%) of those who get news from time to time go online for news at least three days a week; that compares with 39% of those who get news at regular times.

Smaller News Audiences Stay Loyal

Since the early 1990s, the regular audience for nightly network news has fallen by half while the proportion who regularly read a newspaper has declined by a quarter. Yet among those who still watch the nightly broadcasts and read newspapers, majorities say they would miss these sources if they were no longer available

Figure

Nearly seven-in-ten regular network news viewers (69%) say they would miss the broadcasts a lot if they were no longer available; that is greater than the percentage of regular network viewers who said this six years ago (62% in 2002).

Somewhat fewer regular newspaper readers (59%) say they would miss the newspaper a lot if it were no longer available; this percentage is largely unchanged from 2002 (57%). Notably, when asked if they would miss reading a newspaper “in print” an identical percentage (58%) say they would miss reading the paper a lot.

A similar percentage of those who get news online (62%) say they would miss web news a lot if it were no longer available.

Older People More Attached to Traditional Sources

Older people are much more likely than younger people to read a daily newspaper. Older newspaper readers also are more likely than younger ones to say they would miss the paper a lot if it were no longer available.

Among those 50 and older who regularly read a newspaper, two-thirds (67%) say they would miss the newspaper a lot if it were no longer available. This compares with only 51% of those younger than 50. Similarly, older people are more likely to say they would miss the network evening news. Fully 76% of regular network news viewers 50 and older say they’d miss their evening news program a lot if it was no longer available; that compares with 61% of those younger than 50.

Figure

Just the opposite is true of regular online users. Younger online users are more likely than their older counterparts to say they would miss online news sources if they were no longer available. Roughly two-thirds (65%) of regular online news consumers under age 50, compared with 55% of those 50 and older, say they would miss online news sources a lot.

Are All News Outlets the Same?

Many news consumers feel that the news media are largely undifferentiated: More than four-in-ten (43%) say that all the news media are pretty much the same. Slightly more than half (54%) disagree, saying that there are a few news sources that they trust more than others. There has been little change in these views since 2004.

The more educated are more likely to trust some sources more than others. Nearly seven-in-ten college graduates (69%) say they trust a few news sources more than others, compared with 55% of those with some college and only 44% of those with no more than a high school education.

Figure

Large majorities of liberal Democrats (71%) and conservative Republicans (65%) say they trust some news sources more than others. That compares with only about half of independents (52%), conservative and moderate Democrats (50%), and moderate and liberal Republicans (49%).

About two-thirds of those who express a strong interest in hard news say they trust a few news sources more than others. By comparison, 53% of those with moderate interest in hard news, and just 28% of those with low interest, say they trust a few sources more than others.

Figure

Comparable majorities in the regular audiences for CNN and the Fox News Channel and the three nightly network broadcasts say they trust a few news sources more than others. But the NPR audience is a bit different. Nearly three-quarters of the NPR audience (74%) trusts some media more than others while only about a quarter (24%) say the news media are pretty much all the same.

By wide margins, the regular audiences for individual cable news and radio programs reject the idea that the news media are pretty much all the same. This is particularly the case for regular viewers of the Daily Show and Hannity & Colmes; just 14% of the regular viewers of each of these programs say the news media are pretty much all the same.

News from Your Point of View?

Figure

Most Americans say they prefer to get political news with no point of view rather than news that shares their political news. Two-thirds (66%) wants news with no political point of view, which is consistent with measures from recent news consumption surveys.

Majorities in all major demographic and political groups say they prefer news with no political point of view. However, less educated people are more likely than those with more education to say they prefer news from their point of view. A third of conservative Republicans, and about the same proportion of liberal Democrats (31%), say they prefer news with their point of view. That compares with 27% of conservative and moderate Democrats, 21% of moderate and liberal Republicans and just 15% of political independents.

News Interest and Knowledge

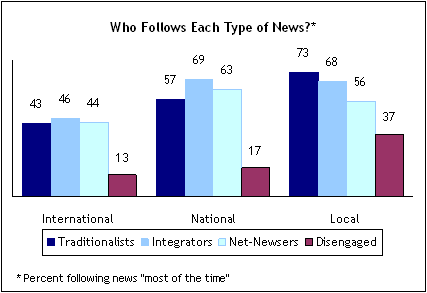
Most Americans continue to track local and national news most of the time, while most say they follow international news only when important developments occur. A 57% majority follows local community news closely most of the time, whether or not something important is happening. Similarly, 55% follow national news most of the time. By contrast, only 39% follow foreign news most of the time, and the majority (56%) follows it only when something important is happening.

Figure

Interest in each of these broad categories of news is virtually unchanged from 2006. While interest in local news is fairly consistent across major demographic groups, interest in national and international news is driven in part by socioeconomic factors. College graduates are significantly more likely than those who never attended college to follow both national and international news most of the time, not just when something important is happening. In addition, those with higher annual incomes follow national and international news on a more consistent basis.

Large majorities of the regular viewers of major cable TV talk shows closely track national news. Among the regular audiences of Hardball with Chris Matthews, Hannity & Colmes, Lou Dobbs Tonight, and The O’Reilly Factor, three-quarters or more say they follow national news most of the time, not just when something important is happening.

Beyond the cable shows, other audiences that pay particularly close attention to national news include readers of magazines such as The Atlantic, Harper’s Magazine and The New Yorker; Rush Limbaugh listeners, NPR listeners, and those who regularly watch the NewsHour with Jim Lehrer or the network Sunday morning news programs.

Weather’s Broad Appeal

Figure

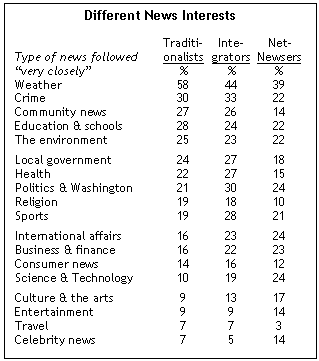
In terms of the public’s specific news interests, weather has consistently been a closely followed news topic. Nearly half of Americans (48%) say they follow weather news very closely, which is largely unchanged from 2006 (50%). No other topic generates close to this level of interest. Crime is the next highest-rated topic, but just 28% say they follow crime news very closely.

While more women than men say they are very interested in weather news – and more older people than younger people – interest in weather news is broadly shared. For instance, half of those with family incomes of $150,000 a year or more say they follow weather news very closely, as do about the same proportion of those with incomes of less than $30,000 (47%).

Crime news continues to attract much greater interest among African Americans than among whites. Half of blacks say they follow crime news very closely, compared with 23% of whites. And, unlike most news subjects, crime draws somewhat more interest among young people than among older Americans; 31% of those younger than 50 say they follow crime news very closely, compared with 24% of those 50 and older.

In general, the public’s news interests have changed little in recent years. There has been a slight increase in the proportion saying they follow news about political figures and events in Washington, from 17% in 2006 to 21% currently. Still, interest in this subject is a bit less than it was in 2004 and the same as in 2000.

Gender Gap in News Interests…

Figure

Men are particularly drawn to news about science and technology, sports, business and finance, international affairs, and Washington politics. For example, fully 71% of those who follow science and technology news very closely are men, while only 29% are women.

Women, on the other hand, make up a disproportionate share of the audiences for celebrity and entertainment news, health news and news about religion. Among those who follow health news very closely, 64% are women while 36% are men. In addition, women outnumber men among those who closely follow news about the weather, travel, culture, and community news.

And News Audiences

The gender differences in some news audiences reflect the disparities in men and women’s news interests. The audiences for several politically oriented radio and cable talk shows are largely male. Roughly seven-in-ten (72%) regular listeners of Rush Limbaugh’s radio are men, as are two-thirds of the regular viewers of Hannity & Colmes and The Daily Show (67%, 66%). In addition, 62% of those who regularly watch Hardball with Chris Matthews are men, as are 60% who watch Lou Dobbs. Men also make up more than half of the regular audiences for the O’Reilly Factor, The Colbert Report and Larry King Live.

Figure

Several print outlets also rely on men for their core readership. Business magazines, as well as magazines such as The New Yorker, The Atlantic and Harper’s Magazine, have readerships that are predominantly male.

Women outnumber men among those who regularly listen to religious radio; 69% of religious radio listeners are women, while just 31% are men. Network TV news outlets also draw in more women than men among their regular viewers. The disparity is particularly evident in the audience for morning news programs, such the Today show. Almost two-thirds of (65%) regular viewers of these programs are women while 35% are men.

Public’s Knowledge

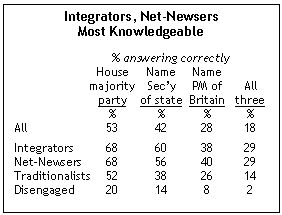
About half of Americans (53%) can correctly identify the Democrats as the party that has a majority in the U.S. House of Representatives. In February 2007, shortly after the Democrats gained control of the House after a dozen years of GOP rule, many more people (76%) knew the Democrats held the majority.

Figure

The public is less familiar with the secretary of state (Condoleezza Rice) and the prime minister of Great Britain (Gordon Brown). About four-in-ten (42%) can name Rice as the current secretary of state. The public’s ability to identify Rice has not changed much over recent years: In April 2006 and December 2004, shortly before she was sworn in, 43% could correctly identify her.

The prime minister of Great Britain is not well known among the public. Just more than a quarter (28%) can correctly identify Gordon Brown as the leader of Great Britain.

Overall, 18% of the public is able to correctly answer all three political knowledge questions, while a third (33%) do not know the answer to any of the questions.

Large majorities of college graduates know that Democrats have a majority in the House (71%) and named Rice as secretary of state (65%); however, slightly fewer than half of college graduates (47%) named Brown as the prime minister of Great Britain. Less educated people are less aware of these facts; among high school graduates, 45% knew that the Democrats have a majority in the House, 32% named Rice as secretary of state, and just 19% named Brown as the British prime minister.

People younger than 30 are less well informed on these questions than are older Americans, while women are somewhat less likely than men to be able to identify Rice, Brown and the majority party in the House of Representatives.

More Republicans than Democrats or independents know which party currently controls the House of Representatives: 64% of Republicans know that Democrats have a majority compared with 54% of Democrats and half of independents. Members of both parties struggle to identify Gordon Brown, while Republicans (48%) are slightly more likely than Democrats (41%) to know that Condoleezza Rice is the secretary of state.

Knowledgeable News Audiences

Figure

Regular readers of magazines such as The New Yorker, The Atlantic, and Harper’s Magazine stand out for their political knowledge; almost half (48%) can correctly identify Rice, Brown and the majority party in the U.S. House of Representatives. NPR listeners rank closely behind, with 44% of regular listeners registering a high knowledge score. More than four-in-ten regular Hardball (43%) and Hannity & Colmes (42%) viewers also score relatively high for political knowledge.

In general, well-educated news audiences have high levels of political knowledge; for instance, 54% of regular readers of publications such as The New Yorker, The Atlantic and Harper’s Magazine are college graduates, as are 54% of regular NPR listeners. However, a greater proportion of regular readers of business magazines are college graduates (60%), but just 36% answered all three political knowledge questions correctly.

Just a third of regular Rush Limbaugh listeners are college graduates, but this audience scored as well on political knowledge as did regular business magazine readers. Similarly, only about three-in-ten (31%) regular Hannity & Colmes listeners are college graduates, but a relatively large proportion (42%) answered all three questions correctly.

Some highly knowledgeable and attentive news audiences – such as The New Yorker’s, Limbaugh’s, Hannity & Colmes’ or Hardball’s – are older than average. However, age is not always a correlate of political knowledge: the CBS Evening News has one of the oldest audiences of the news outlets included on the survey; 63% of the regular viewers of this program are 50 or older. But just 10% of regular CBS News viewers correctly answered the three questions.

The Colbert Report and The Daily Show are notable for having relatively well-informed audiences that are younger than the national average: 34% of regular Colbert viewers answered the three political knowledge questions correctly, as did 30% of regular Daily Show viewers. Less than a quarter of either audience is older than 50 (22% Colbert, 23% Daily Show), compared with 41% of the general public.

A News Audience Segmentation

For this analysis, the public was divided into four segments based on their interest in news, their primary news sources, and how often they use the internet to get news. An overwhelming majority of people (82%) follow the news with some regularity. Just 14% in this survey are classified as Disengaged, as they expressed a general lack of interest in news.1

News audiences were divided into three primary news-consuming groups: Traditionalists, who use traditional media sources (TV, newspapers, radio) almost exclusively; Integrators, who identify a traditional medium as their main news source, but also go online for news several days a week; and Net-Newsers, who point to the web as their main source and use it frequently for news.

Traditionalists, the largest of the three news audience segments, also are the oldest (median age: 52) and the most economically downscale. Fewer than half have attended college and just 19% have graduated. Traditionalists have the lowest average income of the three groups; a relatively large proportion of Traditionalists (43%) are not employed.

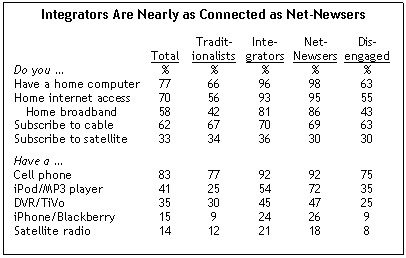
Politically, Traditionalists are more Democratic than most segments, but they also are more conservative than most other segments. Just 56% can access the internet from home; nearly all Integrators and Net-Newsers can log on from home. Traditionalists’ ownership of current technology also is relatively low (25% own iPods, 30% have DVRs). Yet their access to cable and satellite TV is on par with the other audience groups, which points to heavy use of television for entertainment as well as news.

Integrators (23% of the population) are much younger and more affluent than the Traditionalists (median age: 44). Politically, they are not much different than the public as a whole – 38% identify themselves as Democrats, 29% as Republicans, and 26% as independents. They are highly connected: 93% have internet access at home, 45% go online from work, and 24% have smart phones (iPhones/Blackberries).

Figure

Net-Newsers (13% of the population) are the most male group (58% male). They are highly educated, affluent and relatively young (median age: 35). Politically, Net-Newsers include the greatest share of independents (35%) of the three news audience segments. Notably, a relatively large proportion also describes themselves as liberal (24%).

Beyond their news consumption, Net-Newsers are significantly more active on the web than are the other news audience segments. Nearly half (46%) have social-networking profiles, and 59% are connected to the web while at work. Almost three-quarters (72%) own MP3 players, and they own other technologies at high rates.

Figure

Disengaged (14% of the population) are the least affluent (35% say their annual income is less than $30,000) and the least educated (69% have not attended college). More than six-in-ten of the Disengaged (61%) are women. They also are relatively uninterested in politics: 23% decline to describe themselves in political terms (as a Democrat, Republican or independent; similarly, 26% choose not to characterize themselves ideologically (as liberal, conservative, or moderate).

Time with the News

Figure

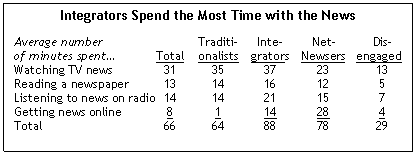
People who have incorporated the internet into their news diets – especially the Integrators – are heavier news consumers than are the Traditionalists. On a typical day, Integrators spend an average of 88 minutes on the news, compared with 78 minutes for Net-Newsers and 64 minutes for Traditionalists.

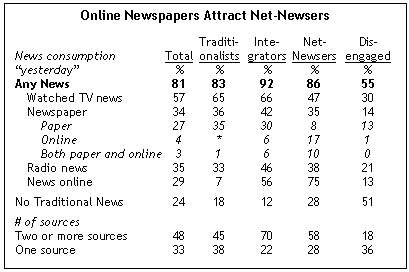
In other ways, Integrators stand out as the most avid news consumers of the three core audience segments. Integrators use all traditional sources at the highest rates, and a solid majority (56%) reports getting news online the previous day. For the Integrators, it is not just using the internet as well as traditional sources: they also spend more time watching TV news, reading the paper, and especially getting the news on the radio than either of the other core audience segments. Just 8% of Integrators get no news on a typical day, and most (70%) report getting news from two or more sources.

Figure

Net-Newsers are, first and foremost, online news consumers. Fully 75% get news online in a typical day. But their reliance on the web for news does not signal a wholesale rejection of traditional sources; almost as many (72%) say they used a traditional source yesterday, and their use of some traditional sources rivals that of other groups. In particular, Net-Newsers read newspapers at about the same rate as the Traditionalists and are slightly more likely to get radio news on a typical day.

However, even in their use of newspapers, the Net-Newsers’ preference for the web is apparent. While 35% reported reading a newspaper yesterday, as many as one quarter of the Net-Newsers who do read a paper either read only the online version or the print and online papers.

The Traditionalists are about as likely as the Integrators to watch TV news or read a newspaper on a typical day. But very few – just 7% – use the internet for news, despite the fact that most have home internet access. About twice as many of the Disengaged got news online on the previous day as did the Traditionalists (13% vs. 7%).

Regular News Sources

Figure

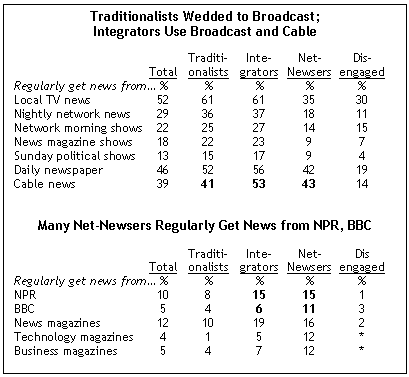
Broadcast news sources are popular with Traditionalists and Integrators, who are about equally likely to say they regularly watch local TV news, nightly network news and network morning shows. By contrast, just 35% of Net-Newsers say they regularly watch local TV news – a staple for 61% of Traditionalists and Integrators. And only about half the number of Net-Newsers tune into a nightly network news broadcast compared with Traditionalists or Integrators.

However, Net-Newsers are more inclined to use traditional media sources that are not scheduled in the same way as network and local TV news, such as newspapers and cable news. Cable news, in particular, is a relatively popular news source for this group: 43% watch regularly, about the same percentage as among the Traditionalists (41%).

In addition, there are a handful of specific news outlets – including NPR and the BBC – that Net-Newsers use at equal or greater rates than the Integrators. Fully 11% of Net-Newsers report that they regularly get news from the BBC (either through radio, television, or the internet), while just 6% of Integrators regularly get news from the BBC. The same proportion of Integrators and Net-Newsers (15%) regularly gets news from NPR.

Net-Newsers also read business (12%), technology (12%) and weekly news (16%) magazines at relatively high rates. The use of these types of sources is in line with this segment’s interest in science and technology news, business and financial news and international affairs.

Getting News Online

Net-Newsers’ use of online news sources equals – and in some cases surpasses -their use of traditional news media sources. Within this segment, 30% report that they regularly watch news programs or video clips online, which is significantly more than the number saying they regularly watch the nightly network news (18%).

Figure

News and political blog readership is also high among Net-Newsers–more than a quarter (26%) say that they regularly get news from blogs.

Further, this segment is more likely to engage in online news behaviors that require them to actively seek out news: 24% use a search engine to find news stories every day, 10% use news ranking sites, and more than a quarter (27%) report having sent news emails to friends or family in the previous week.

Many Integrators engage in these online news activities, but they do so at significantly lower rates than do the Net-Newsers. Integrators are about half as likely to watch (16% to 30%) or listen to (10% to 19%) news online and are much less likely than Net-Newsers to actively seek news online. However, nearly one-in-five Integrators (19%) regularly read blogs, which is only a slightly smaller proportion than among Net-Newsers (26%).

News During the Day

Figure

Integrators spend more time with the news overall, and they are more likely than the other audience segments to get news in the morning. Fully 84% of Integrators typically get news in the morning, while 76% get news during the course of the day, and nearly two-thirds get news around the dinner hour (65%) and late in the evening (64%).

Traditionalists are more likely to get news in the morning than at other times (74%), but six-in-ten get news during the day (61%), around the dinner hour (61%), and late in the evening (68%). By contrast, news consumption among Net-Newsers peaks during the day, when 82% say they get news, and declines to just half of that level (42%) around the dinner hour.

Figure

Net-Newsers show a clear preference for online news over television news in the morning and during the day. A majority of Net-Newsers (53%) who get news to start the day get it from the web, while just 33% turn to television. Additionally, 92% of those who get news during the day – which is the most popular time of day for Net-Newsers to get news – go online for it.

Even around the dinner hour and late in the evening – times when television news is the dominant source for other audience segments -significant minorities of Net-Newsers continue to rely on the internet (41% at the dinner hour and 47% late at night). However, during those times more Net-Newsers get news from television than online.

Integrators, by contrast, rely primarily on traditional sources throughout the day, as do the Traditionalists. Where Integrators differ is in their relatively extensive use of the internet for news during the day. Half of integrators who get news at that time go online, while 36% get news from television, and nearly as many (32%) get news from radio.

Check in vs. Appointment News

Figure

Distinct differences also are apparent in how the segments schedule news into life. A majority of Traditionalists (56%) and Integrators (53%) get their news at regular times; in contrast, only 20% of Net-Newsers say that their news consumption adheres to a regular schedule.

Nonetheless, nearly a third of all Integrators (32%) say they check in on the news several times a day, just slightly less than the proportion of Net-Newsers who say they do that (40%). By contrast, just 22% of Traditionalists say they check in on the news several times a day.

General News Interests

Figure

Nearly seven-in-ten Integrators (69%) say they follow national news most of the time and not only when important events occur. That compares with 63% of Net-Newsers and a smaller majority of Traditionalists (57%).

By contrast, traditionalists express more consistent interest in local news. Nearly three-quarters of Traditionalists (73%) follow local news closely most of the time; just 56% of Net-Newsers say the same.

All three core news audience segments express less interest in international news than in local or national news. Comparable percentages in each core group say they follow international news most of the time rather than just when important news occurs.

Interest in Specific News Topics

Figure

Integrators’ avid interest in the news is apparent in how closely they follow a variety of specific news topics. With the exception of weather news, Integrators match or exceed Traditionalists’ levels of interest in almost every subject included on the survey.

Integrators also follow a greater number of subjects – including community and local government news, and coverage of politics and Washington – than do Net-Newsers. By comparison, more Net-Newsers than Traditionalists follow news about culture and the arts, celebrity news, and coverage of science and technology.

For their part, Traditionalists express greater interest in several close-to-home news topics than they do in national politics or international affairs. While weather is a top news draw across audience segments, Traditionalists stand out for their strong interest in the weather; 58% follow weather news very closely. In addition, more Traditionalists say they follow community news very closely (27%) than say the same about news about politics and Washington (21%) or international news (16%).

Attitudes about the News

Figure

Integrators, by many measures the most avid consumers of news, are the most likely to hold positive attitudes about the news. About two-thirds of Integrators (68%) derive a great deal of enjoyment from keeping up with the news, and a similar proportion (66%) enjoy having news on in the background. Integrators also have the easiest time incorporating the news into their lives: Fully 77% say it is “pretty easy” to do so.

Majorities of all three core segments contend that they do not feel overloaded with the amount of news today. But this is particularly the case for Net-Newsers; 68% say they do not feel overloaded by the amount of news available today, compared with 60% of Integrators and 56% of Traditionalists.

Net-Newsers and Integrators are the most selective in their media use; 66% and 69%, respectively, say they trust some news media more than others. Traditionalists, by contrast, are more evenly split on this question, with 47% saying all the news media is pretty much the same. This is particularly notable given the great variety of sources that Net-Newsers and Integrators use.

Figure

Consistent with their greater reliance on newspapers, radio, and the internet, majorities of both Net-Newsers (58%) and Integrators (54%) say they prefer reading or hearing about the news to seeing pictures and video. By contrast, a majority of Traditionalists (51%) – the only segment that spends the majority of its news time with television news – express a preference for video or pictures.

Knowledge and Audience Segments

Figure

Integrators and Net-Newsers are the most politically knowledgeable of the audience segments. Greater proportions of these groups were able to correctly answer three knowledge questions than either the Traditionalists or the general public. As might be expected, the Disengaged fared considerably worse than the other groups in terms of political knowledge.

Comparable-sized majorities of Integrators and Net-Newsers know that Democrats have a majority in the House of Representatives (68% each), and that Condoleezza Rice is the Secretary of State (60% Integrators, 56% Net-Newsers). Smaller percentages in both groups could identify Gordon Brown as the Prime Minister of Great Britain (40% Net-Newsers, 38% Integrators). The same proportions of Integrators and Net-Newsers answered all three questions correctly (29%).

A majority of Traditionalists (52%) know that Democrats control the House, but far fewer could name Rice (38%) or Brown (26%). The Disengaged’s lack of interest in news is apparent in their news-related knowledge: few correctly answered any individual item, and just 2% could answer all three.

Media Credibility

The public continues to express skepticism about what they see, hear and read in the media. No major news outlet – whether broadcast or cable, print or online – stands out as particularly credible.

There has been little change in public perceptions of the credibility of most major news organizations between 2006 and 2008. Over the last 10 years, however, virtually every news organization or program has seen its credibility marks decline.

In 1998, for example, 42% of those who could rate CNN gave it the highest rating for credibility (four on a scale from one to four). That fell to 28% in 2006, and remains low in the current survey (30%). Credibility ratings for several other television news organizations – including the three major broadcast news outlets – also have declined since 1998. Comparable percentages say they can believe all or most of what NBC News (24%), ABC News (24%) and CBS News (22%) report (based on those who can rate those organizations).

Figure

Credibility ratings for the Fox News Channel have remained largely stable in recent years. Currently, 23% say they can believe all or most of what they hear from Fox, down slightly from 2006 and 2004 (25%).

About a quarter (27%) who can rate NPR give it the highest credibility rating, up five points since 2006. NPR is viewed as somewhat more credible today than in 1998 (27% vs. 19%).

The credibility ratings for local TV news also have gone up a bit since the last media consumption survey (from 23% to 28%). But a decade ago, 34% said what they saw and heard on their local TV news was highly credible.

Print Credibility Also Low

Figure

A quarter of those able to rate The Wall Street Journal give that newspaper the highest credibility marks. That is slightly more than say the same about their own daily paper (22%). The Journal also gets higher marks than The New York Times (18%) or USA Today (16%).

A decade ago, however, fully 41% gave the Journal the highest credibility ratings. The proportion of people who believe all or most of what they read in the Journal began to slip in 2002 and has stood at about one-in-four since 2004.

Ratings for the Times have been fairly consistent since 2004, the first year the newspaper was asked about. Ratings for USA Today are somewhat lower now than they were in 1998 or 2000 (23% then vs. 16% currently).

Figure

It should be noted that Americans view most traditional news sources – print, TV and radio – as at least somewhat credible, rating them at least three on the one-to-four scale. Notable exceptions are People magazine – only 28% of those who could rate it give it a rating of three or four – and the National Enquirer; just 14% give the supermarket tabloid a three or four.

Online News Sites

Online news outlets are viewed with more skepticism than their print, broadcast and cable counterparts. Of seven organizations evaluated, none is viewed as highly credible by even a quarter of online users able to rate them.

Figure

Only Google News and Yahoo News – which derive much of their content from traditional news organizations – receive positive marks for credibility by most users who could rate them. Six-in-ten give Google News a rating of three or four, but just 13% give Google News the highest rating for credibility. Nearly as many give Yahoo News a rating of three (46%) or four (11%). AOL News gets a rating of three or four from fewer than half of internet users who could rate it (46%).

Online magazines Slate and Salon do not fare as well. Among those who could rate them, just 31% give Slate a three or four credibility rating, while 28% offer such similar ratings for Salon. These ratings are based on a relatively small group able to rate these outlets: 70% of internet users could not rate Salon, and 67% could not evaluate Slate.

When asked about the Drudge Report, four-in-ten internet users who could rate it give it a believability rating of three or four. Slightly more than a third (35%) said the same about the Huffington Post. More than half of internet users could not rate the Drudge Report (56%) or the Huffington Post (59%).

Partisan Gap in Credibility Ratings

Figure

Democrats continue to give most news organizations much higher credibility ratings than do Republicans. When it comes to the British Broadcasting Corporation (BBC), for example, Democrats who can rate that organization are three times as likely as Republicans to give it the highest credibility rating. Far more Democrats than Republicans also give believability ratings of four to NPR, PBS’s NewsHour with Jim Lehrer, NBC News, and several other news organizations.

Republicans are substantially more likely to give the highest credibility rating to the Fox News Channel (34%) than are Democrats (19%). Fox ranks very low in credibility among Democrats; still, Fox’s ratings among Democrats are much higher than Republican ratings for The New York Times (10% give it a four) or BBC (9%).

Partisan differences in credibility ratings for news organizations have fluctuated in recent years. In 2004, for example, there was a 19-point gap between Democrats and Republicans when it came to CBS News. That dropped to 11 points in 2006 and 8 points this year. The gap for ABC News fell from 18 points in 2004 to 9 points in 2006 and remains at 9 points this year. Most of the narrowing of the difference has been driven by Democrats lowering their estimation of each network’s credibility.

By contrast, evaluations of The New York Times have become more divided. In 2006, 16% of Republicans gave the newspaper a top-credibility rating; that fell to 10% in the current survey. Democratic ratings for the Times have remained stable (23% top rating in 2006, 24% in 2008).

Figure

Similarly, the partisan gap in credibility ratings for Fox News has tripled since 2004. The proportion of Republicans giving Fox the highest marks for credibility have increased over the past four years (from 29% to 34%), while Democrats’ ratings have declined (from 24% to 19%).

Other Findings

In 1998, fewer than half of Americans said they had a home computer. Few logged on to the internet and if they did, they used a slow-moving dial-up modem. Today, far more people have access to high-speed internet connections in their homes than had a home computer a decade ago (58% vs. 43%).

This just one of the ways that new and evolving technologies are changing the way people get the news. Expanded use of high-speed computers and home broadband are opening the door to more and better quality news videos, which a third of Americans watch at least on an occasional basis.

The explosion in cell phone ownership since the mid-1990s has not had much of an impact on the public’s news consumption; relatively few get news using these phones. But the next generation of phones – iPhones and Blackberries – are now widely used for news. More than a third of smart phone owners (37%) get news from these devices.

In addition, a small minority of the rising number of owners of iPods and other MP3 players say they watch or listen to news podcasts on these devices. Nearly one-in-ten owners of iPods or MP3 players (8%) say they watch or listen to podcasts using these devices.

Cell Phone Growth Advances

Figure

Fully 83% of Americans say they have a cell phone, up from 74% two years ago. In 2000, only about half of Americans (53%) said they have a cell phone. The growth in cell phone use has occurred across all age categories – but the increase over the past two years has been particularly striking among those in their 70s.

Currently, 69% of those in their 70s say they have a cell phone, up from 55% in 2006; in 2000, only about a quarter of those in their 70s said they had a cell phone. Cell phone use among the youngest respondents also has increased markedly since 2006 (from 75% to 86%).

Smart Phone Users: More Connected

By comparison, the growth of smart phones has been far less impressive: 15% currently say they have a Blackberry, iPhone or similar device compared with 12% in 2006 and 14% in 2004. While the demographic profile of cell phone users has come to more closely resemble that of the general public, smart phone use remains dominated by the highly educated and well off.

Figure

Nearly four-in-ten (37%) of those with family incomes of at least $150,000 say they have smart phones, compared with fewer than half as many in lower income categories. A quarter of college graduates have smart phones; just 11% of those with no more than a high school education have an iPhone, Blackberry or similar phone.

Notably, far more owners of smart phones than cell phones use the devices to get the news; 37% of smart phone owners do this, compared with just 4% of cell phone owners. Owners of smart phones also stand out for their heavy news consumption, particularly news online. Roughly three-in-ten (31%) say they check in on the news several times a day, compared with 23% of cell phone users. And nearly half (45%) say they got any news online yesterday, while 29% of cell phone users got news from the web the previous day.

Needing the News for Work

Figure

Three-in-ten workers say that keeping up with the news is important for their job, which is little changed from 2006 (35%) and 2004 (31%). As in the past, highly educated and high-income workers are far more likely than those with less education and lower incomes to say that it is important for their job to keep up with the news.

Nearly half (47%) of workers with a post-graduate degree say that being up on the news is important for their job, more than double the percentage of those with no more than a high school education. More than four-in-ten workers (45%) with family incomes of at least $100,000 say following the news is important for work, compared with smaller percentages of those in lower income categories.

Figure

Workers who need to follow the news for work are heavier news consumers – and enjoy getting the news more – than workers for whom keeping up with the news as not an important part of their job. Those who need to keep up for their jobs are more likely to get news at various points throughout the day.

In addition, those with jobs that require them to stay current are somewhat more likely to use the web for news: 44% report going online for news every day, compared with a third (33%) of those who don’t follow the news for work. And 61% of workers who need to keep up with the news for their jobs say they enjoy getting the news a lot; that compares with just 45% of those for whom keeping up is not important.

About the Survey

Results for this survey are based on telephone interviews conducted under the direction of Princeton Survey Research Associates International among a nationwide sample of 3,615 adults, 18 years of age or older from April 30 to June 1, 2008 (2,802 respondents were interviewed on a landline telephone, and 813 were interviewed on a cell phone, including 269 who had no landline telephone). Both the landline and cell phone samples were provided by Survey Sampling International.

The combined landline and cell phone data were weighted using demographic weighting parameters derived from the March 2007 Census Bureau’s Current Population Survey, along with an estimate of current patterns of telephone status in the U.S. derived from the 2007 National Health Interview Survey, using an iterative technique that simultaneously balances the distributions of all weighting parameters. The weighting procedure also accounted for the fact that respondents with both landline and cell phones had a greater probability of being included in the sample.

The following table shows the error attributable to sampling that would be expected at the 95% level of confidence for different groups in the survey:

Figure

Results for May 2008 Political/Believability Survey reported in Section 7 are based on telephone interviews conducted under the direction of Princeton Survey Research Associates International among a nationwide sample of 1,505 adults, 18 years of age or older, from May 21-25, 2008. The following table shows the error attributable to sampling that would be expected at the 95% level of confidence for different groups in the survey.Note that each respondent was asked to rate the believability of only 15 of the 22 print and broadcast sources included in the survey.

Figure

In addition to sampling error, one should bear in mind that question wording and practical difficulties in conducting surveys can introduce error or bias into the findings of opinion polls.