Pew Research Center

FOR RELEASE JULY 10, 2008

Likely Rise in Voter Turnout Bodes Well for Democrats

McCain's Enthusiasm Gap, Obama's Unity Gap

FOR MEDIA OR OTHER INQUIRIES:

Communications Department
202.419.4372
www.pewresearch.org

RECOMMENDED CITATION

Pew Research Center, July 2008, "Likely Rise in Voter Turnout Bodes Well for Democrats"

About Pew Research Center

Pew Research Center is a nonpartisan, nonadvocacy fact tank that informs the public about the issues, attitudes and trends shaping the world. It does not take policy positions. The Center conducts public opinion polling, demographic research, computational social science research and other data-driven research. It studies politics and policy; news habits and media; the internet and technology; religion; race and ethnicity; international affairs; social, demographic and economic trends; science; research methodology and data science; and immigration and migration. Pew Research Center is a subsidiary of The Pew Charitable Trusts, its primary funder.

© Pew Research Center 2026

Table of contents

  • About Pew Research Center
  • Likely Rise in Voter Turnout Bodes Well for Democrats
  • Section 1: Campaign Interest and Engagement
  • Section 2: Evaluating the Candidates and Campaigns
  • Section 3: The Obama-McCain Matchup
  • Section 4: Views of the Candidates and the Issues
  • Section 5: Candidate Race, Age, Experience and Religion
  • Section 6: Party Affiliation and Congressional Ballot
  • About the Survey

Likely Rise in Voter Turnout Bodes Well for Democrats

McCain's Enthusiasm Gap, Obama's Unity Gap

Overview
The outlook for the presidential election at mid-year is substantially different than at comparable points in time in recent campaigns. First, turnout is likely to be higher this fall – perhaps much higher than in previous elections – as voter interest continues at record levels. Second, as has been the case since the start of the campaign, Democrats enjoy a substantial engagement advantage over Republicans that may significantly alter the composition of the November electorate.

Third, while there has been considerable debate about whether Hillary Clinton’s supporters will rally behind Barack Obama in the fall, it is clear that both candidates face formidable challenges in consolidating their bases. John McCain, the presumptive GOP nominee, has an enthusiasm problem. McCain engenders less strong support than does Obama and has much weaker support than George W. Bush did at this stage in his presidential campaigns.

While Obama draws more enthusiastic support, he has a unity problem. Clinton’s former supporters have moved in Obama’s direction since the primaries ended, but significant numbers remain undecided or say they might vote for McCain in the fall.

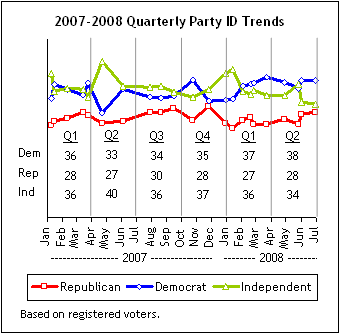
Finally, the middle of the electorate is reasserting itself in this election. There are more swing voters than there were at this point in the campaign four years ago. The proportion of self-proclaimed independents is up from 2004 and nearly half say they are uncertain about their vote choice.
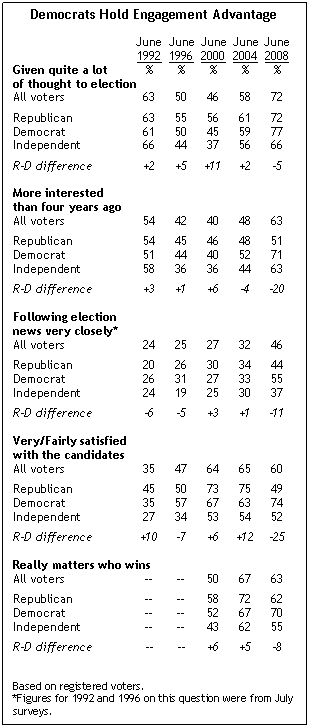
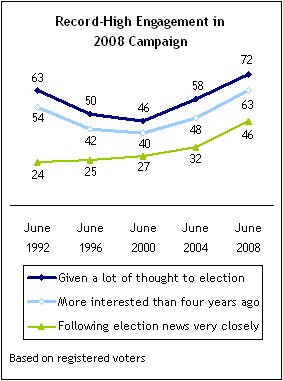
The latest national survey by the Pew Research Center for the People & the Press, conducted June 18-29 among 2,004 Americans, finds greater public interest and engagement in the presidential election than during the five previous campaigns. Fully 72% say they are giving quite a lot of thought to this election – by far the highest percentage at this point in the campaign since 1988. The proportion saying they are more interested in politics this year than during the previous campaign is greater than it has been since 1992. And public interest in campaign news has been consistently higher than in recent elections.

Compared with previous election cycles, voter engagement is up among all demographic groups, but has increased more among voters under age 50 than among older voters. Uncharacteristically, the youngest voters – those under age 30 – are at least as knowledgeable, and in some cases more knowledgeable, about candidates’ positions on Iraq and abortion than are older voters.

Strong and consistent interest and engagement suggests that voter turnout will likely be high in November, as it was during this year’s primaries. The new survey finds another potential parallel between the general election and the primaries: Democratic turnout could match or perhaps exceed Republican participation in November, just as it did in most states during the primaries.

Two unprecedented findings from the new survey support a potential Democratic turnout advantage. For the first time in Center polls conducted since 1992, a greater proportion of Democrats than Republicans are expressing strong interest in the campaign. Nearly eight-in-ten Democratic voters (77%) say they are giving a lot of thought to the election, up 18 points since June 2004. Republican engagement also has increased over this period (from 61% to 72%), but for the first time somewhat fewer GOP voters than Democrats say they are giving a lot of thought to the election.

There is an even larger gap in the percentage of voters in each party saying they are now more interested in politics than they were during the previous campaign. About seven-in-ten Democratic voters (71%) report they are more interested in politics than they were four years ago, compared with barely half of Republican voters (51%). As with other measures of political engagement, in the past there were no partisan differences or Republicans held the advantage.
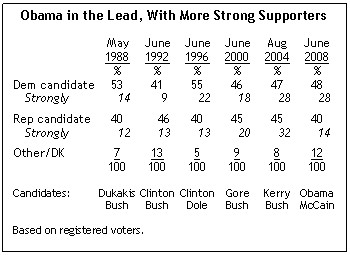
A second factor which may also contribute to a Democratic turnout advantage is that supporters of the Republican candidate, uncharacteristically, are less strongly committed to their choice than are supporters of the Democratic candidate. Overall, Obama leads McCain in the presidential horserace by 48% to 40%. Most voters who say they support Obama – 28% among the 48% – say they support him strongly. By contrast, only about a third of McCain’s backers say they support him strongly (14% of the 40%).

Throughout the 2004 campaign, Bush drew more strong than moderate support by margins of greater than two-to-one. Even in Bush’s first campaign, he consistently drew at least as much strong support as moderate support.

McCain is not getting as much strong support from conservatives and white evangelicals as Bush did in 2000 and 2004. While these groups support McCain over Obama by wide margins, they are doing so with less than their typical enthusiasm for GOP candidates.

There are other indications that Democrats are more enthusiastic about the election than are Republicans. Far more Democratic voters than Republican voters express satisfaction with the field of candidates (74% vs. 49%). Republican voters’ satisfaction with the candidates is now not much higher than it was in June 1996, during Bob Dole’s unsuccessful campaign (50% satisfied). In addition, 33% of Republican voters say it is hard to choose between the candidates because neither would make a good president; just 21% of Democratic voters express this view.

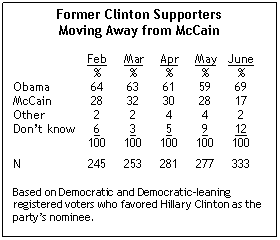
A positive note for the Republicans is that McCain is now winning the support of 79% of those who supported his former Republican rivals. By contrast, just 69% of former Clinton supporters say they now back Obama. The putative Democratic candidate is attracting more Clinton supporters than earlier in the campaign (59% in May). However, as many as three-in-ten former Clinton supporters now say they will vote for McCain (17%), vote for someone else (2%) or are undecided (12%).

More Swing Voters Than in ’04
Overall, McCain and Obama draw identical proportions of their own party’s voters – 82% of Republicans support McCain while the same percentage of Democrats backs Obama. Independents remain evenly split, as was the case in late May; 42% support Obama while 41% support McCain.

Compared with four years ago, a much greater share of independents are either undecided or say they might change their minds between now and the election. Nearly half of independents (46%) are undecided or may change their minds, up from 28% in June 2004.

At this stage, Obama is running better among voters under age 50 than either Kerry or Al Gore, the previous Democratic nominees. Yet Obama trails McCain by seven points (44% to 37%) among voters ages 65 and older; four years ago, Kerry led Bush by 12 points among these voters. Obama also is trailing McCain slightly among white Catholics, a key swing group that was evenly divided at this stage four years ago but that ultimately voted Republican.

Issues and Candidate Traits

The survey finds new evidence that rising energy prices are reshaping the campaign’s issues agenda. As in April, more voters want the candidates to discuss the economy than any other issue. However, about as many voters now say they want the candidates to address energy and gas prices as the war in Iraq (17% energy vs. 19% Iraq). And energy has far surpassed health care as an issue that voters want the candidates to discuss.

Obama continues to lead McCain by a wide margin as the candidate better able to improve economic conditions (51% to 31%). McCain’s strengths continue to be in foreign policy and national security: by 55% to 31%, more voters say McCain could better defend the country against terrorism and, by a more modest 47%-41% edge, say he is the candidate better able to make wise decisions about Iraq.

Voters see the candidates’ personal strengths and weaknesses in starkly different terms. Fully 74% of voters, including a solid majority of McCain supporters (58%), say that Obama rather than McCain “has new ideas.” McCain holds about a two-to-one advantage in views of which candidate is “personally qualified to be president” (55% to 27%). In previous campaigns, voters’ assessments of the candidates’ traits were more evenly balanced.

An analysis of the survey indicates that highly conservative views on race continue to be an important correlate of lack of support for Obama. In fact, it appears to be somewhat more of a correlate of choice in the general election than it was during the nomination contests.

Nonetheless, Obama’s support level among working class whites is comparable to that for Gore and Kerry, even though he struggled with this group in the primaries, and they express relatively conservative views on race in this poll. But Obama is not getting as much support as did his two predecessors from another conservative voting bloc – older white voters.

While conservative views on race continue to be a correlate of lack of support for Obama, the candidate’s lack of experience is the voters’ biggest qualm about him. Fully 40% of those who do not support Obama cite his experience as what they like least about him; at this stage during the previous two campaigns, fewer than one-in-ten voters pointed to Kerry and Gore’s experience as a negative.

In this regard, nearly twice as many voters believe the fact that Obama is new to national politics will hurt him in the election as say that the fact that he is African American will hurt him (42% vs. 22%). But even more voters (51%) say that the fact that McCain is 71-years-old will hurt his chances this fall.

Other findings

  • A majority of voters (55%) give Obama a grade of A or B for convincing them to vote for him. That is a higher grade than for any Democratic or Republican candidate in the past three campaigns. By contrast, just 32% give McCain a grade of A or B.
  • A small but stable minority of voters (12%) of voters believe that Obama is a Muslim. That is about the same percentage that said Obama was a Muslim in March (10%).
  • Most Democratic and Democratic-leaning women voters (60%) want Obama to choose Hillary Clinton as his running mate. But voters who supported Obama in the Democratic primaries remain cool to this idea.
  • A quarter of liberal Democrats say they have contributed money to a presidential candidate in the past year, about double the proportion of conservative Republicans who have donated (13%).
  • Democrats who favored Clinton for the nomination remain critical of Obama. Just 35% say he is more personally qualified than McCain to be president; former Clinton supporters are split as to whether McCain or Obama could better deal with terrorist threats.
  • Conservative Republican voters are decidedly less optimistic about their party’s chances in the fall than they were just a few months ago. Just 49% say McCain is mostly likely to win, down from 71% in April.

Section 1: Campaign Interest and Engagement

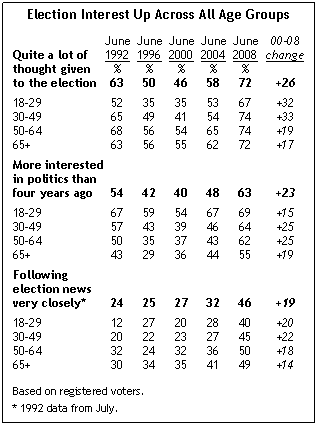
If current levels of voter engagement and interest in the 2008 campaign are any measure, the 2008 election could have historically high levels of voter turnout. Fully 72% of registered voters say they have given “quite a lot of thought” to the coming presidential election. In June 2004, 58% expressed a comparable level of engagement, which at the time represented the highest June engagement since the previous peak of 63% in 1992.

Similarly, 63% of voters say they are “more interested in politics this year” than they were in 2004. In June of 2004 just 48% expressed this view, and only 40% said the same in June 2000. Interest in campaign news also is at a record high – eight-in-ten are following news about the campaign either very closely (46%) or fairly closely (34%). Four years ago, just 32% were following very closely, and in 2000 the comparable figure was 27%.

By nearly every measure, the 2000 election represented a low in voter engagement. In June of that year, just 46% said they had given quite a lot of thought to the coming election, while nearly as many (43%) said they had given “only a little thought” to the choice ahead of them. Similarly, the share of voters who were giving little or no attention to campaign news was double what it is today (38% in June 2000 vs. 19% today).

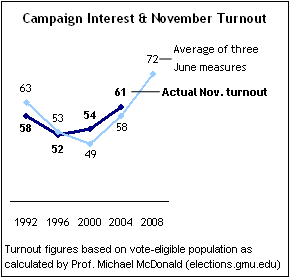
While the election is still four months away, these indicators of voter engagement taken in June of each election year provide a useful, though imperfect, preview of overall turnout levels on Election Day. A simple average of these three measures taken in June of each election year tracks fairly closely with actual turnout levels as a percent of the eligible voting population. If this correlation were to continue, overall turnout could be substantially higher in 2008 than the already high levels of 2004.

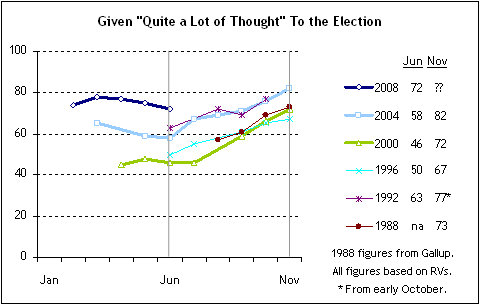
Voter engagement typically increases substantially between June and Election Day as the campaign gains increased media and public attention. For example, in June 2004, 58% of voters said they had given quite a lot of thought to the election, but by the weekend before Election Day this figure rose to 82%.

With 72% of voters already giving a lot of thought to the election this year, voter engagement is on a record pace. In fact, the current level of engagement is already as high as it was on the eve of Election Day in 2000 and 1988, and is five points higher than in the election weekend survey of 1996. In other words, by this and other measures voter engagement is already as high as it was at the end of three of the last five election cycles, and if history is any guide, is likely to only get stronger between now and November.

Democratic Engagement Increases

Engagement is up across the board this election cycle, but the increase is far greater among Democrats than among Republicans. For the first time since Pew began tracking these election measures in 1992, Democratic engagement in the 2008 election cycle is higher than Republican engagement across all three key measures. Slightly more Democrats than Republicans have given quite a lot of thought to the election (77% vs. 72%); Democrats are more likely than Republicans to say their interest in politics is greater than four years ago (71% vs. 51%); and Democrats are following campaign news more closely than are Republicans (55% vs. 44% “very closely”). In June 2004, there was no more than a three-point difference between Democrats and Republicans on any of these measures.

While the partisan differences this year may reflect the particular nature of the primary season – with a highly competitive and historic Democratic primary contest garnering the bulk of media and public attention – there are no signs that the partisan gap in engagement is waning with the primaries over and attention turning to the general election.

Since the first stages of the primary campaigns in early 2007, Democrats have consistently followed campaign news more closely than have Republicans, and if anything the gap is widening as the focus turns to the general election season. The weekly News Interest Index survey has tracked public attention in 72 weeks of the campaign, and when the data is compiled into monthly averages, the consistent gap in interest across partisan lines is apparent. From February through December of 2007, Democrats were, on average, seven-points more likely than Republicans to be following campaign news very closely.

Interest in campaign news spiked in the early part of 2008, peaking in February around Super Tuesday. Since McCain sewed up the GOP nomination, Republican interest in campaign news dropped off substantially, while Democratic interest has remained notably high. And even after Barack Obama clinched the Democratic nomination on June 3 and Hillary Clinton conceded on June 7, Democratic interest has remained far higher than Republican interest. In the last three weeks of June, the share of Democrats following campaign news very closely has exceeded the share of Republicans by 16 points. In fact, Republican interest is no higher than interest among political independents, who typically pay the least attention to week-to-week political news.

Youth Engagement Rises Most

Attentiveness to the 2008 campaign is registering at record highs across all age groups, but the rise is more substantial among younger voters. The gap between the number of younger and older voters who have given “quite a lot of thought” to the election is smaller than it has ever been in the June election year surveys, and the share of 18-29 year olds who are following campaign news “very closely” is double what it was in June of 2000.

But it is not only the very youngest voters who are tuning in at remarkably high rates this year. The gains in attentiveness are greater among voters younger than 50. In June 2000, 39% of voters younger than 50 had given a lot of thought to the campaign, compared with 54% of those 50 and older – a 15-point gap. Today, the gap is just 3 points, as 71% of those younger than 50 and 74% of those 50 and older have given a lot of thought to the campaign. Similarly, as the percentage following campaign news very closely has virtually doubled among those younger than 50 (from 22% in 2000 to 43% today) it has gone up by 17 points (from 33% to 50%) among those 50 and older.

Younger voters have always been more likely to say they are more interested in politics today than they were four years ago – reflecting the fact that for most this is only the first or second presidential election in which they have participated. By contrast, in every election from 1992 to 2004 most voters age 50 and over said they were no more interested in politics than they had been during the previous election. Once again, 2008 stands out in contrast, with a clear majority of voters of all ages saying they are more interested in politics this year.

Religion, Race and Turnout

One factor in the 2000 and 2004 elections that benefited George W. Bush was a notably high level of engagement among white evangelical Protestants in both years, who favored Bush by overwhelming margins. But the differential in engagement across religious groups is far less noticeable in 2008 compared with the past two cycles.

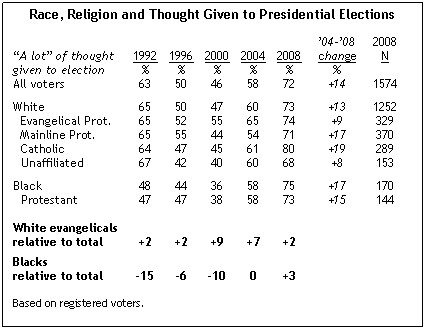
In 2000 and 2004, white evangelicals were giving substantially more thought to the election than other voters, and while they, like voters overall, are even more engaged in the 2008 election, the gains have been smaller and the gap between evangelicals and others is no longer substantial. Currently 74% of white evangelical Protestants have given a lot of thought to the election, up nine points from June of 2004. But among white mainline Protestants the gain is 17 points (from 54% to 71%) and among white Catholics it is 19 points (61% to 80%).

There is also no gap between the level of engagement of blacks and whites in this election cycle. Fully 75% of African American voters say they have given a lot of thought to this election, as have 73% of whites. There also was no difference in this measure of engagement in June 2004 (58% of blacks and 60% of whites), but in previous election cycles black voters expressed less interest in the elections than did white voters.

2008 Campaign Viewed as More Interesting

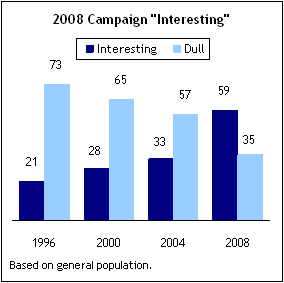
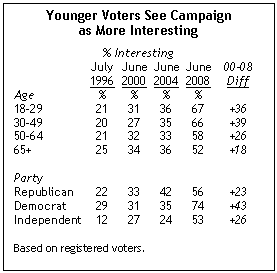
When asked if the presidential election campaign overall is “interesting” or “dull” the majority of Americans in each of the three election cycles prior to this year said the latter. But the 2008 election stands apart in this regard, with 59% of Americans currently describing the campaign as interesting, and just 35% as dull.

The 2008 campaign was not always so interesting to people: Throughout 2007, most described the presidential campaign as dull rather than interesting. But in February of this year, fully 70% said the 2008 election was interesting rather than dull. Currently, 59% describe the election as interesting.

While majorities of both Democratic and Republican voters rate the 2008 campaign as interesting (and majorities of both groups in 2000 and 2004 said it was “dull”) the gap in Republican and Democratic perceptions has never been this large, with fully 74% of Democratic voters describing the campaign as interesting compared with 56% of Republican voters. Moreover, even 53% of independent voters think the campaign is interesting, about double the proportion saying this in 2000 and 2004.

Younger voters are substantially more likely than older voters to describe the campaign as interesting. Two-thirds of voters younger than 50 (66%) say the campaign is interesting, compared with 56% of those 50 and older. In each of the three preceding election cycles there was no difference in evaluations by age.

Opinions on Civic Engagement Unchanged

While levels of campaign interest and enthusiasm are far higher than in recent elections, voters’ attitudes about voting and the relevance of national politics are far more stable. In fact, four long-standing measures of civic engagement and participation are virtually identical to the comparable point in 2000.

More than nine-in-ten voters (95%) agree that it is their duty as a citizen to always vote, unchanged from 2000, and the percent who completely agree with this statement is virtually unchanged. Voters also are just as likely as in 2000 to report feeling guilty about not voting. Seven-in-ten voters (69%) say they feel guilty when they don’t get a chance to vote, about the same percentage as eight years ago (67%).

Nearly half (46%) of voters say they are generally bored by what goes on in Washington, little changed from 2000 (49%). Similarly, there has been no change in the number of voters who say that most issues discussed in Washington don’t affect them personally: 28% feel this way now, compared with 29% in 2000.

Voter Registration Rates

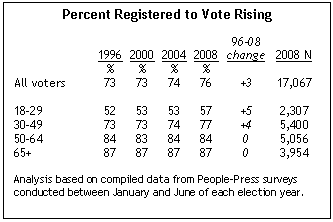
Roughly three-quarters of survey respondents say they are “absolutely certain” they are registered to vote in their precinct or election district. The share of Americans saying they are registered has risen slightly over the past 12 years, from 73% in 1996 and 2000 to 76% today, based on compiled data from all People-Press surveys conducted in the first half of each election year. The gains in registration are most notable among younger Americans – a five-point increase from 52% to 57% among those ages 18-29, and a four-point increase from 73% to 77% among those ages 30-49. There has been no shift in the already high registration rates of Americans age 50 and older.

Campaign Contributions

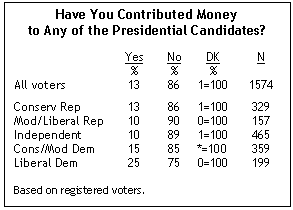
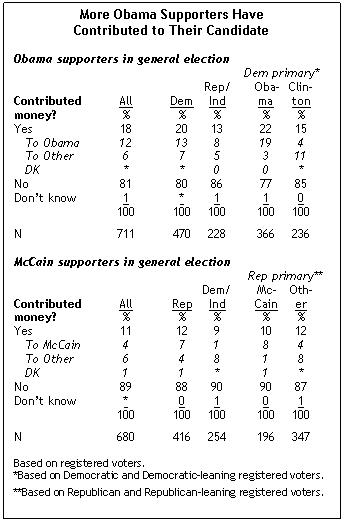
Nearly one-in-eight voters (13%) say they have contributed money to a presidential candidate over the past year. Democrats – particularly liberal Democrats – are the most likely to say they have made a contribution during this election cycle.

Nearly one-in-five Democrats (18%) have given money, compared with 12% of Republicans and 10% of independents. Fully one-quarter of liberal Democrats have contributed to a campaign in the past 12 months.

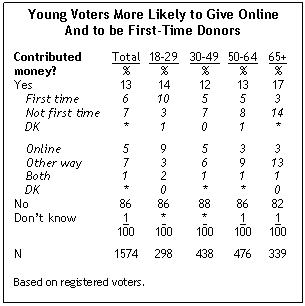
Nearly half of voters who have contributed to a presidential candidate since the beginning of the primaries, or 6% of all voters, say they are first-time donors. Young voters are especially likely to have given money for the first time. One-in-ten voters younger than 30 made a contribution for the first time this election cycle; just 3% say they have donated money to campaigns in previous cycles as well as in the past 12 months. By contrast, 14% of voters 65 and older have given money in the past, in addition to donating to candidates in 2008 election, and 3% are first-time donors.

Young voters also are considerably more likely than older voters to have contributed money online. More than one-in-ten voters younger than 30 (11%) used the internet to make donations to presidential candidates in the past year, while 6% of voters ages 30-49 and even fewer voters 50 or older (4%) contributed online.

Obama’s Donor Advantage

Obama supporters are three times as likely as McCain supporters to say they have given money to their candidate of choice (12% vs. 4%), and this advantage is evident across all income categories. About one-in-six Obama supporters with family incomes of $75,000 or more have made a contribution to the Obama campaign (16%), but just 6% of McCain supporters with comparable incomes have donated to the Republican candidate. And while 8% of Obama supporters with incomes of less than $30,000 have given money to the Illinois senator (8%), just 1% of McCain supporters in the same income bracket have made a contribution to their candidate.

About one-in-eight Democratic voters (13%) who say they are voting for Obama in the fall have given money to their party’s presumptive nominee; 7% of Republicans who support McCain have given money to his campaign.

Among Republicans and independents who say they will vote for Obama in November, 8% have contributed to his campaign while 5% have contributed to a different candidate. On the other hand, Democrats and independents who support McCain are much more likely to have contributed to somebody other than the Arizona senator. Just 1% made contributions to the McCain campaign and 8% made contributions to another candidate.

Democratic and Democratic-leaning voters who favored Obama over Hillary Clinton in the Democratic primary are among the most likely to have given money to the Obama campaign so far (19%). By contrast, 8% of Republican and Republican-leaning voters who preferred McCain over one of his primary opponents have donated to his campaign.

Section 2: Evaluating the Candidates and Campaigns

Despite their high levels of interest and engagement, the proportion of voters who express satisfaction with the choice of presidential candidates this year is no greater than it has been in the past two elections. Overall, six-in-ten voters say they are either very satisfied (19%) or fairly satisfied (41%) with the field of likely presidential candidates this year. This is down slightly from 2004 when 65% were very or fairly satisfied with the choices.

This decline is mostly driven by Republican discontent with the candidates. Democratic satisfaction is the highest it has been over the past five election cycles: fully 74% of Democratic voters say they are very or fairly satisfied with the candidates, up 10 points from 2004. The share of Republicans who are satisfied stands at 49% – down 26 points from 75% in 2004 – while half say they are not too or not at all satisfied. As with many measures of interest and engagement, the gap between Republican and Democratic satisfaction with the field is larger than it has ever been in June election polling.

African American voters stand out as being especially enthusiastic with this year’s field: fully 86% of African-Americans are satisfied with the candidates, including a 53% majority who say they are “very satisfied.” Just 56% of all white voters are satisfied with the presidential field, though white Democrats are much more likely than white Republicans to say they are happy with the choices for president (70% vs. 48%).

Satisfaction with the candidates among white evangelical Protestant voters is down 28 points, from 72% in 2004. Currently, 44% of white evangelical Protestants say they are satisfied with the choices, while a solid majority (55%) says they are not satisfied. Young Americans are about as satisfied with the candidates this election cycle as they were in 2004; voters ages 50 and older are far less satisfied. Again, partisanship is a factor as 65% of Democrats ages 50 and older are happy with their choices (up from 58% in 2004) compared with 45% of Republicans in this age group.

Obama Getting Better Grades

Voters give much higher marks to Obama’s presidential election campaign than they do to McCain’s. A solid majority (56%) give the Obama campaign letter grades of A or B for the job he is doing to convince the American public to vote for him, while only 32% say the same of the McCain campaign. More than a third (35%) offer a grade of C to McCain’s campaign so far, and nearly as many (30%) say the campaign has earned a D or F.

The grades voters give to the Obama campaign for the job it is doing convincing them to vote for him are the highest measured for any candidate over the past four election cycles. In June 2004, for example, just 39% gave Bush’s efforts an A or B; even fewer gave high grades to Kerry’s campaign (31%).

In contrast, McCain’s middling grades are slightly lower than those awarded to Bush in both 2000 and 2004. McCain’s campaign does garner higher grades than the 1996 Dole campaign, which only 22% graded highly.

In this regard, the 2008 campaign has the largest disparity in high grades for the Democratic and Republican candidates over the past four election cycles (24 points). The gap between the grades for Obama and McCain is even larger than for Bill Clinton and Bob Dole in July 1996; at that time, 37% gave Clinton an A or B, while just 22% gave top grades to Dole.

The differences in the ratings of the two presidential campaigns are reflected in the opinions of their partisans. Nearly eight-in-ten Democratic voters (79%) give the Obama campaign letter grades of A or B for the job he is doing to convince the American public to vote for him, and a smaller majority of Republican voters (54%) give high marks to the McCain campaign. More independents give A or B grades to the Obama campaign than to the McCain campaign (49% v. 31%). In addition, while more than a third of Republicans (35%) give high grades to Obama, just 16% of Democrats give high grades to McCain.

Few Say Candidates Are Too Negative

Relatively few voters think either Barack Obama or John McCain has been too critical of his presidential rival so far in the campaign. Roughly one-in-five voters (19%) say Obama has been too personally critical of McCain, while 73% say he has not. Slightly more (26%) say McCain has been too personally critical of Obama, while 65% say he has not. At this stage in the campaign four years ago, far more voters believed both candidates were too negative: 44% said Kerry was too personally critical of Bush, while 33% said Bush was too critical of his rival.

Currently, more Democrats than Republicans say their party’s candidate has been treated too critically. Nearly four-in-ten Democrats (38%) say McCain has been too personally critical of Obama, compared with 25% of Republicans who say that Obama has been too critical of McCain. In June 2004, by contrast, 64% of Republicans said that Kerry was too critical of Bush, while 47% of Democrats said Bush was too critical of Kerry. Fewer than one-in-four independent voters accuse Obama (22%) or McCain (24%) of going too far in personal attacks.

While solid majorities of white voters think neither McCain nor Obama has been too personally critical of the other, nearly half of black voters (47%) say that McCain has gone too far in this respect. By comparison, just 14% of blacks say Obama has been too critical of McCain.

Candidate Visibility and Press Coverage

Even as the 2008 election season has shifted gears to the general election matchup, Barack Obama continues to dominate both media coverage and public attention. According to the latest weekly content analysis of major media coverage by the Project for Excellence in Journalism, Obama has been featured in 60% or more of news stories about the campaign in most weeks since February, while in most weeks fewer than half of campaign stories covered McCain.

This gap has narrowed since Obama clinched the Democratic nomination, but even over the past month Obama has continued to receive more press coverage than McCain. In the latest week of content analysis (June 30-July 6), 62% of campaign news stories included substantial coverage of McCain. This is the highest proportion for McCain for the entire year, and still lags the share of stories covering Obama by 11 points.

Despite rising media coverage of McCain since the end of the Democratic primaries, he remains far less visible to the public than does Obama. When voters are asked which candidate they have “heard the most about in the news in the last week or so,” Obama remains far and away the more visible candidate. In the latest Pew Research Center weekly News Interest Index survey conducted July 3-7, fully 71% volunteered Obama as the candidate they have been hearing the most about. Just 11% named McCain.

If anything, the gap between Obama and McCain’s overall visibility has widened since the end of the Democratic primaries. As Hillary Clinton has faded from the scene, Obama stands out even more as the most prominent figure in the 2008 election.

Stark Contrast Between Obama and McCain

Considerably more voters now say the presidential candidates take different positions on the issues than was the case in recent elections. Fully three-quarters think McCain and Obama generally take different stances; 68% of voters saw differences between Bush and Kerry in June 2004, while only about half (51%) saw differences between Bush and Gore in June 2000. Supporters of Obama and McCain agree that the candidates take different positions (76% of Obama supporters, 79% of McCain supporters).

But Obama supporters are more likely than McCain supporters to say that the election this fall really matters. Seven-in-ten Obama supporters say it really matters who wins the 2008 presidential election, compared with 59% of McCain supporters. In June 2004, Bush and Kerry supporters were about as likely to say it really mattered who won the election (70% of Bush and 68% of Kerry supporters), as were Bush and Gore supporters in 2000 (54% of Bush and 51% of Gore supporters).

Overall, voters are somewhat less likely to think the election matters than they were four years ago (63% today vs. 67% in June 2004). This drop is driven by conservative Republicans and, to a lesser extent, independents. About six-in-ten conservative Republican voters (63%) now say it really matters who wins the election in the fall; four years ago, nearly eight-in-ten (79%) said it really mattered.

Views on a Third Party

A majority of voters (56%) say the country should have a third major political party in addition to the Democrats and Republicans, while 39% it should not. Voters were more divided four years ago; in June 2004, 49% agreed that the country should have a third major party and 45% disagreed.

Not surprisingly, independents stand out in their desire for a major third political party. More than seven-in-ten independents (72%) say the country should have a third political party, far greater than the percentage of Republicans (53%) and Democrats (47%) who say the same.

Young voters ages 18-29 also express strong support for a third major political party (65%), while older Americans over the age of 65 are among the least likely to agree that there should be another major party (37%). Black and white voters also express different opinions about the prospect for a third major political party. Nearly six-in-ten whites (58%) agree that the country should have another major party, while considerably fewer African Americans share this view (36%).

Few Would Cast Vote of No Confidence

There has been no increase in the proportion of voters who say they would refuse to vote for any of the candidates running for office – a vote of no confidence – if that option was available on their ballot. When asked whether they would cast a vote “no confidence” in the candidates, about a third of voters (34%) said it is either very likely (14%) or possibly likely (20%) that they would vote this way. A majority of voters (64%) continue to say it is not at all likely that they would vote “no confidence,” little changed from four years ago and up nine points from 2000.

Independent voters are more likely than other groups to say they might cast a vote of no confidence. Nearly half of political independents (49%) say it is either very (20%) or possibly (29%) likely that they would vote no confidence in all of the candidates running for office; only about a quarter of Republicans (25%) and Democrats (28%) say they would consider doing so.

A greater proportion of young voters also raise the possibility of voting no confidence on their ballot: 40% of 18-29-year-olds say this compared with 32% of those ages 30 and older.

Income and educational levels also affect attitudes toward a vote of no confidence in all of the candidates running for office: 42% of those with a high school degree or less would consider voting no confidence compared with under a quarter (24%) of college graduates. By a similar margin, those earning less than $30,000 a year are more likely than those making over $100,000 a year to say they would be at least possibly likely to vote no confidence (41% and 23%, respectively).

Knowledge of the Candidates’ Position on Key Issues

The survey probed knowledge on two topics that have been central to the candidates’ messages: whether or not there should be a timetable for when U.S. troops will be withdrawn from Iraq, and whether access to abortion should be restricted in most cases or remain available to women in most instances.

Slightly more than half of voters (52%) say that Obama is pro-choice, while one-in-ten erroneously say he is pro-life. Slightly fewer voters – 45% – correctly describe McCain as pro-life, while 17% incorrectly characterize his position as pro-choice. Sizable minorities say they do not know where Obama or McCain stands on the issue (38% each).

More voters are aware of the candidates’ positions on the subject of a timetable for troop withdrawals from Iraq: 76% correctly say that Obama supports a timetable, and 62% correctly say that McCain opposes a timetable.

As is typical in tests of political knowledge, college graduates are more knowledgeable than other groups of voters. Men are more knowledgeable than women about the candidates’ positions on a timetable for Iraq troop withdrawals, but not on the candidates’ positions on abortion. Blacks are less knowledgeable than whites about where McCain stands on abortion, but are about as knowledgeable as whites on Obama’s position on this issue and on both candidates’ positions on a timetable for troop withdrawals.

One pattern that differs from previous surveys of political knowledge is that younger voters are significantly more knowledgeable about the candidates’ positions than are older voters. For example, 60% of voters 18-29 correctly say that Obama is pro-choice, compared with just 51% of those ages 50-64 and just 41% of those ages 65 and older.

Section 3: The Obama-McCain Matchup

In the national matchup among registered voters, Obama leads McCain by eight points, 48% to 40%, which is slightly larger than Obama’s lead in late May (47% to 44%). Obama is doing about as well among most demographic groups as Kerry and Gore were doing at this stage four and eight years ago, respectively. The major exception is younger voters: Obama has larger leads among voters under age 30, as well as those ages 30 to 49, than either Kerry or Gore.

Obama and McCain receive comparable levels of support from voters in their own parties (82% each), and are roughly even among independents (42% for Obama, 41% for McCain). Obama’s advantage is a result of the fact that Democrats outnumber Republicans among registered voters (37% to 26%) in the poll.

Obama holds a big lead among voters under age 30 (56% to 36%), the least affluent (59% to 29% among those with family incomes under $30,000), as well as African Americans (90% to 3%), and the religiously unaffiliated (67% to 24%).

Since May, Obama has increased his advantage among women voters; currently, he leads McCain among women by 51% to 37%; in May, his lead was only five points (47% to 42%). Men are divided, 45% for Obama, 44% for McCain.

McCain holds an eight-point lead (48% to 40%) among white voters overall, a result of his 17-point advantage among white men; among white women, the candidates are tied (43% each). Eight years ago, Bush led Gore in June by nine points among white voters; in 2004, Bush led Kerry by 15 points among this group.

Among white voters who have not attended college, McCain holds a modest 45% to 39% lead. Bush led Gore by a comparable margin in June 2000 (48% to 42%), and held a wider advantage over Kerry among non-college whites four years ago (53% to 41%).

White evangelical Protestants favor McCain over Obama by a margin of 61% to 25%, a smaller advantage than in May this year when his lead was 71% to 20%. Among white mainline Protestants, McCain leads Obama 53% to 39%. He also has a 46%-40% edge among white non-Hispanic Catholics. White Catholics were more evenly divided at this stage in the elections of four and eight years ago.

Most Back McCain Only Moderately

In addition to trailing Obama by eight points overall, McCain also receives far less strong backing from his supporters. Of the 40% who favor McCain over Obama this fall, barely a third (14% of voters overall) say they support him strongly. Nearly twice as many (26% of voters overall) say they back McCain “only moderately.” By comparison, most of Obama’s backers describe themselves as strong supporters (28% of voters overall), while 19% of voters nationwide say they are only moderate supporters of Obama.

The disparity in strong support for the two candidates this year is the largest measured in the past two decades. Among all registered voters, twice as many describe themselves as strong Obama backers than call themselves strong McCain backers (28% vs. 14%).

Four years ago, Bush had a slight edge over Kerry in strong support (32% vs. 28%), though both men drew more strong backing than moderate backing. In June 2000, fewer than half of both Bush’s and Gore’s backers said they supported their candidate strongly. The last election that exhibited a substantial intensity gap at this point of the campaign was 1996; though neither candidate garnered a great deal of strong support, more backed Clinton strongly (22%) than Bob Dole (13%).

The intensity of support for Obama at this stage of the campaign is identical to how voters felt about Kerry in August 2004. But McCain’s standing is a stark contrast to the intensity of support for Bush four years ago, when the vast majority of Bush’s voters said they backed him strongly. And in June 2000, 20% of voters backed Bush strongly, compared with 14% for McCain today.

The strength of support for McCain is more comparable to early feelings among Dole’s supporters in June 1996 and George H.W. Bush’s supporters in the early stages of the 1992 and 1988 campaigns. In all three cases, twice as many backers said they were only moderate supporters as said they backed the candidates strongly.

Key GOP Groups Lack Strong Commitment

The lack of strong support for McCain is particularly notable within the Republican base. While just over eight-in-ten (82%) Republicans support McCain over Obama, only about a third (35%) says they are strong McCain supporters. Four years ago, nearly three-quarters of Republicans (73%) described themselves as strong supporters of George W. Bush, and in 2000 47% backed Bush strongly.

McCain fails to draw a great deal of strong support from any segment of the GOP base. Fewer than four-in-ten conservative Republicans and moderate and liberal Republicans support McCain strongly (36% and 34%, respectively). Similarly, just 35% of weekly churchgoers, and an identical percentage of those who attend less frequently, say they support McCain strongly. In August 2004, Bush attracted strong support from substantial majorities in each of these groups. Looking back to the 2000 campaign, McCain runs about slightly better among moderate and liberal Republicans than Bush did in June of that year, but he lags well behind in terms of strong support from conservatives. In June 2000, 58% of conservative Republicans said they backed Bush strongly; today just 36% offer the same level of support to McCain.

Obama’s Strong Support

A majority (55%) of Democratic voters strongly support Obama, a much greater proportion than the share of Republicans who back McCain strongly (35%). However, among Democrats, there are sizable differences in the intensity of support for Obama across some demographic groups.

Obama attracts considerably more strong support among African American Democrats than among white Democrats; nearly eight-in-ten black Democratic voters (77%) say they support Obama strongly, compared with fewer than half of white Democrats (47%). In August 2004, Kerry also drew more strong support among black Democrats than among whites, but the gap was much smaller than it currently is for Obama (65% of black Democrats vs. 56% of white Democrats).

A solid majority of Democrats under age 50 (61%) strongly backs Obama; far fewer older Democratic voters (48%) say they support him strongly. This also marks a significant difference from the pattern of Kerry’s support four years ago, and Gore’s in 2000. Both candidates drew more strong support among older Democratic voters than among younger Democrats.

Liberal Democrats strongly support Obama at higher rates than do conservative and moderate Democrats (68% vs. 50%). That was also the case for Kerry in August 2004, as well as for Gore in 2000, though Gore drew less strong support from both groups than either Kerry or Obama.

Primary Political Fallout

The vast majority of Republican and Republican-leaning voters who backed another candidate during the primaries now support McCain in the general election horserace. In fact, about the same proportion of GOP voters who did not prefer him in the primaries as those who did now support McCain (84% vs. 82%).

Obama, on the other hand, draws much less support from former Clinton supporters than he does among Democratic and Democratic-leaning voters who backed him for the nomination. Just 69% of former Clinton supporters support Obama in the general election; 17% support McCain and 14% say they don’t know or volunteer someone else. Obama wins the support of virtually all the Democrats who favored him for the nomination (91%).

On balance, more former Clinton backers support Obama only moderately than support him strongly (39% vs. 30%). But McCain has even lower levels of strong support from Republicans who favored another candidate for the nomination; just a quarter of this group supports McCain strongly, compared with 57% who support him only moderately.

In a similar vein, only about half of GOP and Republican-leaning voters (47%) – including just 35% of Republicans who backed someone other than McCain for the nomination – say they are satisfied with the quality of candidates this year. Nearly three-quarters of Democratic and Democratic-leaning voters (72%) – including a solid majority of former Clinton supporters (58%) – say they are satisfied with their presidential choices.

More Republican voters than Democratic voters also agree that it is difficult to choose between Obama and Clinton because neither would make a good president (37% vs. 24%). A relatively large minority of former Clinton supporters (37%) believes neither candidate would make a good president, but an even larger proportion of GOP voters who did not back McCain for the nomination subscribes to this sentiment (45%).

Views of Obama-Clinton Ticket

More than half of Democratic and Democratic-leaning voters (55%) would like Obama to name Hillary Clinton his running mate. The proportion favoring this pairing has changed little since March, when 59% held that view; in May, 53% said they would like to see Obama choose Clinton.

Those who supported Clinton in the primaries remain far more enthusiastic about the joint-ticket idea – 78% back it – than those who supported Obama in the primaries. Just 37% of them think Obama should make Clinton his vice presidential pick, while 59% say he should not. There is virtually no change in the two groups’ opinions on this question since May.

Democratic and Democratic-leaning women voters – who were a key segment of Clinton’s base – are more likely than Democratic men to want to see Clinton on the ticket (60% versus 49%). This does not vary substantively across age groups. Democratic voters with the lowest household incomes also are more likely to favor having Clinton as the vice presidential candidate than are their better off counterparts.

Most Democratic voters who have completed college – a group that tended to favor Obama in the primaries – oppose Obama choosing Clinton as his running mate (54% say no, 39% say yes). Democratic voters with less education are much more supportive of the idea: About six-in-ten Democratic voters with either some college education (64%) or no more than a high school education (60%) would like Clinton to be Obama’s running mate.

Nearly two-thirds of conservative Democratic voters (65%) say they would like to see Obama choose Clinton as his vice presidential candidate. That compares with 53% of moderate Democrats and half of liberal Democrats.

Impact of Obama-Clinton Ticket

More than six-in-ten voters (62%) who say they supported Clinton for the Democratic nomination say her presence on the ticket would make them more likely to vote for Obama. This sentiment is equally strong among the majority of former Clinton supporters who already back Obama (69% favor him over McCain) as it is among the minority who either favor McCain or are undecided. As such, the greater benefit for Obama might come in reinforcing support among former Clinton supporters rather than bringing in those who are disaffected.

But putting Clinton on the ticket also has potential downsides. Among all registered voters, opinion is divided over how Clinton’s presence on the ticket would affect their votes. Almost half (49%) say that it would make no difference to their vote if Obama picked Clinton; 26% say that if Obama picked Clinton, they would be less likely to vote for him; another 23% say they would be more likely to vote for him if he made that choice.

Among swing voters, 28% say they would be more likely to vote for Obama if he ran with Clinton, while a third (33%) say they would be less likely to vote for Obama if he took Clinton as his running mate. Another 35% say it would not matter.

Fewer See McCain Winning

Far fewer voters believe that McCain will win the election than predicted a McCain victory in April. Currently, 53% say Obama is most likely to win, compared with 27% who say McCain. In April, 47% expected an Obama victory, while 42% said McCain was most likely to prevail. The proportion who declined to offer a prediction has nearly doubled, from 11% to 20%, since April.

McCain’s own supporters – and Republican voters more generally – are far less optimistic about his chances than they were just two months ago. Only about half of McCain supporters (49%) say he is most likely to win; in April, 69% said he was most likely to prevail in the fall. Conservative Republicans also are less confident about McCain’s prospects than they were in April: 49% now say he is more likely to win, compared with 70% then.

By greater than two-to-one (54% to 24%), more independents say Obama, rather than McCain, is more likely to win the November election. Independents were more evenly divided in April (46% Obama vs. 43% McCain).

Democratic voters are even more confident of victory in the fall than they were in April. Just 15% say McCain is most likely to win, down from 27% in April. The proportion of Democratic voters expecting an Obama victory has risen modestly, from 65% to 70%, since then.

One-in-three are ‘Swing Voters’

A third of registered voters this year indicate that they are undecided or say they might change their mind about their vote choice, which is larger than the size of the swing vote in 2004 (21%) and nearly equal to the size of the swing vote eight years ago (32% vs. 33% today). These so-called swing voters are divided into three roughly equal groups: those who only lean to McCain or who say there is some chance they will vote for Obama (11% of the total); those who lean to Obama but say there is some chance they will vote for McCain (10%); and the completely undecided (12% who refused to lean one way or the other).

Certain Obama voters — those who say there is no chance they’ll vote for McCain — outnumber certain McCain voters by 38% to 29%. This nine-point advantage in certain support is much higher than either party’s nominee has enjoyed over the past five presidential election cycles. In 2004, 2000, and 1992, the voters certain about their choice divided evenly between the Republican and Democratic candidates. In July 1996, Democratic incumbent Bill Clinton had a five-point advantage in certain support over his Republican opponent, Bob Dole.

The larger swing vote now compared with four years ago is a result of greater Republican uncertainty as well as the large number of independents who have yet to settle on a candidate.

About a quarter of conservative Republicans (24%) are now classified as swing voters, which is much greater than the percentage of conservative Republican swing voters in both 2004 and 2000 (6% and 14%, respectively). Moderate and liberal Republicans are much more uncertain about their vote choice: 43% are classified as swing voters, compared with 26% four years ago, and 30% eight years ago.

Independents also are much less settled now than in 2004, though their level of uncertainty is comparable to that seen in 2000. This year, 46% are classified as swing voters, compared with 45% eight years and just 28% in 2004. Among conservative and moderate Democrats, 27% are currently not certain, similar to the 30% in 2000 and slightly higher than in 2004 (when 23% were swing voters). Just 14% of liberal Democrats are not certain about their vote, which is about the same as in June 2004 (17%), and slightly less than in 2000 (23%).

Swing Voters’ Attitudes

Demographically, the swing voters are not markedly different from the rest of the electorate. In terms of gender, age, income, marital status, and other personal characteristics, they closely match other voters. They are somewhat less educated than certain McCain voters or c ertain Obama voters. In terms of partisanship they split evenly (27% each) between Democrat and Republican. On the issues of abortion, gay marriage, the war in Iraq, and drilling in the Arctic National Wildlife Refuge, their views mirror those of the public as a whole.

With respect to evaluations of the candidates, swing voters favor McCain on some attributes and Obama on the others. For example, a narrow majority (52%) says Obama is the candidate better able to connect well with ordinary Americans, and 55% choose Obama as the candidate who is more personally likeable.

But an even larger majority (58%) says McCain is the candidate most likely to use good judgment in a crisis, and more – though not a majority – say McCain is the candidate who shares their values (37% say this about McCain, 25% Obama).

Section 4: Views of the Candidates and the Issues

Voters have starkly different impressions of the two candidates, and these are reflected in evaluations of their personal qualities. Fully 74% say the phrase “has new ideas” better describes Obama, while just 12% say it better describes McCain.

Obama’s advantage in personal likability is nearly as large: more than three times as many voters see Obama, rather than McCain, as personally likable (64% vs. 18%). Obama also holds better than a two-to-one advantage as the candidate who “connects well with ordinary Americans” (58% vs. 26% for McCain).

Half of voters see McCain as “a typical politician,” compared with 30% who say that phrase better describes Obama. Obama holds smaller, six-point leads as the candidate who “shares my values” and “can get things done.”

McCain’s greatest advantage is on being perceived as “personally qualified to be president;” by approximately two-to-one (55% to 27%), more voters say this phrase better describes McCain than Obama. In addition, 47% say the phrase “would use good judgment in a crisis” better describes McCain, compared with 38% who say it better fits Obama.

McCain holds a slight edge in opinions about which candidate is “willing to take a stand, even if it’s unpopular” (44% vs. 41% for Obama). There is virtually no difference in voters’ perceptions of which candidate is more honest: 37% say the phrase “honest and truthful” better describes McCain, while 36% say it better describes Obama.

Perceptions of the candidates’ honesty were similar at about this point in the 2004 campaign, with 36% saying that John Kerry was honest and truthful and 34% saying that phrase better described George Bush. In May 2004, comparable percentages also viewed both Bush and Kerry as personally likable (42% Bush vs. 39% Kerry).

At that time, Bush held a wide lead as the candidate willing to take a stand even if unpopular (by 65% to 23%). He also held about the same lead as McCain does currently as the candidate who “would use good judgment in a crisis” (47% to 35%).

In June 2000, somewhat more voters said Bush had new ideas than said that about Al Gore (by 38% to 32%). Bush led Gore by 14 points as the candidate described as willing to take an unpopular stand, but for the most part voters viewed Bush and Gore in similar ways.

Supporters’ Views of the Candidates

Supporters of McCain and Obama generally believe that positive phrases better describe their candidate rather than his opponent. Virtually all of McCain’s supporters view him as more personally qualified than Obama and better in a crisis, while large majorities also see him as more honest, more willing to take a stand, and better able to get things done.

But there are some notable exceptions to this pattern. A solid majority of McCain supporters (58%) say the phrase “has new ideas” better describes Obama than McCain. By 45% to 34%, more McCain supporters view Obama as personally likable than say that about the Arizona Republican. And a sizable minority (32%) says the negative descriptor “a typical politician” better describes McCain, though somewhat more (43%) say it describes Obama.

Perceptions of Obama among his supporters are more uniformly positive. However, a smaller majority of Obama supporters views him as more personally qualified to be president than say that other positive phrases describe him; 55% say Obama is more personally qualified to be president, 28% choose McCain, and 10% say both candidates are qualified to do the job.

Obama is viewed much more critically by Democratic and Democratic-leaning voters who say they supported Hillary Clinton in the Democratic primaries. More than four-in-ten (43%) say McCain is more personally qualified to be president, compared with 35% who say that phrase better describes Obama.

In addition, fewer than half of former Clinton supporters (44%) view Obama as more honest and truthful. Just 24% say that McCain is more honest and truthful, but a relatively large minority (20%) says neither candidate particularly embodies this attribute. Modest majorities of former Clinton supporters say that Obama would be more likely to use good judgment in a crisis (55%); is more willing to take a stand, even if unpopular (53%); and is better able to get things done (52%).

Issues Key for Obama

When asked what they like most about Obama, more than half of his supporters (55%) cite his stand on issues, while far fewer point to his leadership (22%), personality (11%), and experience (3%).

Issues were also the main strength for Kerry and Gore among their supporters. But far more mentioned those candidates’ experience as what they liked most about them than say that about Obama. Roughly three-in-ten Gore’s supporters (29%) pointed to his experience in June 2000, as did 16% of Kerry’s backers four years later.

Experience is a far greater strength for McCain that it was for Bush during his campaigns. Nearly half of McCain’s supporters (47%) say his experience if what they most like about him; just 11% cited Bush’s experience in June 2000, while 4% cited his experience in 2004.

By contrast, issues are much less of a positive factor for McCain’s supporters than they were for Bush’s. Fewer than a quarter of McCain’s supporters (23%) cite his stance on issues as what they like most. In June 2004, 49% cited Bush’s stance on issues, and during his first run for the White House, issues were an even bigger factor for Bush (50%).

Candidate Weaknesses

Voters who do not support a candidate typically cite their stance on issues as what they like least about them. Pluralities of those who did not support Bush cited his stance on issues both in 2000 and 2004; similarly, those who did not support Bush’s Democratic rivals pointed to issues as what they liked least about them.

Obama is an exception in this regard. About as many voters who do not support him cite his experience as his stance on issues as to what they like least about him (40% experience, 38% stand on issues).

McCain’s stand on issues is by far the biggest negative cited by voters who do not support him. About two-thirds (66%) say McCain’s stand on issues is what they like least about him, far more than the proportion saying that about any recent candidate, Democrat or Republican.

Energy Rivals Iraq as Campaign Issue

The economy continues to overshadow other issues in the minds of voters. However, a growin g number cites energy as the issue they most want to hear the candidates discuss. The proportion of voters naming energy, gas or a related issue has more than doubled since April – from 7% to 17%. Last November, just 2% volunteered energy as the issue they most wanted the candidates to address.

About as many voters now mention energy as a top issue as cite the war in Iraq (19%) as the one issue they most want the candidates to discuss. The proportion of voters citing the war as the single issue they want the candidates to address has fallen from 32% last November to 19% in the current survey.

Health care also has lost ground as an issue among voters. Just 9% point to health care as the single issue they want the candidates to discuss, less than half the percentage that cited it last November (22%).

Iraq Less Important to Republicans

Fully twice as many Republican voters cite energy as the issue they want the candidates to talk about than cite Iraq (20% vs. 10%). That represents a dramatic shift since April, when 19% mentioned Iraq and just 9% said they wanted to hear about energy.

Energy is an increasingly important issue among Democrats as well; nonetheless, far more Democratic voters point to the war in Iraq as the single issue they want the candidates to discuss than cite energy (26% vs. 14%). However, energy has supplanted health care as the third-rated issue among Democrats. In April, 18% of Democrats mentioned health care, while 6% cited energy and gas; currently, slightly more want the candidates to discuss energy than health care (14% vs. 11%).

Obama Still Leads on Economy

Opinions about whether Obama or McCain could do a better job on most issues have changed only modestly over the past few months. Obama continues to hold a wide lead as the candidate better able to improve economic conditions (51% vs. 31% for McCain). That is comparable to Obama’s advantage in May and April.

Obama has gained as the candidate better able to deal with taxes. He currently leads 47% to 36% on this issue; in late May, slightly more voters preferred McCain on taxes than Obama (44% to 39%).

McCain continues to lead by a wide margin as the candidate better able to defend the country from a terrorist attack. A majority (55%) says he would do the better job on terrorism, compared with 31% who chose Obama. McCain also leads by a much narrower margin as the candidate better able to make wise decisions on Iraq (47% to 41%).

Obama’s strength on domestic issues – and his relative weakness on foreign policy and national security issues – is reflected in the opinions of former Clinton supporters regarding which candidate could better handle major issues. By wide margins, former Clinton supporters say Obama is better able than McCain to handle taxes, the economy and reducing the influence of lobbyists.

Notably, as many former Clinton supporters say McCain could do better in dealing with terrorism as choose Obama (40% each). A majority of former Clinton supporters (55%) say Obama would do better in making wise decisions about Iraq, but nearly three-in-ten (28%) say McCain would do better. Republican and Republican-leaning voters who supported another GOP candidate in the primaries have about the same views on the candidates and the issues as do those who favored McCain for the nomination.

McCain and Bush’s Policies

Voters continue to be divided about whether McCain would take the country in a new direction or rather would pursue the policies of the Bush administration. Currently, 46% say McCain, if elected, would continue Bush’s policies while 42% say he would take the country in a different direction. These opinions have changed little since March.

By more than three-to-one (65% to 19%), Republicans say that McCain will move the country in a different direction if he is elected. Democrats by a slightly greater margin (71% to 22%) say McCain will largely follow Bush’s policies. As was the case in May, a modest plurality of independents (46%) say that McCain will take the country in a new direction, compared with 40% who believe he will pursue Bush’s policies.

Section 5: Candidate Race, Age, Experience and Religion

Potential Candidate Weaknesses

Barack Obama’s relative inexperience in national politics is seen by more voters as having a negative effect on his candidacy than his race. Roughly four-in-ten voters (42%) say Obama will be hurt by the fact that he is new to national politics; just 22% believe he will be hurt by the fact that he is African American. As many voters say Obama will be helped by his race as say it will hurt him; 49% say it will not make a difference to voters.

An even greater proportion of voters (51%) say that McCain will be hurt by the fact that he is 71-years-old. Just 5% believe McCain’s age will help him while 42% say it will not make a difference.

African American voters are somewhat more likely than white voters to say that Obama’s race will hurt him (28% vs. 20%). But the demographic and political differences in opinions about the potential impact of Obama’s race are quite modest compared with views about Obama’s lack of experience in national politics.

Fully twice as many white voters as black voters say the fact that Obama is new to national politics will hurt him (46% vs. 23%). A majority of Republicans (56%) see Obama’s lack of experience as a hindrance compared with 38% of independents and 36% of Democrats.

There is greater agreement that McCain’s age will hurt him. Nearly identical percentages of Democrats (52%), Republicans (50%) and independents believe that McCain’s age will hurt him with voters in the fall.

McCain’s Age

A relatively small minority of voters (21%) say they feel McCain is too old to be president. The proportion saying McCain, who will turn 72 in August, is too old to be president has declined slightly since February (from 26%). About three-quarters of voters (76%) say he is not too old to lead the nation.

Notably, fewer voters ages 65 and older say that they believe McCain is too old to be president. Among these voters, the proportion saying McCain is too old has declined almost by half since February, from 30% to 18%. Views among younger people about whether McCain is too old to be president have been more stable.

Fewer Republican and independent voters also express concern about McCain’s age. Four months ago, 14% of GOP voters said McCain was too old for the presidency; the figure has been cut in half (7%). In late February, 27% of independents said the Arizona senator was too old for the White House; that has dropped to 19%. There has been virtually no change of opinion among Democratic voters; about a third (34%) considers McCain too old to be president, the same as in late February (33%).

Importance of Race to Vote Choice

Exit polls in several Democratic primaries found significant numbers of white voters saying that race was a consideration in their choice between Obama and Clinton, and these voters were less likely to pick Obama. As in the Democratic primaries, most voters (63%) say that the race of the candidates will not be a consideration in their own voting decisions. But about a third (34%) say the candidates’ race will either be the single most important factor in their vote (12%), or one of several important factors (22%).

Nearly half of African Americans (48%) say the race of the candidates will be an important consideration, with 20% saying it will be the single most important factor in their vote. Only about a third of whites (31%) say race will be an important consideration, with 11% saying it will be most important. Among African-Americans, there is little difference in likely vote choice between those who say race will be important and those who say it won’t be. Both groups overwhelmingly favor Obama

Unlike the primaries, white voters who say race will be important are somewhat more likely to say they will vote for Obama than those who say race won’t be important. But here party matters: white Republicans who say race will matter are more likely to vote for Obama than other Republicans. But among white Democrats – especially the older and less educated – those who say race will matter are less likely to support Obama. On balance, support for Obama is greater among white voters who say that the candidates’ race will be an important factor in their vote than among whites who say it is not important. Obama leads McCain 48% to 42% among white voters who view the race of the candidate as an important factor; he trails McCain 51% to 36% among those who say race will not be a consideration. But this overall result masks a somewhat different pattern when Democratic and Republican voters are examined separately.

Among white Republicans and Republican-leaning independents, large majorities support McCain over Obama regardless of their views on the importance of race. White Republicans and leaners who say race will be an important factor favor McCain over Obama by a margin of 78% to 17%. Among those who say race will not be important, McCain’s advantage is slightly larger, 84% to 7%.

The pattern is reversed among white Democrats and Democratic-leaning voters. Those who say race will be an important factor in their vote are slightly more likely to say they will vote for McCain in the fall; among this group, 74% favor Obama and 17% will vote for McCain. Among Democrats and leaners who say race is not important, 79% will vote for Obama and just 11% will vote for McCain.

The likelihood among Democrats of defecting to McCain is greatest among older and less affluent white voters. Among those ages 50 and older, 24% who say race is important support McCain over Obama. Among those in this age group who say race is not important, just 12% support McCain. For younger white Democrats, the view that race is an important consideration to their vote is unrelated to the choice between candidates.

Similarly, among white Democrats and leaners with family incomes under $50,000 who say race is important, 22% plan to vote for McCain. Among voters in this group who say that race is not important, 12% say they will vote for McCain. Among those with higher incomes, there is little difference in vote preference by answers to the question about whether race will matter.

More Say Obama Shares Blacks’ Values

An increasing proportion of voters believe that Obama shares the values and interests of black people in the United States. Currently, 41% say he shares the interests and values of blacks “a lot,” while 37% say he shares blacks’ interests “some.” In September 2007, 29% said Obama shared African Americans’ interests and values a lot, and 35% said he shared those interests some.

The proportion of African Americans who see Obama as sharing the values and interests of blacks has grown substantially since last fall. Currently, nearly two-thirds (65%) of black voters believe that the presumptive Democratic nominee shares blacks’ values and interests a lot. This reflects an increase of 21 points since September 2007, when fewer than half (44%) of black voters expressed this view. More whites also now see the Democratic candidate as sharing these values, although the change has been more modest (37% now say “a lot” compared with 27% in September).

Among whites, older voters, as well as those who are less educated and those who live in rural areas are more likely than others to say that Obama shares the interests and values of blacks a lot. Notably, more than four-in-ten white voters (42%) over age 50 now see Obama sharing the values of blacks a great deal, up from 28% last September. Among white voters ages 18 to 49, the increase has been smaller (from 26% to 31%). White voters who say Obama shares black values “a lot” are no different in their presidential preferences than those who do not hold this view.

Attitudes about Race and the General Election

In general, the survey finds that white voters who hold racially conservative views are more likely to support McCain. Fully 62% of white voters who agree that “we have gone too far in pushing equal rights in this country” support McCain; in contrast, just 24% of white voters who agree with this statement support Obama.

Similarly, white voters who disagree with the statement “I think it’s all right for blacks and whites to date” support McCain by greater than two-to-one (60% to 26%). McCain and Obama run about even among the much larger group of white voters who agree that interracial dating is acceptable (45% McCain vs. 43% Obama). White voters who see the growing variety of ethnic and racial groups in the United States as bad for the country also support McCain over Obama (by 57% to 28%); white voters who see this trend positively are evenly divided.

There are substantial partisan and ideological differences in attitudes on these issues. Yet there also are differences within the two parties. Obama draws much greater support among white Democratic and Democratic-leaning independent voters who disagree that equal rights have been pushed too far than among those who agree with this idea (84% vs. 59%). By contrast, McCain runs slightly better among white Republicans and Republican-leaning independent voters who agree that equal rights have been pushed too far than among those who disagree (88% vs. 80%). Multiple regression analyses that take into account demographics confirm these findings: white voters with conservative racial attitudes are considerably less likely to vote for Obama than are those with more liberal attitudes, and the impact of holding these conservative racial attitudes is greater among Democrats and independents than among Republicans. The influence of these attitudes on vote choice currently is somewhat greater than it was during the Democratic primary campaign.

Racial Attitudes: Party and Ideology

Attitudes about race and ethnic diversity differ significantly across the electorate. As has traditionally been the case, these key political values are associated with ideology and partisanship. On the whole, the Democratic electorate is more socially and politically liberal on these issues, while the Republican electorate is more conservative. However, there are ideological differences within the parties, particularly among Democrats.

Among white voters, nearly all (88%) liberal Democrats disagree with the statement that “we have gone too far in pushing equal rights in this country.” On the other end of the spectrum, conservative Republicans are more evenly divided on the question (46% disagree, 49% agree).

Liberal Democrats stand apart from all other white groups on the two other values. Fully 85% completely agree that it’s “all right for whites and blacks to date each other,” and just 4% of this group finds interracial dating unacceptable. By contrast, smaller percentages of white Republicans — 52% of conservative Republicans and 49% of moderate/liberal Republicans — and white conservative and moderate Democrats (54%) completely agree with the statement.

Similarly, opinions on the increasing variety of ethnic and racial groups in the United States differ little among Republicans and conservative/moderate Democrats. Roughly two-thirds of each group believes that growing diversity is a good or very good thing. By contrast, nearly nine-in-ten (89%) white liberal Democrats take the view that growing ethnic and racial variety is good for the country.

While these attitudes are linked to partisanship and ideology, there also are clear generational and educational differences. Younger and more educated white voters hold significantly more racially liberal beliefs than do older whites and those with less education.

On interracial dating, equal rights, and racial and ethnic diversity, younger white voters consistently hold more liberal views than white voters over 50. The same is true of voters who have attended college; more than three-quarters (77%) of whom believe that increasing ethnic variety is good for the country. By contrast, 61% of those who have not attended college hold the same view.

Who Thinks Obama is Muslim?

Overall, 12% of voters say that Obama is Muslim, a proportion virtually unchanged from March (10%). A majority of voters (57%) say, correctly, that Obama is Christian, while a quarter respond that they do not know Obama’s religion.

Six-in-ten Democrats now identify Obama as Christian, up eight-points from March. The gain is most substantial among conservative and moderate Democrats, 55% of whom now say Obama is Christian, up from 42% in March. Yet they still lag behind the proportion of liberal Democrats (74%) who can correctly identify Obama’s religion.

Overall, roughly comparable proportions of Republicans (55%), Democrats (60%) and independents (59%) correctly identify Obama as Christian. At the same time, comparable proportions of Republican voters (12%), Democratic voters (12%) and independent voters (11%) misidentify Obama as Muslim.

Nearly one-in-five white evangelical Protestant voters (19%) believe that Obama is Muslim, which is greater than the proportion of white mainline Protestants (11%) and white Catholics (9%) who believe this.

White voters are more likely to think Obama is Muslim (12%) than are black voters (5%). And white, working-class voters are among the most likely to think Obama is Muslim and among the least likely to think he is Christian. Among white voters with no more than a high school education and a family income of $50,000 or less, 16% say Obama is Muslim, while just 37% say he is Christian.

Section 6: Party Affiliation and Congressional Ballot

Growing Democratic Party ID Advantage

The Democratic Party’s advantage in party identification among voters nationwide has continued to grow in the first half of 2008. Among all the registered voters interviewed by the Pew Research Center from January through June of this year, 37% identify themselves as Democrats, the highest annual average in 20 years. Meanwhile, just 28% say they are Republicans which, coupled with the 2007 average, is the lowest in more than 16 years. The nine-point Democratic advantage in party identification represents a substantial shift from the 2004 election cycle, when Democrats outnumbered Republicans by just two percentage points (35% to 33%).

The share of voters who identify as independents or offer no partisan preference is also greater this year than in most recent elections.

Currently, 35% do not identify with either of the political parties, up from 32% four years ago. The last time independent identification was this high was in 1992, when Ross Perot ran a fairly successful third party campaign.

More recently, however, the proportion of Americans who reject party labels has declined. In 2007, 37% of voters called themselves independent or expressed no partisan preference. This has fallen to 35% for the first six months of 2008, and the downward trend is even more apparent when the data is analyzed more closely. Over the past three months, just 34% of voters have identified as independents, down from 36% in the first three months of the year, and from 40% in the comparable second quarter of 2007.

Race for Congress

Asked whom they’d support for Congress in their districts, voters choose the Democratic candidate over the Republican candidate by a wide margin. More than half of voters (52%) say they would vote for the Democratic candidate, compared with 37% who would support the Republican.

Democrats hold substantial advantages among voters in several key groups, including women (22 points), those under age 30 (22 points) and Catholics (16 points). Independents, who are about evenly divided in their presidential preferences, favor the Democratic candidate in their district by 10 points.

Republican candidates hold about a two-to-one lead among white evangelical Protestants (59% to 28%), but most other groups are divided or favor Democratic candidates by wide margins. Democrats hold a slight edge among voters ages 65 and older (46% to 42%), and much wider advantages among voters in other age groups.

Voters are divided over whether the issue of which party controls Congress affects their vote for Congress: slightly more than half (51%) say no, while 44% say yes. This split has been fairly consistent since at least 1998, with the notable exception of the midterm election two years ago. In June 2006, 58% of voters, and fully 72% of Democrats, said the issue of party control of Congress was important to their vote.

Compared with two years ago, Democrats are much less likely to say that party control of Congress will be a factor in their vote. Still, more Democrats (55%) than Republicans (43%) or independents (34%) say that the issue of which party controls Congress will matter in their voting decision.

About the Survey

Results for this survey are based on telephone interviews conducted under the direction of Princeton Survey Research Associates International among a nationwide sample of 2,004 adults, 18 years of age or older, including an oversample of respondents ages 18-29, from June 18-29, 2008 (1,501 respondents were interviewed on a landline telephone, and 503 were interviewed on a cell phone, including 162 who had no landline telephone). Both the landline and cell phone samples were provided by Survey Sampling International.

The combined landline and cell phone data were weighted using demographic weighting parameters derived from the March 2007 Census Bureau’s Current Population Survey, along with an estimate of current patterns of telephone status in the U.S. derived from the 2007 National Health Interview Survey, using an iterative technique that simultaneously balances the distributions of all weighting parameters. The weighting procedure also accounted for the fact that respondents with both landline and cell phones had a greater probability of being included in the sample.

The following table shows the error attributable to sampling that would be expected at the 95% level of confidence for different groups in the survey:

In addition to sampling error, one should bear in mind that question wording and practical difficulties in conducting surveys can introduce error or bias into the findings of opinion polls.