Pew Research Center

FOR RELEASE MARCH 27, 2008

Obama Weathers the Wright Storm, Clinton Faces Credibility Problem.

National Discontent Approaches 20-Year High, Bush Approval at 28%

FOR MEDIA OR OTHER INQUIRIES:

Communications Department
202.419.4372
www.pewresearch.org

RECOMMENDED CITATION

Pew Research Center, March 2008, "Obama Weathers the Wright Storm, Clinton Faces Credibility Problem."

About Pew Research Center

Pew Research Center is a nonpartisan, nonadvocacy fact tank that informs the public about the issues, attitudes and trends shaping the world. It does not take policy positions. The Center conducts public opinion polling, demographic research, computational social science research and other data-driven research. It studies politics and policy; news habits and media; the internet and technology; religion; race and ethnicity; international affairs; social, demographic and economic trends; science; research methodology and data science; and immigration and migration. Pew Research Center is a subsidiary of The Pew Charitable Trusts, its primary funder.

© Pew Research Center 2026

Table of contents

  • About Pew Research Center
  • Obama Weathers the Wright Storm, Clinton Faces Credibility Problem.
  • Section 1: Rev. Wright, and Obama’s Race and Religion
  • Section 2: The Democratic Primary
  • Section 3: Voters Targeted by Robo-Calls
  • Section 4: The General Election
  • Section 5: Political Values, Traits and Emotions
  • Section 6: Dismal Views of the National Economy
  • About the Survey

Obama Weathers the Wright Storm, Clinton Faces Credibility Problem.

National Discontent Approaches 20-Year High, Bush Approval at 28%

Summary of Findings
The videos of Rev. Jeremiah Wright’s controversial sermons and Barack Obama’s subsequent speech on race and politics have attracted more public attention than any events thus far in the 2008 presidential campaign. A majority of the public (51%) said they heard “a lot” about the videos, and an even larger percentage (54%) said they heard a lot about Obama’s speech, according to the weekly News Interest Index.

Most voters aware of the sermons say they were personally offended by Wright’s comments, and a sizable minority (35%) says that their opinion of Obama has grown less favorable because of Wright’s statements.

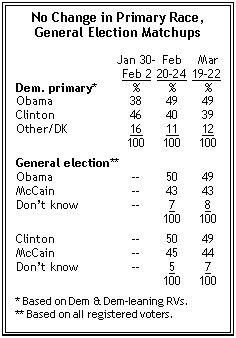
However, the Wright controversy does not appear to have undermined support for Obama’s candidacy. The latest nationwide survey by the Pew Research Center for the People & the Press, conducted March 19-22 among 1,503 adults, finds that Obama maintains a 49% to 39% advantage over Hillary Clinton for the Democratic nomination, which is virtually unchanged from the 49% to 40% lead he held among Democrats in late February. Obama and Clinton continue to enjoy slight advantages over John McCain in general election matchups among all registered voters.

The new polling suggests that the Wright affair has not hurt Obama’s standing, in part because his response to the controversy has been viewed positively by voters who favor him over Clinton. Obama’s handling of the Wright controversy also won a favorable response from a substantial proportion of Clinton supporters and even from a third of Republican voters.
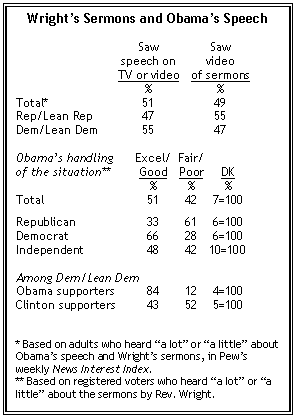
More than eight-in-ten supporters of Obama (84%) who have heard about the controversy over Wright’s sermons say he has done an excellent or good job of dealing with the situation. Reactions from Clinton supporters, and Republicans, are on balance negative; however, 43% of Clinton voters and a third of Republican voters who have heard about the affair express positive opinions about Obama’s handling of the situation.

The survey finds that, in general, Obama has a highly favorable image among Democratic voters, including white Democrats. But while Obama’s personal image is more favorable than Clinton’s, certain social beliefs and attitudes among older, white, working-class Democratic voters are associated with his lower levels of support among this group.

In particular, white Democrats who hold unfavorable views of Obama are much more likely than those who have favorable opinions of him to say that equal rights for minorities have been pushed too far; they also are more likely to disapprove of interracial dating, and are more concerned about the threat that immigrants may pose to American values. In addition, nearly a quarter of white Democrats (23%) who hold a negative view of Obama believe he is a Muslim.

Less educated and older white Democrats, who have not backed Obama in most primary elections, hold these values more commonly than do other Democrats.
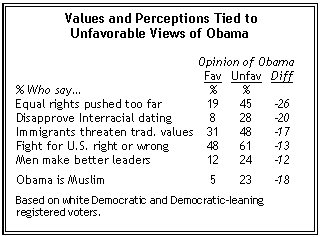
These patterns suggest the potential for future reverberations from the Wright controversy if Obama wins the Democratic nomination. More conservative beliefs about equal rights and race are not only related to negative opinions of Obama among Democrats, suggesting the potential for defections among Democratic voters, but also are associated with negative views of him in the electorate at large.

An analysis of the survey finds that holding conservative positions on political and social values is associated with a greater likelihood of supporting McCain over Obama among Republicans, Democrats and independents, and all demographic groups. In contrast, however, this pattern is much less apparent in the Clinton-McCain matchup, excepting views about women in leadership roles.

One of the few negative trends for Obama following the Wright affair is that a larger number of conservative Republicans hold a very unfavorable opinion of him in the new poll than did so in February. The survey also finds that Obama no longer enjoys the favorable image rating advantage over McCain among independents that was apparent in previous polls.

White Democrats and the Candidates

Large majorities of white Democratic voters view Obama as honest, inspiring, patriotic, and down-to-earth. Obama’s personal image surpasses Clinton’s on almost every personal attribute tested in the survey, except patriotism.

In addition, roughly twice as many white Democrats say the word “phony” describes Clinton than say it describes Obama (30% vs. 16%). And the gap is even larger in perceptions of likability; 43% of white Democratic voters say the phrase “hard-to-like” describes Clinton, while just 13% say it describes Obama.

Gender makes a significant difference in personal perceptions of Hillary Clinton. Democratic women voters are much more likely than their male counterparts to view Clinton as honest and down-to-earth, and they more often report that Clinton makes them feel proud and hopeful. However, Democratic women voters are about as likely as Democratic men to say the descriptors hard-to-like and phony apply to Clinton.

Views of Obama More Tied to Voters’ Emotions

White voters’ views of Barack Obama are more influenced by how he makes them feel than by specific characteristics voters attribute to him. Saying that Obama makes them feel hopeful and proud are the strongest predictors of the ratings white Democrats give him. And of the personal traits tested, “inspiring” is more closely linked with views of the Illinois senator than any of the others.

On the other hand, views of Hillary Clinton among white Democratic voters are more influenced by perceptions that she is phony than by any other trait or emotion tested. But saying that Clinton makes them feel proud and hopeful also are significant predictors of how these voters rate her. Interestingly, while sizable minorities of white Democratic voters say Clinton is hard-to-like (43%), this opinion does not have a significant impact on her favorability ratings.

McCain Out of the Spotlight

Opinions about John McCain are mostly unchanged in the current survey. In part, this may be explained by his low level of public visibility. In the current weekly News Interest Index survey, just 3% mentioned McCain, unprompted, as the candidate they had heard most about in the news. That compares with 70% who named Obama and 15% who named Clinton as the candidate they had heard most about.

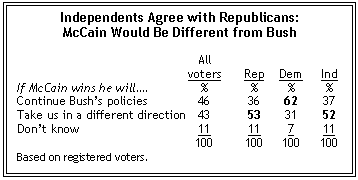
More positive for McCain, however, is that a growing proportion of Republican voters say that the GOP will solidly unite behind the Arizona senator; 64% express that view currently, up from 58% in late February. Along with this expression of increased partisan unity, the survey finds that by a considerable margin (52%-37%), independent voters say that if McCain is elected, he will take the country in a different direction rather than continuing Bush’s policies.

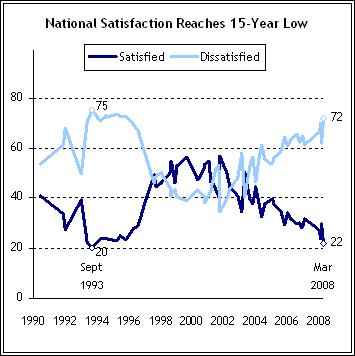
This comes at an opportune time for the GOP candidate. Bush’s job approval rating has slipped to 28%, the lowest of his presidency. In addition, just 22% express satisfaction with the way things are going in the country. This, too, is about as negative an evaluation of the course of the nation as measured in nearly 20 years of Pew surveys.

It’s the Inflation, Stupid
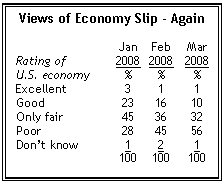
Americans have grown steadily more negative about the national economy over the past three months. Just 11% of the public rates the economy as excellent or good, down from 17% in early February, and 26% in January. Judgments about the national economy are now as negative as they were during the recession of the early 1990s. In August 1993, 10% of Americans rated the economy as excellent or good in a Gallup survey.

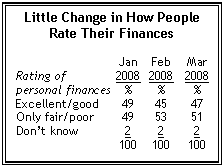
However, deepening concern about the national economy has so far not translated into more dour assessments of personal finances. As has been the case for some time, Americans are roughly divided between those who rate their personal finances as only fair or poor (51%) and those who say they are excellent or good (47%). In December 1993, just 39% rated their personal finances positively, while 60% viewed them negatively.

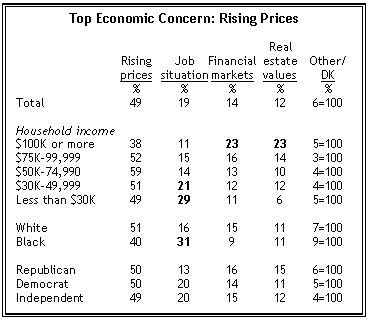
Rising prices are clearly the public’s top personal concern. Nearly half (49%) say that rising prices are the economic issue that most worries them. In contrast, just 19% name the job situation, 14% cite problems in the financial markets, and 12% cite declining real estate values. Inflation is the primary concern for people at all income levels, although worries about financial markets and declining real estate values register more strongly with Americans with household incomes of $100,000 or more. In contrast, the job situation is a relatively major concern for people with the lowest household incomes.

Other important findings include:

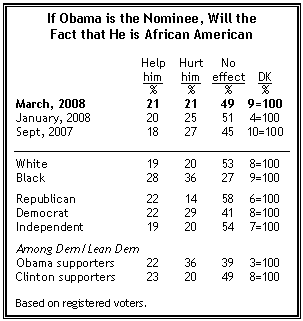
  • The Wright controversy has not heightened the public’s impression that Obama’s race will undermine his chance in the general election if he is the nominee. Only 21% say Obama’s race will hurt his chances, compared with 25% who held that view in January.
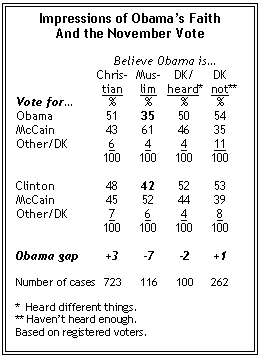
  • One-in-ten voters believe that Barack Obama is Muslim; 14% of Republicans, 10% of Democrats and 8% of independents think he is Muslim.
  • Fewer Democratic voters now think that a long primary contest is a good thing for the party. Just 44% think it is a good thing for the party that the nominating contest has not been settled. A month ago 57% expressed that view.
  • Most Democratic supporters of Clinton and Obama express favorable opinions of the other candidate. However, the campaign has taken a toll on positive views of both candidates among their rival’s supporters.
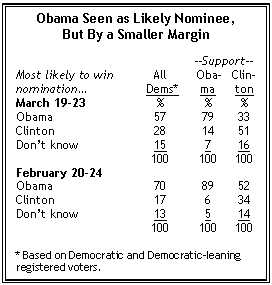
  • Nearly six-in-ten Democratic voters (57%) believe that Obama is most likely to win the party’s nomination, while 28% expect Clinton to prevail. Last month, 70% said Obama was most likely to win, while 17% expected Clinton to win.
  • Pre-recorded campaign calls, or “robo-calls,” have become the leading form of campaign communication in the 2008 primary season. Nationwide, 39% of voters say they have received a pre-recorded call about the campaign, up from 25% in November.

Section 1: Rev. Wright, and Obama’s Race and Religion

The recent controversy surrounding sermons by Obama’s former pastor, Rev. Wright, and Obama’s March 18 speech on race and politics have attracted more public attention than other recent campaign events, according to Pew’s weekly News Interest Index. Nearly eight-in-ten (79%) say they heard at least something about Wright’s sermons (51% a lot, 28% a little) and about half (49%) have seen video of the sermons. (See “Obama and Wright Controversy Dominate News Cycle,” March 27, 2008.)

Similarly, 54% say they heard a lot about Obama’s speech and 31% have heard a little. A majority of the public (51%) says they watched videos of his speech, including 10% who have watched it on the internet.

Not surprisingly, an overwhelming majority (70%) named Obama when asked which candidate they had heard the most about in the news over the last week.

More Democrats than Republicans (59% vs. 50%) reported hearing a lot about Obama’s speech and more report seeing video of his speech (55% vs. 47%). Slightly more Republicans than Democrats have seen videos of Wright’s sermons (55% vs. 47%).

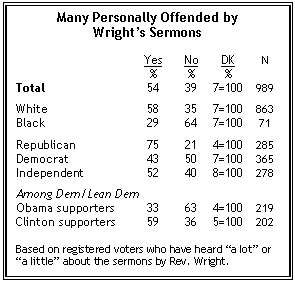
There are sizable partisan differences in the reaction to Wright’s sermons: fully 75% of Republican voters who reported hearing at least a little about Wright’s sermons say they were offended by them, compared with 52% of independents and just 43% of Democrats. In addition, among Democratic and Democratic-leaning voters, far more Clinton supporters than Obama supporters say they were offended by Wright’s sermons, though even among the latter group, a third said they found the sermons offensive.

A clear majority of whites who heard about Rev. Wright’s sermons say they were personally offended by what he said, while most blacks who heard about his sermons say they were not offended.

On balance, judgments about Obama’s handling of the controversy were somewhat more positive than negative. Among voters aware of the issue, just over half say he has done an excellent (23%) or good (28%) job of handling the controversy, while 27% say he has done only a fair job and 15% a poor job. Two-thirds of Democrats say Obama did an excellent or good job, as do the vast majority of black voters. While Republicans are far more critical (61% say he did only a fair or a poor job), even among Republicans, a third say he did at least a good job of handling the issue.

Is Race a Factor?

There is no evidence that the controversy over Rev. Wright’s sermons has heightened the public’s impression that Obama’s race is a problem for him in terms of his electability. Roughly half of voters say that the fact that Obama is black will not be a factor to voters if he is the Democratic nominee, and among those who do think it is a factor, as many say it will help him with voters (21%) as say it will hurt him (21%).

If anything, voters are less likely to see Obama’s race as an electoral negative in the wake of recent events. In January, 25% said being African-American would hurt Obama’s chances, and in September of last year, 27% believed it would hurt, while just 18% thought it would help.

African Americans continue to be more concerned that Obama’s race is a problem – 36% believe this will hurt him with voters, though 28% think it will help. Only 27% of blacks think Obama’s race won’t be a factor. By comparison, most whites (53%) think the fact that Obama is African-American won’t make a difference to voters, and those who think it will are divided between thinking it will help him (19%) and hurt him (20%).

Democrats are more than twice as likely as Republicans to say Obama’s race will be a problem (29% vs. 14%). And among Democratic and Democratic leaning voters with a preference between Obama and Clinton in the primaries, it is Obama’s supporters who are far more likely to see Obama’s race as a potential problem (36% vs. 20%) than Clinton supporters. Some of this gap reflects the skepticism among blacks about how well an African-American candidate can do. But even when race is taken into account, white voters who back Obama are substantially more likely than white voters who back Clinton to say the fact that Obama is black will hurt him in the fall (32% vs. 18%).

Who Thinks Obama is Muslim?

A Pew Research Center News Interest Index survey earlier in March found that 79% of the general public had heard rumors that Obama is Muslim, and 38% had heard “a lot” about this. The current survey finds that most voters have no misconceptions about Obama’s religious beliefs – 53% say that he is Christian. But one in ten believes Barack Obama is Muslim. Roughly a third (34%) say they don’t know what his religious beliefs are, though 9% say the reason they don’t know is that they’ve heard different things about his religion, not that they haven’t heard about it.

Notably, the impression that Obama is Muslim crosses party lines: 14% of Republicans, 10% of Democrats and 8% of independents think he is Muslim. Within both parties, ideology is a major factor: 16% of conservative Republicans believe Obama is Muslim, compared with 9% of moderates and liberals. And 13% of conservative and moderate Democrats believe Obama is Muslim, compared with just 5% of liberal Democrats.

The impression that Obama is Muslim varies by education, region, and religious background. Voters who did not attend college are three times as likely to believe Obama is Muslim when compared with voters who have a college degree (15% vs. 5%). And voters in the Midwest and South are about twice as likely as those in the Northeast and West to hold this belief. Nearly one-fifth of voters (19%) in rural areas say Obama is Muslim, as do 16% of white evangelical Protestants.

But there is little difference by age, gender or race in terms of voters’ likelihood of thinking Obama is Muslim. Most notably, about as many black (10%) as white (11%) voters believe he is Muslim.

There is little evidence that the recent news about Obama’s affiliation with the United Church of Christ has dispelled the impression that he is Muslim. While voters who heard “a lot” about Reverend Wright’s controversial sermons are more likely than those who have not to correctly identify Obama as a Christian, they are not substantially less likely to still believe that he is Muslim. Nearly one-in-ten (9%) of those who heard a lot about Wright still believe that Obama is Muslim.

Overall, the impression that Obama is Muslim has at most a slight impact on his fortunes in November – mostly because so few voters hold this belief in the first place. Moreover, Obama is only slightly less competitive against John McCain than Clinton is among the minority who believe this about him. Among the 10% of voters who say he is Muslim, 35% would still choose Obama over McCain in a general election matchup, while 61% would vote for McCain. These same voters would also choose McCain over Clinton, but by a smaller 52% to 42% margin.

Section 2: The Democratic Primary

Barack Obama maintains a 49%-39% lead over Hillary Clinton among Democratic and Democratic-leaning voters, despite heavy media coverage in the past week of Obama’s controversial former pastor. Obama’s advantage over Clinton is now about the same as it was before his losses in the March 4 primaries in Ohio and Texas (49%-40%).

Age, race and gender continue to be significant factors in the Democratic race. Obama enjoys strong support among men, younger voters and blacks, while Clinton does well among white women and older voters.

Obama leads Clinton among male Democratic voters by 21 points and holds an identical 21-point advantage among Democratic voters under age 50. Black Democratic voters express even greater support for Obama and favor him over Clinton by greater than three-to-one (67% to 22%).

Women are evenly divided between Obama and Clinton (44%-43%), but Clinton holds an 11-point lead among white women. Older voters continue to be a source of strong support for Clinton; she now holds a 51% to 33% advantage among voters ages 65 and older.

Obama leads Clinton by 17 points among liberal Democrats and runs as well among college graduates and those earning $75,000 a year or more. Clinton is more competitive with Obama – though still trails narrowly – among conservative Democrats and those with a high school education.

Fewer See Obama Winning Nomination

Most Democratic voters believe that Obama will capture the party’s nomination, but the percentage predicting an Obama victory has declined since late February. Currently, 57% of Democratic and Democratic-leaning voters believe that Obama is most likely to win the party’s nomination, while 28% expect Clinton to prevail. Last month, 70% said Obama was most likely to win compared with just 17% who expected Clinton to win.

Clinton’s supporters are much more optimistic about her chances than they were in late February. Today, by a 51%-33% margin they say that Clinton, rather than Obama, is most likely to win the nomination. This is a reversal from a month ago, when 52% of Clinton supporters believed that Obama would end up winning.

Long Contest Worries More Obama Backers

The belief among Democratic voters that a long primary contest is a good thing for the party has declined, particularly among those who support Barack Obama. Currently, Democratic voters are split over whether it is good (44%) or bad (41%) for the party that the nominating contest has not been settled. A month ago, roughly twice as many said a lengthy contest was good for the party than said it was bad for the party (57% vs. 27%).

Clinton supporters are now somewhat more likely than Obama supporters to say it is a good thing that the race remains unsettled (48% of Clinton backers vs. 41% of Obama backers). In late February, more Obama supporters than Clinton supporters called the undecided nominating contest a good thing for the party (60% vs. 52%). Overall the share of Obama’s supporters who say the unsettled contest is good for the party has fallen 19 points in the past month, compared with just a four-point decline among Clinton supporters.

Little Bitterness, But Growing Dislike

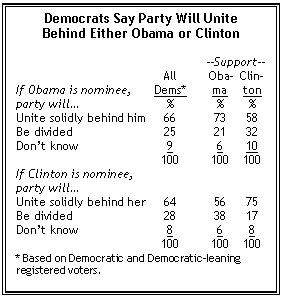
Despite the concerns that Democratic voters express about the unresolved nomination contest, most say that the party will solidly unite behind the eventual nominee, whether it is Clinton or Obama. Two-thirds (66%) say the party will unite behind Obama if he is the nominee while about the same percentage (64%) expects the party to rally behind Clinton.

Majorities of Obama and Clinton supporters still believe the party will solidly unite behind the nominee even if their favored candidate does not prevail. Among Clinton’s supporters, 58% say the party will unite if Obama wins the nomination, while 32% say his nomination would divide the party. The balance of opinion among Obama supporters is virtually identical: 56% see the party uniting, while 38% see the party dividing if Clinton becomes the nominee.

In addition, most Democratic supporters of Clinton and Obama express favorable opinions of the other candidate. However, the campaign has taken a toll on positive views of both candidates among their rival’s supporters. In late December, on the eve of the Iowa caucuses, just 26% of Clinton supporters offered an unfavorable assessment of Obama. Today 41% of Clinton supporters view him unfavorably. Negative views of Clinton among Obama supporters also have risen; currently, 42% express an unfavorable view of Clinton, up from a low of 31% in early February.

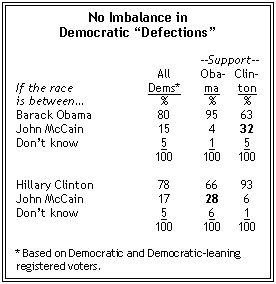
When it comes to the general election, the vast majority of Democratic and Democratic-leaning voters will vote for either Obama or Clinton over John McCain. But a number of supporters on both sides currently say they might switch if their candidate does not win the nomination. Among Clinton’s backers, 32% say they would vote for McCain if Obama is the Democratic nominee, and among Obama’s backers, 28% say the same if Clinton wins the primary race. Many of these “defections” come from independent voters who only lean Democratic. When the analysis is limited to those who identify themselves as Democrats, just 20% of Obama supporters say they would not vote for Clinton in the fall, and 25% of Clinton supporters would not vote for Obama.

The Vice Presidential Question

Looking ahead to the general election, most Democrats support the idea of an Obama-Clinton or Clinton-Obama ticket. Two-thirds of Democratic voters (66%) say they would like Clinton to pick Obama as her vice presidential running mate, while 59% say they would like Obama to pick Clinton if he is the nominee.

However, just 49% of Obama supporters say that, if their candidate captures the nomination, they would like to see him select Clinton as his running mate. That compares with 69% of Clinton supporters who would favor Obama choosing Clinton for the number-two slot on the ticket, if Obama is the nominee.

By contrast, large majorities of both Obama and Clinton supporters would be comfortable with Obama as the vice-presidential nominee if Clinton prevails in the primary race. Fully 69% of Obama supporters say that, if Clinton wins, they would want her to select Obama as her running mate, while 60% of Clinton supporters say the same.

Little Difference on Issues

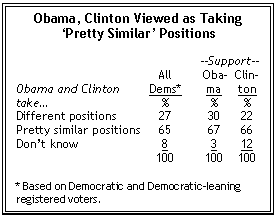
Notably, most Democrats do not believe that Obama and Clinton take different positions on the issues. Overall, two-thirds of Democratic and Democratic-leaning voters (65%) say that Obama and Clinton take pretty similar positions on the issues while just 27% say they take different positions.

Obama and Clinton supporters generally concur in the view that there are not substantive differences between the two candidates on the issues. Two-thirds each of Obama and Clinton supporters believe that the candidates take pretty similar positions on the issues.

Section 3: Voters Targeted by Robo-Calls

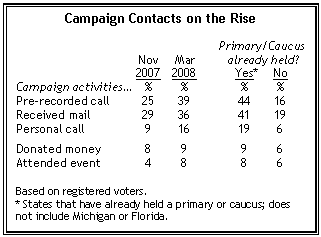
Pre-recorded campaign calls, or “robo-calls,” have become the leading form of campaign communication in the 2008 primary season, topping even mass mailings as the most frequent type of campaign communication received by voters. Nationwide, 39% of voters say they have received a pre-recorded call about the campaign, up from 25% in November. This is slightly higher than the number saying they have received mailings about the candidates (36%), and much higher than the percentage saying they have received a telephone call from a live person (16%).

Not surprisingly, the rates of contact are even higher in the states that have already conducted their primary or caucus contests. Fully 44% of voters in these states say they have received a robo-call; 41% say they have received mail about a candidate; and 19% say they have received a personal call. Contact rates in the smaller number of states that have yet to hold their contests are substantially lower.
There are no significant differences across party lines in reports of campaign contacts. Comparable percentages of Republican, Democratic and independent voters say they have received campaign robo-calls (42%, 38% and 43%, respectively). The same is true when it comes to receiving mail about the candidates and receiving calls from a live person.

Campaign Contributions and Attending Events

However, there are substantial partisan differences in voters’ campaign activities, with Democrats – particularly liberal Democrats – more likely than Republicans to say they have donated money to a candidate or attended a campaign event.

Overall, just 9% of registered voters report having made a contribution to a presidential candidate in this campaign, which is virtually unchanged from November (8%). Far more Democrats than Republicans say they have made a campaign contribution (12% vs. 7%). And the gap is even wider when ideology is taken into account. Nearly one-in-five liberal Democrats (19%) say they have made a contribution to one of the candidates. This compares with just 6% of conservative Republicans, who in past election cycles have typically matched their liberal Democratic counterparts in self-reported donations.

Similarly, Democrats are twice as likely as Republicans to say they have attended a campaign event during this election: 10% of Democrats say they have attended such an event compared with 5% of Republicans. Fully 15% of liberal Democrats report having attended a campaign event, compared with 8% of moderate or conservative Democrats. Conservative Republicans, on the other hand, are the least likely to report having attended a campaign event (4%).

Section 4: The General Election

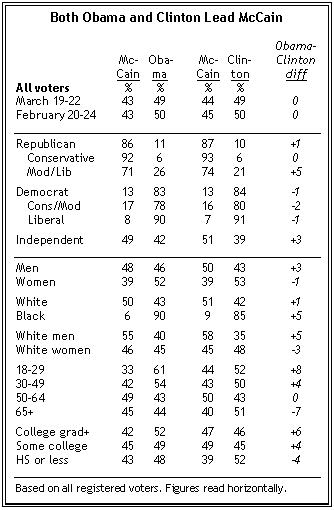
Both Barack Obama and Hillary Clinton hold roughly comparable leads in head-to-head matchups with John McCain. Obama edges McCain by a 49% to 43% margin among registered voters nationwide; Clinton holds an almost identical 49% to 44% edge. Obama and Clinton held similar leads over McCain in late February.

Yet there are positive signs for McCain. He now leads Obama among independent voters by seven points. In late February, McCain trailed Obama among independents by six points.

Independent voters, who generally disapprove of President Bush’s performance in office, mostly believe that McCain will take the country in a different direction, a factor which works to McCain’s advantage. Moreover, the impression that the GOP will have trouble uniting behind McCain also is decreasing, as more Republicans believe that the GOP will come together.
McCain runs very well among white men, and as a result leads both Obama and Clinton among all white voters (by seven and nine points, respectively). White men favor McCain over Obama by 15 points, and McCain over Clinton by 23 points. White women are divided about equally in both matchups.

Younger voters lean Democratic regardless of the candidate, but while Obama has a nearly 30-point advantage among voters under age 30 (61% to 33% for McCain), Clinton has a more modest eight-point edge (52% to 44%). Clinton’s strength is among older voters (ages 65 and older), who favor her over McCain by 11 points (51% to 40%). These same voters are divided evenly if the election is between Obama and McCain (44% to 45%). McCain runs strongest among voters ages 50 to 64, who favor him by a slim margin irrespective of which Democratic candidate he faces.

McCain’s Standing

With the voters’ focus squarely on the Democratic primary contest, McCain continues to consolidate support among Republican voters and maintain his image among independents. A month ago, nearly a third of Republicans (32%) said they thought that divisions and disagreements within the party would keep many Republicans from backing McCain. Today, only 22% believe this will happen. Instead, 64% of Republicans say the party will unite solidly behind McCain’s candidacy, up from 58% in late February.

The growing impression that McCain can unify the party crosses ideological lines. The share of conservative Republicans who saw McCain as divisive has fallen from 32% in February to 20% today. Similarly, there has been a decline in the percentage of Republican-leaning independents who say that differences within the GOP will keep Republicans from supporting McCain (40% in February vs. 23% today).

One advantage McCain has among independents is the impression that he would not follow in Bush’s footsteps as president. Roughly half of independents (52%) say McCain would take the country in a different direction, while 37% say he would continue Bush’s policies. Given that, by greater than two-to-one, more independents disapprove (63%) than approve (27%) of Bush’s job performance, this works in McCain’s favor.

Most Republicans (53%) also say McCain would differ from Bush, while 36% say he will continue Bush’s policies in office. But Democratic voters see a McCain presidency differently. By a two-to-one margin (62% to 31%) more Democrats predict that a McCain presidency would continue Bush’s policies than break out in a different direction.

Obama’s Standing

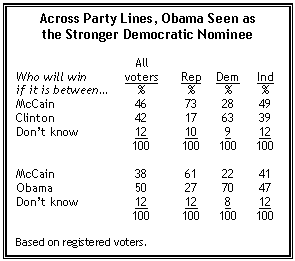
Even though the same number of voters back Clinton against McCain as back Obama against McCain, Obama is perceived to be the stronger Democratic nominee in terms of electability. Half of voters believe that Obama would win over McCain in the fall, while 38% predict a McCain victory against Obama. But if the matchup is between Clinton and McCain, 46% say McCain will win and just 42% Clinton.

Democrats are optimistic about their chances with either candidate, but 70% see Obama beating McCain compared with 63% who see Clinton beating McCain. Republicans, too, tend to express confidence in their candidate. But while 73% believe McCain will beat Clinton, just 61% think he will beat Obama. When it comes to independents, a 49% plurality see McCain winning over Clinton, while a 47% plurality see McCain losing to Obama.

The impression that Obama is the stronger Democratic candidate in the fall stands in contrast to some voters’ own preferences, in as much as Obama and Clinton run equally strong against McCain. But Obama does have a clear advantage over Clinton in terms of overall favorability among Republican and independent voters. Just 18% of Republicans offer a favorable assessment of Clinton, while 79% view her unfavorably (about half – 49% – feel “very” unfavorably toward her). By comparison, 30% of Republicans offer a favorable assessment of Obama, while 60% feel unfavorably (37% “very” unfavorable.) Among independents, Obama is viewed favorably by 57% compared with just 46% who give a favorable rating to Clinton.

But Obama’s overall favorability advantage has narrowed substantially. In late February, Obama’s favorability rating among independents was substantially higher than either John McCain’s or Hillary Clinton’s. But this gap has narrowed substantially. Today, Obama and McCain both have a generally favorable image among independent voters, and there is no substantial difference; 57% express a favorable view of Obama, 56% of McCain. Independent voters remain divided in their view of Clinton (46% favorable, 48% unfavorable).

Section 5: Political Values, Traits and Emotions

For the most part, the Democratic electorate is politically and socially liberal, but there are divisions within the party, especially along racial, class, and generational lines. Looking at divisions just among white Democrats and Democratic-leaning independents, the older and less educated are significantly more conservative on key political values.

A quarter of white Democrats believe that the country has gone too far in pushing equal rights. A much larger proportion of white Democrats who have not attended college believe this than those with at least some college experience (37% vs. 16%).

Overall, 61% of white Democratic voters completely agree that it’s “all right for whites and blacks to date each other.” But fewer than half of non-college and older white Democrats completely agree (44% for each group). Notably, about one-in-five in each of these groups disagrees with the idea that interracial dating is acceptable. By contrast, just 6% of college-educated Democratic voters, and just 3% of younger white Democrats (ages 18 to 44), find interracial dating unacceptable.

Few Democrats believe that women should return to their traditional roles, or that men make better leaders than women. However, younger and better educated white Democrats are even more likely than others to disagree with these notions. About three-quarters of college educated (76%) and younger Democrats (73%) completely disagree that women should return to traditional roles, compared with 48% of those who have not attended college, and 56% of Democrats ages 45 and older. Similarly, 57% of Democrats with college experience completely disagree that men are better leaders, compared with 40% of Democrats who have not attended college.

Democrats are nearly equally divided over the statement that “we should be willing to fight for our country whether it is right or wrong” (50% agree and 46% disagree). However, 52% of Democrats who have attended college disagree with this view, compared with 37% of non-college Democrats. There are no significant age differences on this question.

Older Democrats and the less educated also have more conservative views when it comes to immigration. About six-in-ten white Democrats overall (61%) disagree that the growing number of newcomers threatens traditional American customs and values. Democrats who have not attended college are divided on this question (45% agree and 51% disagree). In contrast, 69% of those with college experience disagree with the idea that newcomers to the United States threaten traditional values.

Democratic Values and Candidate Favorability

Differences on these social and political attitudes are correlated with opinions about Obama among white Democratic voters, but they are not significantly associated with opinions about Clinton. Democrats with more liberal views on interracial dating, the country’s pursuit of equal rights, and even the question of whether men make better leaders, hold a more favorable opinion of Obama than do Democrats with conservative views on these questions.

By contrast, most of these values are only weakly related to favorability ratings of Clinton. Taken together, they give little indication of a Democratic voter’s impression of Clinton.

Values and the General Election Vote

There is much more variation on these values in the general electorate than there is among Democrats, and consequently their impact on the vote in November may be substantial. A multiple regression analysis that takes into account demographics and partisanship finds that voters with conservative racial attitudes are much less likely to vote for Obama against McCain than are those with liberal attitudes.

For example, a voter who disapproves of interracial dating (15% of all voters) is 24 percentage points less likely to vote for Obama than one who approves of interracial dating, controlling for demographics and party affiliation. Similarly, a voter who believes that “we have gone too far in pushing equal rights in this country” (31% of all voters) is 20 percentage points less likely to vote for Obama. Other social values have a much weaker association with the likelihood of voting for Obama.

The social value most highly associated with the likelihood of voting for Clinton is the belief that men are better leaders than women. In the multiple regression analysis, voters who hold this view (26% of all voters) are 26 percentage points less likely to vote for Clinton over McCain.

Candidate Traits and the Democratic Electorate

Solid majorities of all Democratic and Democratic-leaning voters describe Clinton and Obama as inspiring, honest, down-to-earth, and patriotic. In addition, most say both candidates have made them feel hopeful and proud. But Democratic voters are considerably more likely to attribute positive traits to Obama than to Clinton, while negative traits are more often associated with Clinton.

About eight-in-ten Democratic voters say Barack Obama is down-to-earth (82%), inspiring (82%), and honest (80%). By comparison, about two-thirds see Hillary Clinton as inspiring (66%) and honest (65%) and slightly fewer say she is down-to-earth (62%). When it comes to being seen as patriotic, however, Clinton has a slight edge over her opponent; 86% say she is patriotic, while 78% say that about Obama.

In general, opinions of Clinton vary considerably by gender. About two-thirds of Democratic and Democratic-leaning women (68%) say Clinton has made them feel proud. By contrast, just 42% of Democratic and Democratic-leaning men say the same. Women are also much more likely than men to say Clinton is inspiring (72% vs. 57%), honest (69% vs. 59%), and down-to-earth (69% vs. 51%), and to say that Clinton has made them feel hopeful (70% vs. 52%).

Similarly, African Americans and whites express significantly different opinions about Barack Obama. Fully 82% of black Democratic and Democratic-leaning independent voters say Obama has made them feel proud, but just over half of white Democrats (53%) express this view. And while overwhelming majorities of white Democratic voters say Obama is inspiring (80%) and down-to-earth (78%), and that he makes them feel hopeful (68%), even greater shares of blacks attribute these characteristics to Obama (92% inspiring, 92% down-to-earth, and 87% hopeful).

Most Democratic voters do not associate negative traits and emotions with either of their party’s candidates, but about three-in-ten Democrats and Democratic-leaning independents (29%) say the word phony describes Clinton, and about as many say she has made them feel uneasy (30%) and angry (32%). Moreover, fully 39% of democratic voters describe Clinton as hard to like. Fewer Democratic voters describe Barack Obama as phony (14%) or hard to like (13%), but larger minorities say he has made them feel angry (19%) and uneasy (25%). White Democratic voters are much more likely than blacks to say Obama has made them feel uneasy (29% vs. 7%).

What Makes Democrats Uneasy about Obama?

Democratic voters who said that Obama makes them uneasy (25% of all Democratic and Democratic-leaning voters) were asked to explain what it is about him that makes them feel this way. The most common response pertained to his relative lack of experience: a quarter those who say Obama has made them feel uneasy point to his inexperience, either in general or in a particular policy arena, or to what some perceive as his naivety about the political process. Closely following mentions of his inexperience are concerns about Obama’s affiliation with Rev. Wright and other associates, mentioned by 21%; 16% refer specifically to Wright.

A smaller group (13%) voices concern that Obama is not substantive or specific enough. These concerns are more common among college graduates than among those who have not graduated from college.

While less common, references to Obama’s race were mentioned by 7% of Democratic voters, a view expressed only by those who have not attended college. His religious beliefs, which include both general comments and specific references to beliefs that he is Muslim, were noted by 6%, and concerns about Obama’s patriotism (4%) were also mentioned.

What Makes Clinton Hard to Like?

Democratic voters who say that Hillary Clinton is hard to like – 39% of the total – were asked to describe what it is about her that makes her hard to like. About one-in-five (21%) mention aspects of Clinton’s personality, including coldness, pushiness, and arrogance. About one-in-ten (11%) say she has “too much baggage” from the Clinton administration. About the same number (10%) says she is too ambitious and will say or do anything to get elected. Fewer Democrats mention dishonesty or say she is phony (6% each) in response to why Clinton is hard to like. A small number mention questionable campaign tactics (5%) or simply the fact that she is a woman (5%).

Democratic and Democratic-leaning men and women do not offer significantly different explanations for thinking Clinton is hard to like, but men are twice as likely as women to say the New York senator is too ambitious (14% vs. 7%). Women are somewhat more likely than men to say they dislike Clinton’s positions on issues (7% vs. 1%).

Obama’s Broad Appeal

Obama’s personal appeal extends to many voters beyond the Democratic electorate. Among voters overall, seven-in-ten view Obama as inspiring and two-thirds (67%) say he is down-to-earth. Considerably fewer see him as phony (27%) or hard to like (17%). By contrast, fewer than half of registered voters see Clinton as inspiring (49%) or down-to-earth (45%). Regardless of party, voters assess Obama more favorably across a series of traits.

Not surprisingly, the personal images of both Obama and Clinton are more positive among Democratic voters than among independents or Republicans. However, Republicans express much more critical views of Clinton than Obama on nearly every trait tested.

Only 25% of Republicans say Clinton is inspiring, compared to 58% who say the same of Obama; this 33-point gap is more than double the gap among Democrats. This contrast in partisan intensity is starkest when asked if the candidates are “hard-to-like;” three-quarters of Republicans (75%) say this describes Clinton, while fewer than a quarter (22%) says the same of Obama.

Patriotism is an exception to the pattern seen with the other traits: Independent of partisan affiliation, Clinton is seen as patriotic by more voters than Obama (76% to 64%). A solid majority of Republican voters (62%) says that the word patriotic describes Clinton, but fewer than half (46%) say it describes Obama.

As with Democratic women, independent women are significantly more likely than their male counterparts to attribute positive qualities to Clinton. Majorities of independent women say she is inspiring (57% compared with 41% of independent men), and down-to-earth (53% vs. 36%) and a greater number say she is patriotic (81% vs. 70% ). There are no significant gender differences in views of Clinton among Republicans.

Emotional Reactions

Obama’s advantage over Clinton among independents and Republicans in personal traits is not as apparent when it comes to emotional responses to the candidates. A majority of all voters say that Obama has made them feel hopeful (54%), compared with 44% of voters who say this about Clinton.

Obama’s advantage over Clinton on this response is greatest among independent voters; 55% of independents say Obama has made them feel hopeful, compared with 38% who say Clinton has made them feel hopeful. Even among Republican voters, however, nearly twice as many say Obama has made them feel hopeful than say the same about Clinton (30% vs. 18%).

By contrast, there is no significant gap in feelings of pride associated with Clinton or Obama. Few Republicans say that either Clinton (18%) or Obama (21%) has made them feel proud, and comparable minorities of independents say Clinton and Obama have made them feel proud (34% and 39%, respectively).

About four-in-ten voters say that Clinton (42%) and Obama (38%) have made them feel uneasy. A solid majority of Republicans (63%) say that Clinton has made them feel uneasy, but about as many say the same about Obama (62%).

Obama inspires much less anger among voters (26% say he has made them feel angry) than does Clinton (42% say she has made them angry). While voters in all partisan groups are more likely to have felt anger at Clinton than at Obama, Clinton evokes intensely negative feelings among Republicans, in particular. Fully 58% of Republican voters say Clinton has made them feel angry, compared with 37% who say the same about Obama.

As is the case in views of personal traits, Clinton evokes consistently more positive (and fewer negative) feelings among independent women than among independent men. Four-in-ten independent women say Clinton has made them feel proud, compared with 28% of independent men). A slim majority (51%) of independent men have felt anger with Clinton, compared with 38% of independent women.

Section 6: Dismal Views of the National Economy

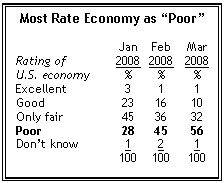
Public views of the American economy have grown increasingly negative over the past few months, and a majority now describes the country’s economic situation as poor. Since January, the percentage of Americans rating the economy as poor has doubled, from 28% to 56%. Meanwhile, only 11% say the economy is excellent or good, down from 26% just two months ago. To find comparably negative assessments, one must go back 15 years to August 1993, when only 10% of Americans rated the economy as excellent or good in a Gallup survey.

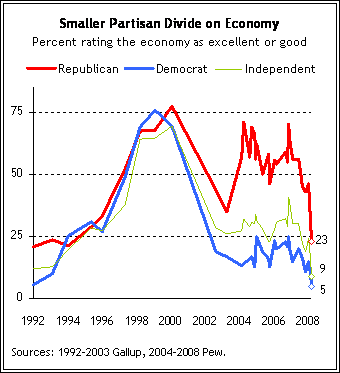
Much of the change over the last two months has taken place among Republicans. Throughout most of President Bush’s time in office there has been a large partisan gap on the state of the U.S. economy, with most Democrats and independents offering negative assessments of the economy, and most Republicans offering positive assessments. As recently as last June, 56% of Republicans said the economy was in excellent or good shape, compared with 20% of Democrats and 30% of independents.

However, Republican views have soured considerably, particularly in the past two months. In January, 46% of Republicans rated the economy as excellent or good, compared with only 23% today.

In addition, the already low ratings among Democrats and independents have continued to slide. Today, only 5% of Democrats believe the economy is in excellent or good shape, down from 15% in January. Just 9% of independents give the economy positive marks, down from 24% two months ago. The gap in Republican and Democratic evaluations of the economy is smaller today than it has been in five years. There are greater partisan differences in views about the severity of the nation’s financial problems. Over half (56%) of Americans believe the U.S. is currently in a recession, and another 15% say the country is in a depression. Fully 82% of Democrats say the nation is either in a recession (63%) or a depression (19%); as do seven-in-ten independents. Republicans offer far less dire assessments of the economic situation. While a slim majority of Republicans (55%) say the nation is in recession or depression, 20% say we are just having a few problems, and 23% say the economy is in excellent or good shape.

As views of the current economic situation have dimmed, there has been an increase in the proportion saying that the economy will improve over the next year. Currently, a third says the economy a year from now will be better than it is today; 39% say it will be about the same as it is now; and 22% say it will be worse. In January, there was less economic optimism, as just 20% expected conditions a year from now to be better than they are today.

Growing Dissatisfaction with Country’s Direction

The public’s increasingly grim views of the economy are reflected in assessments of the country’s overall direction. Just 22% of Americans are satisfied with the way things are going in the country, the lowest percentage observed in any Pew Research Center survey since the fall of 1993.

Republican opinion on this question has changed significantly in recent months. In late December of last year, Republicans were about equally likely to say they were satisfied (47%) with the country’s direction as they were to say they were dissatisfied (48%); today, however, a solid 56% majority of Republicans say they are dissatisfied with the nation’s course, while only 40% are satisfied.

Personal Finances Stable

Deepening concerns about the nation’s economic health have not translated into more negative assessments of personal finances. As in January, Americans are roughly divided between those who rate their personal finances as only fair or poor (51%) and those who say they are excellent or good (47%).

Looking to the future, most Americans (55%) believe their personal financial situation will improve over the next year, down only slightly from January, when 60% said their finances would improve. Meanwhile, 27% currently expect their finances to get worse, up slightly from 22% in January.

Unsurprisingly, assessments of current financial situations vary considerably by income level. For instance, 84% of those with household incomes of $100,000 or more say they are in excellent or good financial shape, compared with only 20% of those making less than $30,000. However, there is little variation among income groups regarding the future. Nearly two-thirds (64%) of those earning at least $100,000 expect their financial situation to improve, but they are only marginally more optimistic than those with incomes below $30,000, 58% of whom believe they will be better off one year from now.

Inflation is Biggest Personal Economic Concern

Rising prices top the list when it comes to Americans’ personal economic concerns. Nearly half (49%) cite higher prices as the economic issue they are most worried about. By comparison, just 19% cite the job situation, 14% point to problems in the financial markets, and 12% say declining real estate values.

Majorities or pluralities of Americans across a broad spectrum – regardless of age, income or other personal characteristics – point to inflation as their top financial worry. There is, however, some variation in perceptions of the severity of other problems. For example, the job situation is mentioned far more frequently as a top economic concern by blacks (31%) than whites (16%). Similarly, those with household incomes of under $30,000 annually are the most likely of any income group to rate jobs as a top concern (29%), though prices remain their most widespread concern (49%).

Concern about problems in the financial markets and declining real estate values peak among Americans with household incomes of $100,000 or more. Nearly a quarter (23%) of this group rates each of these issues as the top concern from their own perspective. A plurality of the highest-income group lists rising prices at their top concern, but at 38%, the proportion citing inflation is much smaller than it is for lower-income groups.

There is little division of opinion about the top economic problem across partisan lines. About half of Republicans, Democrats and independents alike say rising prices are their biggest personal financial worry.

Age plays a role where real estate worries are concerned: 16% of 30-49-year-olds say this is their biggest economic worry, far more than the proportion younger adults (8%) or older adults (10%).

Low Marks for Government’s Handling of Investment Crisis

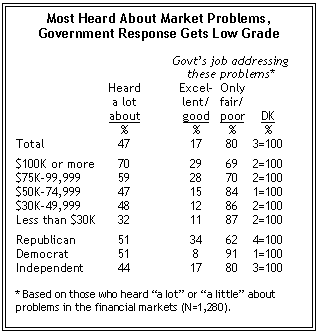
More than three-quarters of Americans have heard at least a little about the problems in the financial markets involving investment banks (47% a lot, 33% a little). Of those who have heard about the problems, 80% say the government has done only a fair job or a poor job addressing problems in the nation’s financial markets.

Awareness of the investment banking issue is almost universal among those with the highest household incomes; 95% of those from households with incomes of $100,000 or more had heard at least a little about the situation – 70% have heard a lot, 25% a little. Knowledge falls off with income, such that only 68% of those from households with incomes of less than $30,000 have heard about the investment banking problems, and less than one third (32%) have heard a lot. More than eight-in-ten Republicans and the same proportion of Democrats (83%) have heard about the situation, as well as 81% of independents.

Of those who have heard about the financial market problems, higher-income groups also are more positive in their judgments of government efforts; still, seven-in-ten of those in households with incomes of $75,000 or more say the government is doing a fair or poor job handling this issue. More than eight-in-ten in each of the lower-income groups say the same.

Democrats are far harsher in their assessments of the government’s response to the financial crisis than are independents or Republicans. More than nine-in-ten Democrats (91%) say the government is doing only a fair job or a poor job in addressing the market issues, a judgment shared by 70% of independents and 62% of Republicans.

Bernanke Still Not Well Known

Most Americans don’t know who Federal Reserve Chairman Ben Bernanke is, despite his leading role in the government’s response to the investment banking crisis; 56% say they have not heard of him or do not know enough about him to offer an opinion. Those who are familiar enough with Bernanke to offer an opinion of him are divided: About a quarter (24%) hold a favorable opinion of him, while 20% offer an unfavorable rating.

Three times as many Republicans give a favorable rating to Bernanke as give an unfavorable one (36% versus 12%). Democrats and independents are much more evenly split, leaning slightly toward unfavorable views of the Federal Reserve chairman.

Bernanke fares better with those who know about recent problems with investment banks. Among those who know a lot about the situation, 37% hold favorable views of Bernanke, though 40% still do not offer an opinion. Only 6% of those who know nothing of the investment banking problems give Bernanke a favorable rating, while 82% give no rating at all.

About the Survey

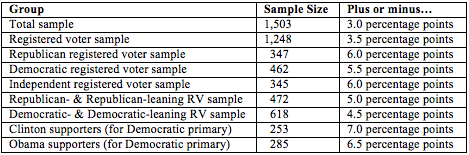
Results for this survey are based on telephone interviews conducted under the direction of Princeton Survey Research Associates International among a nationwide sample of 1,503 adults, 18 years of age or older, from March 19-22, 2008. The following table shows the error attributable to sampling that would be expected at the 95% level of confidence for different groups in the survey:

In addition to sampling error, one should bear in mind that question wording and practical difficulties in conducting surveys can introduce error or bias into the findings of opinion polls.

Some material in this report was taken from the Pew Research Center’s weekly News Interest Index survey (N=1,015) conducted March 20-24, 2008. An abbreviated topline for this survey appears at the end of this report.