Pew Research Center

FOR RELEASE SEPTEMBER 16, 2004

Kerry Support Rebounds, Race Again Even

Strong Interest in Debates

FOR MEDIA OR OTHER INQUIRIES:

Communications Department
202.419.4372
www.pewresearch.org

RECOMMENDED CITATION

Pew Research Center, September 2004, "Kerry Support Rebounds, Race Again Even"

About Pew Research Center

Pew Research Center is a nonpartisan, nonadvocacy fact tank that informs the public about the issues, attitudes and trends shaping the world. It does not take policy positions. The Center conducts public opinion polling, demographic research, computational social science research and other data-driven research. It studies politics and policy; news habits and media; the internet and technology; religion; race and ethnicity; international affairs; social, demographic and economic trends; science; research methodology and data science; and immigration and migration. Pew Research Center is a subsidiary of The Pew Charitable Trusts, its primary funder.

© Pew Research Center 2026

Table of contents

  • About Pew Research Center
  • Kerry Support Rebounds, Race Again Even
  • Section 1: Candidate Support
  • Section 2: Perception of the Candidates
  • Section 3: Views of the Campaign
  • About the Survey

Kerry Support Rebounds, Race Again Even

Strong Interest in Debates

Introduction and Summary

Voter opinion in the presidential race has seesawed dramatically in the first two weeks of September. Following a successful nominating convention, George W. Bush broke open a deadlocked contest and jumped out to a big lead over John Kerry. However, polling this past week finds that Bush’s edge over his Democratic rival has eroded. Reflecting this new volatility in the race, the size of the swing vote has increased slightly since the summer, rather than contracting as it typically does as the election approaches.

The latest national survey of 1,972 registered voters by the Pew Research Center for the People & the Press, conducted in two waves over a seven-day period, finds that the president’s large margin of support in the initial period (Sept. 8-10) dissipated in the polling conducted Sept. 11-14. Among all registered voters Bush initially led Kerry by 52%-40%. However, the second wave of interviewing shows the race even among registered voters, at 46%-46%. When the sample is narrowed to likely voters, Bush holds a statistically insignificant lead of 47%-46% in the second wave, down from a huge 54%-38% advantage he held in the first wave of interviews.

The shifting voter sentiment observed in this poll reflects a number of cross currents in public opinion. Hard-hitting attacks against the Democratic challenger throughout August and during the Republican convention took a heavy toll on Kerry’s personal image. Kerry’s positive support waned, fewer voters expressed confidence in him to deal with major issues, and perceptions of him as a ‘flip-flopper’ rose noticeably.

In contrast, Bush improved his personal image in early September and erased or reduced his rival’s advantage on most issues. At the same time, however, Bush showed continued vulnerability on Iraq and the economy. A plurality of the public still disapproved of the president’s stewardship of the economy. While opinion of his handling of Iraq has inched up since the early summer, nearly six-in-ten voters (58%) say it is not clear what Bush will do about Iraq if he is reelected.
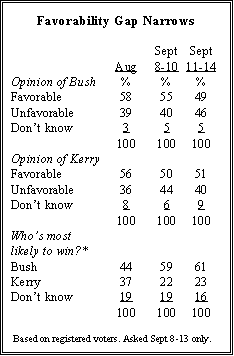
As more time has passed since the Aug. 30-Sept.2 Republican convention, Kerry’s unfavorable ratings have receded somewhat. And while Kerry no longer holds the big advantage he once had on most issues, his standing relative to Bush has rebounded slightly on the economy.

The second wave of polling also finds less acceptance of Republican criticism of the Democratic candidate. Fewer voters agree with the statement “John Kerry changes his mind too much.” Fewer think the chances of terrorism would increase if Kerry is elected. In addition, a substantial majority of voters (66%) believe Vice President Cheney went too far when he suggested recently that risk of terrorism would increase if voters “make the wrong choice.” That opinion remained steady through the polling period.

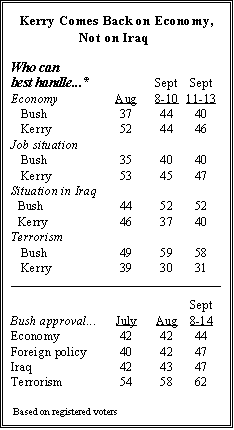
Yet in several other areas, the Democratic contender has not recaptured the ground he lost in August. A majority of the electorate (52%) believes Bush can best handle the situation in Iraq, while 40% choose Kerry. And Bush’s advantage over Kerry on dealing with the threat of terrorism, which widened considerably in the Sept. 8-10 survey, remains undiminished.
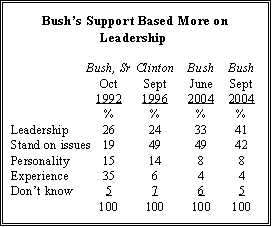
Bush’s biggest personal asset is his strong leadership image. By roughly two-to-one (58%-30%) voters say the phrase “strong leader” describes Bush rather than Kerry, and that view remained steady through the polling period. Moreover, Bush’s supporters cite his leadership abilities as a basis of their vote far more often than did President Clinton’s supporters during his reelection campaign in 1996, or former President Bush’s backers four years earlier.

The firm commitment of the president’s constituency also stands out. George W. Bush registers a higher proportion of strong support than any other candidate in elections dating back to 1988. In contrast, Kerry’s supporters have lost some zeal since early August, and more continue to say they are voting against Bush rather than for Kerry.

Kerry’s slippage in the post-convention polls also has undermined confidence in his chances of victory, including among Democrats. The percentage of all voters anticipating a Bush victory climbed from 44% in August to 60% in September, a figure that held steady through the polling period. Among Democrats, the number predicting a Kerry victory fell from 66% in August to 43% this month.

The tightening race underscores the stakes for both candidates in the upcoming presidential debates. The public remains highly engaged in the campaign: 71% say they have given a lot of thought to the election and 40% are following election news very closely, up from just 22% four years ago.
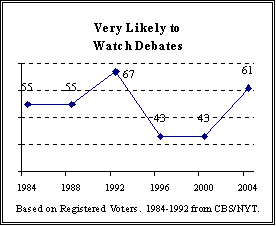
This increased attentiveness is carrying over into heightened interest in the debates. Six-in-ten voters (61%) say it is very likely they will watch the debates between Bush and Kerry, which is significantly higher than debate interest in the last two elections.

In general, campaign 2004 continues to get high marks from the voters. Nearly all voters (90%) view the campaign as “important,” and 63% believe it has been “informative.” Moreover, the number who describe the campaign as “interesting” increased sharply over the summer, from 31% in June to 50% currently. Reflecting the campaign’s recent nasty turn, however, more voters also characterize the campaign as “too negative” ­ 62% say that now, compared with 46% two months ago.

Other key findings of the survey:

  • Slightly more voters think that President Bush did not meet all of his service obligations while in the National Guard than say he did (43% vs. 33%). But only about a quarter (26%) say it bothers them.
  • John Edwards’ favorable ratings have declined ­ from 58% in August to 49% ­ and he runs about even with Dick Cheney in a match-up of vice-presidential running mates (46% Edwards/44% Cheney).
  • The questions surrounding Bush and Kerry’s service during the Vietnam war have drawn much more attention from committed voters than swing voters. Fewer than one-in-five swing voters are following either story very closely.
  • More than half of all voters ­ and 64% of swing voters ­ agree with the statement: “It’s not clear what George W. Bush is going to do about Iraq if he is reelected.”
  • This month’s tragedy at a Russian school, during which scores of children were killed by Chechen separatists, has drawn wide attention in the U.S. About the same number followed the school tragedy very closely as followed the opening of the Berlin Wall and the collapse of the Soviet Union.
Section 1: Candidate Support

John Kerry’s gains in recent days have helped to bring him back into contention for the support of key voting blocs and to restore his lead among groups that had favored him when the race was deadlocked throughout the summer. But President Bush continues to enjoy a strong advantage among his base supporters. Significantly, the president also made gains in the battleground states since his convention and has not lost that support in the second wave of September polling.

In the aftermath of the Democratic convention in early August, Kerry led among women, young voters, as well as low-income voters. But during August, many of these advantages were wiped out. The Democrat dropped 18 points among voters making less than $20,000 a year, and 17 points among young people age 18-29. But in polling over the past several days, Kerry has regained his lead in all of these groups and now holds a lead among those age 65 and older.

A similar seesaw pattern occurred among two contested constituencies. After the Democratic convention, Kerry led by eight points among independent voters and had battled Bush to a draw among white Catholics. In the aftermath of the Republican convention, Kerry trailed Bush by 12 points among independents and by 21 points among white Catholics. But he has now drawn even among independents and trails the president by only seven points among Catholics.

By contrast, President Bush has maintained a strong lead among some of his key base constituencies. After the Democratic convention, he led Kerry among white men by 18 percentage points, an advantage that ballooned to 30 points shortly after the Republican convention. Even with Kerry’s recent gains, the president still has a 19 point-lead in this group. Similarly, Bush’s advantage among upper-income voters is larger today than it was after the Democratic convention.

Among white evangelical Protestants, another important segment of Bush’s base, the events of the past month have had little impact. Bush led by 48 points in early August, by 45 points after the Republican convention, and by 53 points today (74% to 21%).

But the survey suggests that partisan battling over the military service records of Bush and Kerry has not helped the president’s standing among male military veterans. Just after the Democratic convention, Pew’s poll found Bush leading Kerry by a margin of 60% to 34% among veterans. In the days following the Republican convention, where Kerry’s qualifications to be commander-in-chief were questioned by many speakers, Bush’s lead among veterans was slightly narrower (56% to 38%). In the most recent polling, it has slipped to 51%-40%.

Kerry’s Support Still Negative

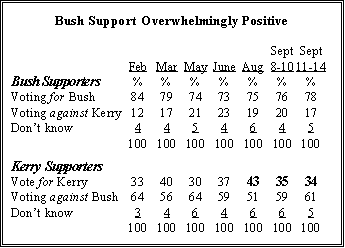
Throughout the campaign, Kerry’s support has been more anti-Bush than pro-Kerry, while Bush’s voters have been far more positive about his candidacy than negative about Kerry’s. In the aftermath of the Democratic convention in early August, Kerry registered an uptick in the percentage of his voters who said they are voting for him, but that shift has not lasted. Last month 43% of Kerry supporters said they mainly were voting for him, while 51% said they were mainly were voting against President Bush. In the current poll ­ both in early and later interviewing ­ negative voters outnumber positive voters by a bigger margin than in August.

By contrast, the overwhelming majority of Bush voters continue to say that their vote is mostly a vote for the president (78% in the most recent interviewing) rather than against Kerry (17%), a result essentially unchanged from the August poll.

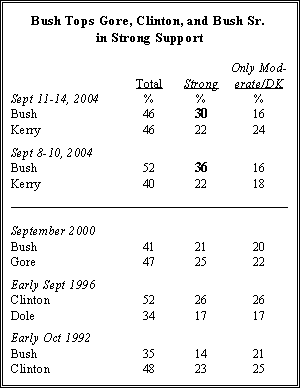
Even with some erosion of support in the second wave of September interviewing, Bush continues to command high levels of strong support: 30% say they support him strongly, down from 36% in the first part of the field period. His current level of strong support exceeds the level of intense support that Bill Clinton had at the same point in 1996 (26%), or that Clinton had against Bush’s father in October 1992 (23%). By contrast, fewer of Kerry’s voters say they strongly favor him ­ 22% now, down from 28% in the August survey following the Democratic convention.

More Swing Voters

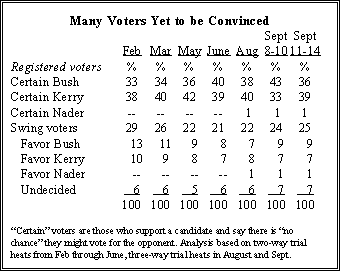
The survey finds a significant number of voters are still not certain about their choice. The percentage of registered voters who fall into the category of “swing voters” ­ those who only lean to one candidate, those who say they might change their mind, and those who are completely undecided ­ is slightly higher in the most recent interviewing (25%) than it was throughout the late spring and early summer (21-22%).

In the initial wave of polling (Sept. 8-10), Bush held an advantage among voters who are certain about their choice, having moved from 38% to 43% since the August poll. At the same time, the number of certain Kerry voters dropped from 40% in August to just 33% in the Sept. 8-10 survey. But Kerry has now regained most of the certain support he had lost (39% say they are sure to vote for him), while Bush’s certain support has dropped from 43% to 36%.

Section 2: Perception of the Candidates

A large majority of voters (72%) believe that Bush and Kerry take different positions from each other on the issues, compared with 19% who see their positions as similar. That is up slightly from June, when 68% saw differences between the candidates’ positions.

Far more voters see clear distinctions between the candidates than did so four years ago. At the end of the 2000 campaign, just 60% said George Bush and Al Gore took different positions on the issues. At this stage in 2000, 56% said the candidates took different positions.

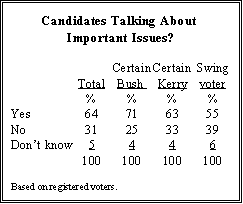
However, while more voters perceive differences in positions taken by the candidates, a sizable minority (31%) says the candidates are not talking about the issues that matter to them.

In September 2000, a smaller number (22%) said the candidates were not addressing the issues that matter to them, while 72% said they were talking about those issues.

Committed Bush voters are significantly more satisfied with the focus of the campaign than are Kerry voters or swing voters. Seven-in-ten Bush voters (71%) say the candidates are talking about the issues that are important to them, compared with 63% of certain Kerry voters. Slightly more than half of swing voters (55%) think the campaigns are talking about the important issues.

Kerry’s Bad Month

Last month, following the Democratic convention, Kerry enjoyed a sizable advantage over Bush on most domestic issues and held his own with the president on foreign policy and Iraq. The only issue on which he trailed Bush by a statistically significant margin was terrorism. For his part, Bush held a decided edge on most positive personal characteristics, including strong leadership.

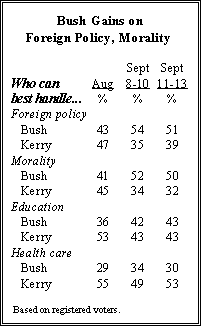
But the dynamics of the race shifted, and Bush moved out to significant leads on handling Iraq, improving the nation’s moral climate and making wise decisions about foreign policy. Equally important, Bush eliminated Kerry’s sizable edge on education. However, Bush has been unable to make inroads into Kerry’s big advantage on health care.

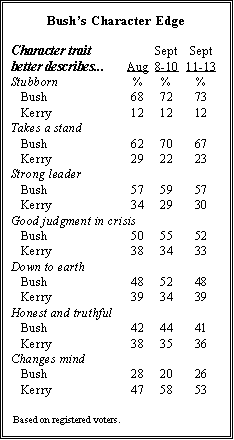
Bush also continues to lead on most key character traits. By a substantial margin, he is seen as the candidate “willing to take a stand, even if unpopular.” He also is widely viewed as “a strong leader”; the candidate who would “use good judgment in a crisis”; and “down to earth.” Kerry’s standing on these character traits has not improved since August, nor did they change significantly in the second wave of September polling.

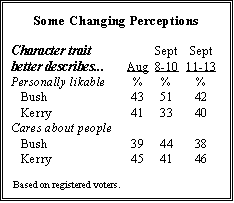
Where Kerry has made progress recently is on voter assessments of which candidate is “personally likable.” In August, about the same number said that phrase described Bush as said Kerry (43% vs. 41%), but Bush took an 18-point lead on this measure in polling conducted Sept. 8-10 (51%-33%). That lead dissipated in the most recent interviewing, and the candidates are again about even on this question. In addition, a plurality of voters now says the phrase “cares about people like me” better describes Kerry than Bush (46% vs. 38%). Bush had drawn virtually even with Kerry in the initial September polling, but Kerry has regained the small lead he held in August.

In terms of negative traits, the vast majority of voters continue to perceive Bush rather than Kerry as “stubborn.” And most say the phrase “changes his mind too much” applies to Kerry rather than Bush, though the number declined slightly in the second wave of interviewing.

Leadership Key for Bush

Typically, voters rate issues as the most important factor ­ both positively and negatively ­ in their decision on whom to support. This is certainly the case for Kerry ­ 52% of his supporters cite his stance on the issues as what they like most about him. And about the same number of Kerry’s opponents (53%) say his position on the issues is what they like least about him.

But Bush is a singular exception. Among his supporters, Bush’s leadership qualities are cited as often as his issue stances as the most important factor shaping their preference (41% leadership, 42% issues). Leadership also is frequently pointed to by Bush’s opponents as what they like least about him, although more mention issues (by 46% to 28%).

Dating back to 1992, no candidate’s support has been as heavily predicated on his leadership. In 1996, when Clinton ran for reelection, his supporters overwhelmingly cited his stance on issues as the most important factor (49% vs. 24% leadership). And when Bush’s father ran for a second term in 1992, a plurality of his supporters cited his experience. Issues were a relatively minor factor in support for Bush Sr. Just 19% mentioned issues, compared with 68% of Clinton’s supporters in the 1992 campaign.

Candidate Impressions

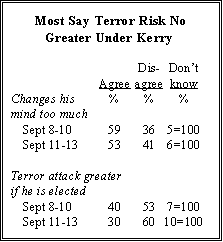
Overall, most voters agree with the statement: “John Kerry changes his mind too much.” But somewhat fewer people expressed this sentiment in the latter stage of polling than in the first phase (53% vs. 59%).

There also was a modest shift in opinion on the statement “The chance of another terrorist attack would increase if John Kerry were elected.” Voters disagreed with this statement by a 53%-39% margin in the survey’s first wave, but by a greater margin subsequently (60%-30%).

As might be expected, there is a considerable degree of partisanship in these attitudes. A solid majority of Bush supporters (64%) believes that the risk of terrorism would increase if Kerry is selected. Kerry’s supporters disagree (86%), and 56% completely disagree.

A narrow majority of all voters (52%) agree with the statement: “John Kerry is an anti-war candidate.” Roughly seven-in-ten certain Bush voters (71%) agree with the statement, but there is a substantial measure of division among committed Kerry voters: 39% agree that he is an “anti-war candidate,” while 53% disagree.

A similar pattern is evident in perceptions of Bush, which did not change significantly through the polling period. Roughly six-in-ten voters (58%) agree that it is “not clear what George W. Bush is going to do about Iraq if he is reelected.” While a large majority of Kerry voters agree with this statement (82%), so do a sizable minority of committed Bush voters (32%).

Majorities of voters also agree that Bush “seems like a real person rather than a politician,” and with the statement: “I like the fact that George W. Bush doesn’t over-complicate issues.” But committed Kerry supporters overwhelmingly disagree with both of these positive sentiments about Bush.

The statement “I worry that George W. Bush will take America into another war” triggers the most intense reaction among Kerry supporters. Nearly nine-in-ten certain Kerry voters agree with this statement, and 60% completely agree. Committed Bush supporters reject this statement by a five-to-one margin (80%-16%).

Swing Voters’ Impressions

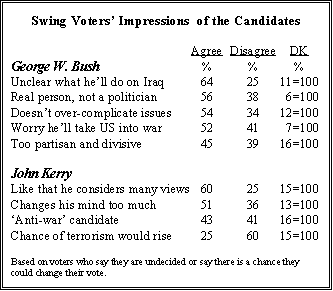
For the most part, swing voters are not significantly different from the rest of the electorate in their impressions of the candidates. For example, a large majority of swing voters (64%) agree with the statement: “It’s not clear what George Bush is going to do about Iraq if he is reelected.”

Most swing voters also agree with positive characterizations of Bush’s personality ­ that he does not over-complicate issues and that he is “a real person rather than a politician.”

Swing voters also tend to agree with the positive characterization of Kerry: “I like the fact that John Kerry considers many points of view when making a decision.” However, about half (51%) also believe he changes his mind too much. Just a quarter of swing voters agree that the chance of terrorism would increase if Kerry is elected president.

More Ideological Views of Bush and Kerry

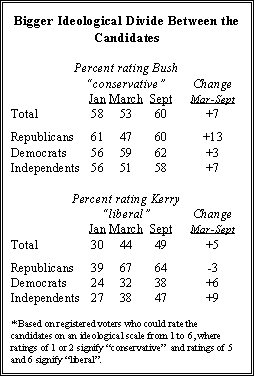
Somewhat more voters view Bush as conservative and Kerry as liberal than did so earlier this year. Among those who can rate President Bush, 60% place him at the conservative end of the six-point conservative-liberal scale (points 1 or 2). This is up from March of this year (53%). Similarly, slightly more voters place John Kerry on the liberal side of the scale (points 5 and 6) now (49%) than in March (44%).

Republicans, Democrats, and independents all see Bush as conservative, though more Republicans today than in March hold this perception (the percentage placing him on the conservative end of the scale rose from 46% to 59%). But views of Kerry’s ideological leanings are very different across partisan groups. Just 38% of Democrats see him as liberal (up six points since March), while 64% of Republicans view him this way (down 3 points). Almost half of independents now see him as liberal (47%, up from 38% in March).

Section 3: Views of the Campaign

Views of the campaign, which were already mostly positive in June, have improved over the summer. More voters think the campaign is important (90%) and informative (63%). And the number who say the campaign is interesting, rather than dull, has risen from 35% in June to 50% now.

Although voters are more engaged in the campaign, an increasing number also view it as excessively negative. Fully 62% say the campaign is too negative, up from 46% in June.

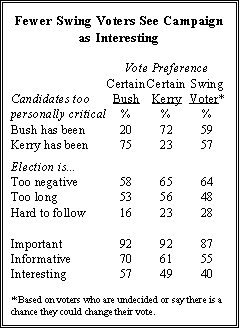
Since then, more voters believe that both candidates have been too personally critical but the change has been more apparent in evaluations of Bush. About half of voters (49%) now believe Bush has been too personally critical of Kerry, up from 33% in June. A similar percentage (52%) says Kerry has been too personally critical of Bush, compared with 44% in June.

This represents a significant change from the 2000 campaign. In early October 2000, just 29% said Al Gore was being too critical of Bush, while somewhat more (40%) felt Bush was being too personally critical of Gore. Current evaluations of the tone of the campaign are similar to the 1988 contest. In October 1988, 52% of voters felt that George Bush Sr. was being too critical of Michael Dukakis, while 45% said the same about Dukakis’s criticisms of Bush.

Swing Voters View the Campaign

As expected, Bush and Kerry supporters overwhelmingly blame the opposing candidate for being too personally critical. By contrast, swing voters blame both Bush and Kerry for being excessively critical (59% say Bush, 57% Kerry).

In general, the campaign perceptions of swing voters are not markedly different from those of committed voters. However, swing voters tend to find the campaign less interesting than other voters. Four-in- ten swing voters say the campaign is interesting, while 50% say it is dull. In addition, somewhat more swing voters than either Bush or Kerry voters say they find the campaign hard to follow. But swing voters are less likely than committed voters to say the campaign is too long.

Battleground Ad Wars

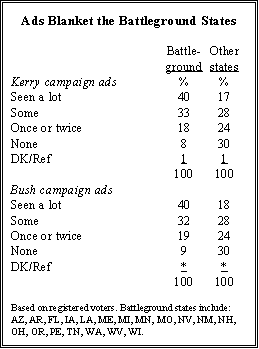
Ad penetration is extensive in this election, especially in the battleground states where most voters have seen at least some campaign ads.

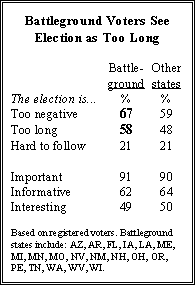
The greater visibility of the campaign in the battleground states appears to be contributing to voter weariness with the election. More voters in the battleground say the election is too long and too negative compared with those in other states.

Exposure to the campaign advertisements is reaching saturation level in the ad-intensive battleground states. Four-in-ten voters in battleground states say they have seen a lot of Kerry’s campaign commercials, and the same number (40%) report seeing a lot of Bush’s ads. That compares with 17% in other states who have seen a lot of Kerry ads, and 18% who report seeing a lot of Bush’s ads.

Three-in-ten voters in non-battleground states say they have seen no ads for Kerry and the same percentage of voters say they have not seen any of Bush’s ads. Fewer than one-in-ten voters in the battleground have not seen ads for Kerry and Bush.

Voter Weariness in the Battleground

The intensive exposure to the campaign in battleground states is taking its toll on the voters there. Nearly six-in-ten (58%) voters in battleground states say the campaign is too long compared with 48% of voters in other states.

Moreover, the intensity of negative campaign advertising in battleground states may be fueling perceptions that the election is too negative. Two-thirds of voters (67%) in the battleground states say the campaign is too negative, compared with 59% of voters elsewhere. But in battleground states, as in other states, about equal portions of voters say that Bush and Kerry have been too personally critical.

Other evaluations of the campaign are fairly similar across battleground and other states. Like voters elsewhere, about six-in-ten voters (62%) in battleground states say that the campaign is informative and about half (49%) view it as interesting. There is broad agreement among all voters that the election is important.

Frequent Ad Viewers

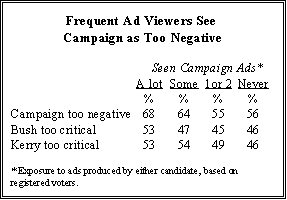
Voters who have seen a lot of campaign ads, regardless of where they live, tend to view the overall campaign as having an excessively negative tone.

More than two-thirds (68%) of frequent ad viewers describe the campaign as “too negative,” compared with 55% of those who have seen campaign ads only once or twice. Those who have seen a lot or some campaign ads are significantly more likely than less frequent viewers to say the campaign has been too negative.

Increased Engagement in Campaign

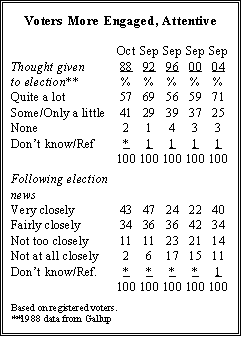
This presidential election continues to engage more voters than the campaigns of four and eight years ago. More than seven-in-ten voters (71%) say they have given quite a lot of thought to the coming election. That is a significant increase from comparable points in the two previous campaigns. Four years ago at this point in the campaign, about six-in-ten voters (59%) said they had given quite a lot of thought to the election. The current level of electoral attentiveness is similar to 1992, when 69% of voters reported giving the election a lot of thought. Engagement with the campaign is up across all subgroups this election.

Similarly, more voters are paying close attention to news about the election compared with past elections. Four-in-ten voters are paying very close attention to election news. This is almost double the number at this stage four years ago (22%), although somewhat below election news interest at this point in 1992 (47%). Overall, about three-quarters of voters (74%) are following election news at least fairly closely.

Hurricanes Top News Interest Index

News reports on hurricanes and the Russian school tragedy dominated this month’s news interest index. Fully half of Americans (52%) followed news of Hurricanes Charley, Frances and Ivan. As expected, attention to the storms was greatest in the South, with two-thirds tracking the hurricanes very closely.

Nearly as many Americans (48%) paid very close attention to the killing of Russian school children by Chechen rebels. Among past stories about Russia and the former Soviet bloc, only the opening of the Berlin Wall in 1989 (50% very closely), the breakup of the Soviet Union in 1991 (47%), and the Chernobyl nuclear accident in 1986 (46%) have attracted comparable interest.

Public interest in news from Iraq has risen over the past month. Nearly half of Americans (47%) followed reports on Iraq very closely, up from 39% in August.

Four-in-ten paid very close attention to election news in September. That is nearly twice the level of interest at comparable points in 2000 and 1996 (22% and 24%, respectively), but is lower than attention at this stage in the 1992 campaign (47% among registered voters).

Interest in the Republican convention (22%) was on par with attention to the Democratic convention last month (23%). Four-in-ten Republicans followed the convention very closely, which is nearly identical to the proportion of Democrats who paid close attention to their convention (41%). Similar proportions of swing voters followed these conventions (16% Republican convention, 17% Democratic convention).

Overall, one-quarter of Americans say they have paid very close attention to campaign ads in which ‘Swift Boat’ veterans have criticized John Kerry’s Vietnam service. Male veterans and committed Bush voters express strong interest in this story (40% and 34%, respectively). Democrats and Republicans are about even in their levels of attention, although conservative Republicans are paying the most attention (36%).

Slightly fewer Americans (21%) closely followed reports on President Bush’s service in the National Guard during the Vietnam War. This story has attracted the same level of interest from certain Kerry voters (34% very closely) as the Swift Boat reports have drawn from committed Bush voters. Significantly fewer male veterans (28%) are following this story than are following stories about the ‘Swift Boat’ criticisms of Kerry.

About four-in-ten Americans (39%) are following news about the economy very closely, which is on par with measures over the past three years. A quarter of Americans tracked news from the summer Olympics in Athens very closely, which far below the 45% who paid close attention to the summer games in Atlanta in 1996.

Roughly one-in-five Americans (19%) followed former President Bill Clinton’s heart surgery. This story drew much more interest from Democrats than Republicans (31% vs. 12%).

More than twice as many African Americans as whites followed news on Clinton’s surgery very closely (39% vs. 17%), and blacks showed more interest in this story than any other demographic group.

About the Survey

Results for the September 2004 News Interest Index survey are based on telephone interviews conducted under the direction of Princeton Survey Research Associates International among a nationwide sample of 2,494 adults, 18 years of age or older, during the period September 8-14, 2004. The survey was conducted in two waves: September 8-10, with 1,219 adults (and 970 registered voters); September 11-14, with 1,275 adults (and 1,002 registered voters). Many questions in the report were asked only during the period of September 8-13 (a total of 2,003 adults and 1,580 registered voters); a much shorter questionnaire was used for interviewing on the night of September 14.

For results based on the total sample of 2,494 adults, one can say with 95% confidence that the error attributable to sampling is plus or minus 2.5 percentage points. For results based on registered voters (N=1,972) the sampling error is plus or minus 2.5 percentage points; sampling error for registered voters interviewed Sept. 8-10 (N=970), and for those interviewed Sept. 11-14 (N=1,002) is plus or minus 3.5 percentage points. For results based on interviews conducted Sept. 8-13 with either Form 1 (N=994) or Form 2 (N=1,009), the sampling error is plus or minus 3.5 percentage points. If based on Form 1 or Form 2 registered voters only (N=773 or N=807), the sampling error is plus or minus 4 percentage points.

In addition to sampling error, one should bear in mind that question wording and practical difficulties in conducting surveys can introduce error or bias into the findings of opinion polls.

Survey Methodology in Detail

The sample for this survey is a random digit sample of telephone numbers selected from telephone exchanges in the continental United States. The random digit aspect of the sample is used to avoid “listing” bias and provides representation of both listed and unlisted numbers (including not-yet-listed). The design of the sample ensures this representation by random generation of the last two digits of telephone numbers selected on the basis of their area code, telephone exchange, and bank number.

The telephone exchanges were selected with probabilities proportional to their size. The first eight digits of the sampled telephone numbers (area code, telephone exchange, bank number) were selected to be proportionally stratified by county and by telephone exchange within county. That is, the number of telephone numbers randomly sampled from within a given county is proportional to that county’s share of telephone numbers in the U.S. Only working banks of telephone numbers are selected. A working bank is defined as 100 contiguous telephone numbers containing three or more residential listings.

The sample was released for interviewing in replicates. Using replicates to control the release of sample to the field ensures that the complete call procedures are followed for the entire sample. The use of replicates also insures that the regional distribution of numbers called is appropriate. Again, this works to increase the representativeness of the sample.

At least 10 attempts were made to complete an interview at every sampled telephone number. The calls were staggered over times of day and days of the week to maximize the chances of making a contact with a potential respondent. All interview breakoffs and refusals were re-contacted at least once in order to attempt to convert them to completed interviews. In each contacted household, interviewers asked to speak with the “youngest male 18 or older who is at home.” If there is no eligible man at home, interviewers asked to speak with “the oldest woman 18 or older who is at home.” This systematic respondent selection technique has been shown empirically to produce samples that closely mirror the population in terms of age and gender.

Non-response in telephone interview surveys produces some known biases in survey-derived estimates because participation tends to vary for different subgroups of the population, and these subgroups are likely to vary also on questions of substantive interest. In order to compensate for these known biases, the sample data are weighted in analysis.

The demographic weighting parameters are derived from a special analysis of the most recently available Annual Social & Economic Supplement data from the Census Bureau (March 2003). This analysis produced population parameters for the demographic characteristics of households with adults 18 or older, which are then compared with the sample characteristics to construct sample weights. The analysis only included households in the continental United States that contain a telephone. The weights are derived using an iterative technique that simultaneously balances the distributions of all weighting parameters.