Religious Beliefs Underpin Opposition to Homosexuality
Republicans Unified, Democrats Split on Gay Marriage
About Pew Research Center
Pew Research Center is a nonpartisan, nonadvocacy fact tank that informs the public about the issues, attitudes and trends shaping the world. It does not take policy positions. The Center conducts public opinion polling, demographic research, computational social science research and other data-driven research. It studies politics and policy; news habits and media; the internet and technology; religion; race and ethnicity; international affairs; social, demographic and economic trends; science; research methodology and data science; and immigration and migration. Pew Research Center is a subsidiary of The Pew Charitable Trusts, its primary funder.
Religious Beliefs Underpin Opposition to Homosexuality
Republicans Unified, Democrats Split on Gay Marriage
Introduction and Summary
Opposition to gay marriage has increased since the summer and a narrow majority of Americans also oppose allowing gays and lesbians to enter legal agreements that fall short of marriage. Moreover, despite the overall rise in tolerance toward gays since the 1980s, many Americans remain highly critical of homosexuals and religious belief is a major factor in these attitudes.
A 55% majority believes it is a sin to engage in homosexual behavior, and that view is much more prevalent among those who have a high level of religious commitment (76%). About half of all Americans have an unfavorable opinion of gay men (50%) and lesbians (48%), but highly religious people are much more likely to hold negative views.
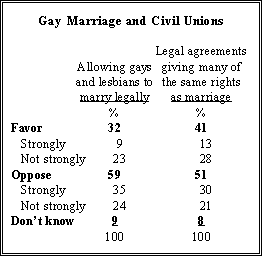
Religiosity is clearly a factor in the recent rise in opposition to gay marriage. Overall, nearly six-in-ten Americans (59%) oppose gay marriage, up from 53% in July. But those with a high level of religious commitment now oppose gay marriage by more than six-to-one (80%-12%), a significant shift since July (71%-21%). The public is somewhat more supportive of legal agreements for gays that provide many of the same benefits of marriage; still, a 51% majority also opposes this step.
A new national survey of 1,515 adults, conducted Oct. 15-19 by the Pew Research Center for The People & The Press and the Pew Forum on Religion and Public Life finds that homosexuality in general – not merely the contentious issue of gay marriage - is a major topic in churches and other houses of worship. In fact, clergy are nearly as likely to address homosexuality from the pulpit as they are to speak out about abortion or prayer in school, say people who attend church regularly.
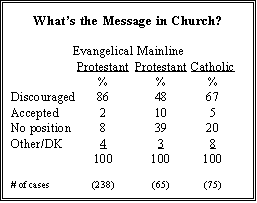
The clergy in evangelical churches focus considerably more attention on homosexuality and address it far more negatively than do ministers and priests in other denominations. Two-thirds of evangelical Protestants who attend church services at least once a month say their ministers speak out on homosexual issues, compared with only about half of Catholics (49%) and just a third of mainline Protestants (33%). And compared with others who attend services where homosexuality is discussed, substantially more evangelicals (86%) say the message they are receiving is that homosexuality should be discouraged, not accepted.
The poll finds that people who hear clergy talk about homosexuality are more likely to have highly unfavorable views of gays and lesbians. This is especially the case in evangelical churches. Fully 55% of evangelicals who attend services where the issue of homosexuality is addressed have very unfavorable views of homosexuals. This compares with 28% of those who regularly attend services in non-evangelical Protestant and Catholic churches where clergy discuss homosexuality. Similarly, evangelicals who hear sermons on this issue are much more apt than others to believe that gays and lesbians can change their sexual orientation and to view homosexuality as a threat to the country.
The survey underscores how the debate over societal acceptance of homosexuality has shifted since the mid-1980s. The public has moved decisively in the direction of tolerance on many questions; in particular, discrimination against homosexuals is now widely opposed. This is seen in long-term trends in surveys conducted by the Pew Research Center and by the Gallup Organization. And the current survey shows that a majority of Americans (54%) feel that gay and lesbian couples can be as good parents as heterosexual couples.
Yet as public attention has turned to questions of gay marriage and as homosexuals have become far more visible in society and the entertainment media there have been some signs of a backlash. Roughly three-in-ten Americans (31%) say greater acceptance of gays would be a bad thing for the country, up from 23% in a 2000 survey conducted by the Kaiser Family Foundation. And nearly half the public (48%) thinks the entertainment media present too many gay themes and characters, compared with 37% in the same 2000 survey.
In light of this changing climate of opinion, the importance of gay marriage in the 2004 elections remains unclear. But there is evidence that this issue could become problematic for the Democratic presidential nominee. Voters who support President Bush are largely of one mind on this issue: More than three-quarters (78%) of voters who favor the president’s reelection in 2004 oppose gay marriage; more than half (53%) strongly oppose the idea. But voters who prefer to see a Democrat elected in 2004 are divided 46% favor gay marriage, 48% oppose. A substantial minority of these Democratic-leaning voters strongly oppose gay marriage (25%).
The survey also shows that Americans remain deeply divided over the essential cause and nature of homosexuality. A 42% plurality believes that being a homosexual “is just the way that some people prefer to live,” no change from a Los Angeles Times survey conducted in 1985. But there has been a rise in the percentage who say homosexuality is “something that people are born with” from 20% in the Times survey to 30% currently. The public also is split on the question of whether a gay person’s sexual orientation can be changed 42% say it can, the same number disagrees.
Still, most Americans say they are comfortable interacting socially with homosexuals. Just one-in-five say they are uncomfortable around homosexuals, while 76% say they do not mind being around gays. Highly religious white evangelicals are more likely to say they are uncomfortable being around homosexuals a third express that view. Even so, six-in-ten in that group say it does not bother them to be around homosexuals.
Part 1: Opinion of Homosexuals
Views of Gay Men, Lesbians
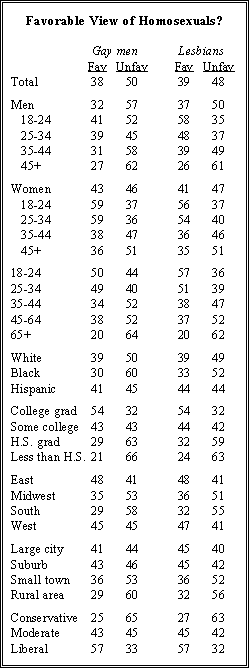
Roughly half of the public expresses an unfavorable opinion of gay men (50% unfavorable) and lesbians (48% unfavorable). Nearly one-in-three (29%) have a very unfavorable opinion of gay men, and 26% have a very unfavorable opinion of lesbians.
In general, young people have more favorable views of homosexuals than do older people. Half of those under age 25 have a favorable view of gay men (50% favorable to 44% unfavorable) and a majority have a favorable view of lesbians (57% favorable, 37% unfavorable). Women tend to express more favorable opinions of both gay men and lesbians, and this is especially true among very young people. Among men age 18-24, opinions about gay men are far more negative (52% unfavorable) than about lesbians (35% unfavorable).
Majorities of college graduates hold favorable views of both gay men and lesbians (54% each), while opinions of those with less education are considerably more negative. There also are regional differences in attitudes toward homosexuals, with people in the East and West expressing the most positive views of gay men and lesbians. And there is a significant difference between urban and rural areas of the country, with unfavorable views much more intense in the latter. Four-in-ten people living in rural areas say they have a very unfavorable opinion of gay men, twice as many as among residents of large cities.
Seculars’ Positive Opinions of Gays
In no major religious group does a majority express favorable views of gay men or lesbians. By comparison, six-in-ten seculars those who say they have no religious affiliation and rarely, if ever, attend religious services hold positive views of homosexuals. (The survey contained too few Jews for a reliable estimate).
Among white mainline Protestants and Catholics, opinion is divided: 43% of mainline Protestants and 46% of Catholics have a favorable opinion of gay men; their views of lesbians are comparable.
White evangelicals are much more negative, with 69% unfavorable (including 47% very unfavorable) and only 22% favorable. Black Protestants also hold generally unfavorable views (62% unfavorable, 27% favorable).
Messages From the Pulpit
A majority of churchgoers report hearing about homosexuality from their clergy: 55% of those who attend services at least once or twice a month say their clergy talk about issues related to homosexuality, and 41% say they discuss laws regarding homosexuals. The percentage hearing about laws related to homosexuals is up slightly from 1996, when 36% reported this topic mentioned by clergy.
Among subjects addressed by clergy, homosexuality is about as common as prayer in the schools (58%) and the situation in Iraq (53%), and somewhat less common than abortion (63%). It is a more commonly mentioned topic than either the death penalty (28%) or candidates and elections (26%). And 40% of churchgoers say they have heard about the recent controversy over the Ten Commandments monument in Alabama.
The subject of homosexuality is heard in church much more commonly by white evangelicals than by white mainline Protestants or Catholics. Two-thirds (66%) of white evangelicals say their clergy talk about issues related to homosexuality. This is considerably higher than the incidence in mainline Protestant (36%) or Catholic (44%) churches. Black churchgoers also are much less likely than white evangelicals (42%) to say their clergy discuss the issue.
The vast majority of regular churchgoers who hear about homosexuality in church say the message is a negative rather than a neutral or positive one: overall, 76% say their clergy discourage homosexuality, while 4% say clergy favor acceptance of it; only 16% say their clergy take no position when they speak about the issue. Neutral or positive messages about homosexuality are much more common in mainline Protestant than in evangelical churches.
Is Homosexuality a Sin?
Most Americans (55%) believe that homosexual behavior is a sin, while 33% disagree. Strongly religious people are far more likely to see homosexual behavior as sinful than are the less religious. Nearly nine-in-ten (88%) highly committed white evangelicals say homosexual behavior is sinful, and 64% of committed white Catholics agree. Nearly three-quarters of black Protestants (74%) see homosexual conduct as sinful. But just 18% of secular respondents feel this way.
But most of those who view it as sinful do not think it is any more sinful than adultery; 44% overall (80% of those who think it is a sin) say homosexual behavior and adultery are equally sinful. Even among committed white evangelicals, fewer than one-in-ten (7%) rate homosexual behavior as more sinful than adultery.
No Agreement on Why Some Are Gay
Asked why some people are homosexual, 42% say it is “just the way that some people prefer to live,” compared with 30% who think homosexuality is something people are born with and 14% who believe it develops because of the way people are brought up. The view that homosexuality is innate is more prevalent now than in 1985, when 20% believed that homosexuality is something people are born with.
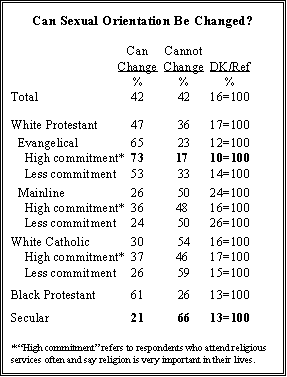
The public divides evenly 42% to 42% on the question of whether a gay or lesbian person’s sexual orientation can be changed or not; 16% have no opinion. Together, nearly one-quarter (24%) believe that people are born homosexual and that they cannot change their orientation. The same percentage (24%) believe that homosexuality is a way that some people prefer to live and that sexual orientation can be changed. The rest of the public holds some mix of these views.
In general, better-educated people are more likely than those with less education to see homosexuality as innate and unchangeable rather than a lifestyle choice, though even among college graduates there is considerable division of opinion. And politically, twice as many liberals as conservatives (46% versus 22%) say people are born homosexual.
But the biggest differences on this question are seen among religious groups. More than half of highly committed white evangelicals (53%) and 60% of black Protestants say that homosexuality is just a way that some people prefer to live, and just 14% say it is something that people are born with. Similarly, 73% of committed white evangelicals think homosexuals can change their sexual orientation; 61% of black Protestants agree. By comparison, 54% of white Catholics and half of white mainline Protestants think homosexuals cannot change their orientation, a view shared by two-thirds (66%) of seculars.
Belief that homosexuality is immutable is strongly associated with positive opinions about gays and lesbians even more strongly than education, personal acquaintance with a homosexual, or general ideological beliefs. For example, about two-thirds of people who think homosexuality can be changed (68%) have an unfavorable opinion of gay men. By contrast, nearly six-in-ten (59%) of those who think homosexuality cannot be changed have a favorable opinion. This pattern holds even among groups of people who are similar in religious beliefs, partisan affiliation, and other factors.
Gays and Lesbians in Society
Most people do not think that greater societal acceptance of gays and lesbians would be a bad thing for the country, but neither do they believe it would be a good thing. A 42% plurality says that greater acceptance of gays would not make much difference, while 31% say it would be bad for the country; that is a modest increase from a Kaiser Family Foundation survey in 2000 (23%). Fewer than a quarter (23%) think greater acceptance of gays would be good for the country, down from 29% in 2000.
Nearly half of the public (48%) expresses the view that the entertainment media are including too many gay themes and characters these days compared with 40% who believe the media are providing the right amount of gay-themed content. These views are strongly related to religious tradition and practice, and to partisanship and ideology. Fully 72% of conservative Republicans think there are too many gay themes and characters in the media; only one-quarter of liberal Democrats agree.
Most Have a Gay Acquaintance or Relative
Six-in-ten Americans say they have a homosexual friend, colleague, or family member. Women are more likely than men to say they have a gay acquaintance or relative (67% vs. 53%). And more highly educated people than those with less education say they know or are related to someone who is gay: Nearly three-quarters of college graduates (73%) say they have a friend or relative who is gay compared with 52% of those with a high school education.
Democrats and Republicans differ very little on this question, but liberals (71%) are far more likely to have contact with homosexuals than are conservatives (54%). There are relatively small differences between religious groups in the likelihood of having a homosexual friend, family member, or colleague. But among seculars, 72% say they know someone who is homosexual.
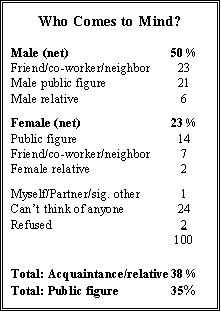
When asked to name the first homosexual to come to mind, 74% responded, with about equal numbers naming either someone they knew a friend, relative, or associate or a public figure. About twice as many males as females were named, yet a female comedian and talk show host Ellen DeGeneres was by far the most commonly mentioned public figure.
Half of those interviewed mentioned a male, including 23% who mentioned a friend, co-worker, or neighbor. About the same number 21% mentioned a male public figure or entertainer. Only 6% mentioned a male relative. By contrast, less than one-quarter (23%) mention
ed a female, with more mentioning public figures (14%) than individuals the respondent actually knew (7% mentioned a friend, co-worker, or neighbor, and 2% mentioned a relative). One percent volunteered that they or their partner were the first homosexual that came to mind.
People who named someone they knew personally generally had more favorable attitudes toward gay men and lesbians than did people who mentioned public figures. People who could not name any homosexual had the most negative opinions.
Few Concerned By Being Around Gays
A large majority of those interviewed say it does not make them uncomfortable to be around homosexuals. Overall 76% say they are not uncomfortable; 20% say they are. Discomfort is greater among older respondents (29% of people age 65 and older), those living in rural areas (29%), conservative Republicans (30%), and highly committed white evangelicals (34% uncomfortable around gays and lesbians).
Perceptions and Stereotypes
Despite the fact that more Americans have negative than positive views of gays and lesbians, majorities do not see homosexuals as less happy than other people or less likely to form stable, long-term relationships. Nearly six-in-ten (57%) reject the idea that homosexuals are not as happy as heterosexuals, while a smaller majority (52%) believes gays are as likely as other people to have stable relationships.
People who have homosexual friends, family members, or colleagues are more likely to express opinions about these issues, and they generally view gays in a more positive light compared with those who do not have gay acquaintances and relatives.
For the most part, Americans do not subscribe to the stereotypical view that gay men have a better sense of style than heterosexual men. People who have gay friends or relatives are more likely than those who don’t to feel that gay men have a better sense of style, though opinion among this group is divided.
There is a gender gap in opinions on whether gay men have a better sense of style than heterosexual men. Four-in-ten women (41%) think that they do, compared with 26% of men. Differences over this perception are especially pronounced among younger people. Half of women under age 50 think that gay men have a superior sense of style compared with about a third of men under 50 (32%).
Part 2: Gay Marriage
Gay Marriage Opposed
By nearly two-to-one, more Americans oppose (59%) than favor (32%) legalizing gay marriage. This reflects something of a backlash from polls conducted earlier in the year, before the Supreme Court’s ruling in June that struck down state laws against sodomy. In a July survey shortly after that decision, the public opposed gay marriage by a smaller margin (53%-38%).
Strong opposition to the idea of gay marriage is the plurality position. Among those who oppose the idea, nearly six-in-ten say they feel strongly about it (35% of the total population express this view.) Among those who favor gay marriage, fewer than three-in-ten say they strongly support the proposal (9% of the total.)
The survey also finds that most who are opposed to gay marriage believe that it would be enough to prohibit it by law, and that a constitutional amendment is not necessary. While 59% oppose gay marriage, just 10% say the Constitution should “be amended to ban gay marriage” in a follow-up question. Instead, 42% say it is “enough to prohibit gay marriage by law without changing the Constitution.”
This is notably different from a number of recent surveys which have found majorities supporting such an amendment when no alternative of a legal prohibition is offered. For example, a July CNN/USA Today/Gallup survey found 50% favoring, and 45% opposing, “a constitutional amendment that would define marriage as being between a man and a woman, thus barring marriages between gay or lesbian couples.”
Young People More Supportive of Gay Marriage
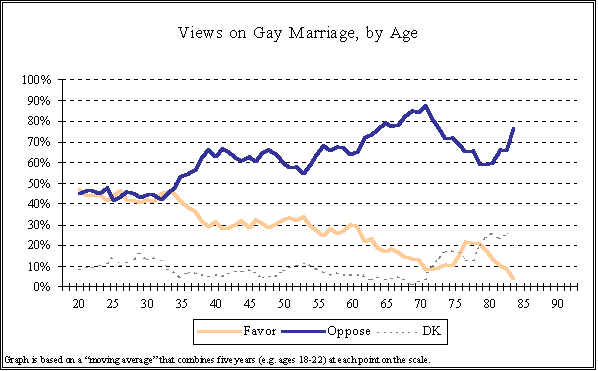
A closer look at the opinions of various demographic groups on this issue shows that young people, especially those in their late teens and twenties, are more supportive of gay marriage than are older Americans. Even this youngest group of Americans do not, on balance, favor this idea; rather, they are divided. But that is in stark contrast to people in their forties and fifties, where twice as many oppose gay marriage as favor it. Among those in their sixties and seventies, opposition outnumbers support by as much as four-to-one.
People in their early thirties today have a relatively favorable view of gay marriage and their views are similar to those of younger generations. But those in their late thirties are much more opposed; in fact, opposition is as widespread in this group as among people in their forties and fifties.
Education a Key Among Older Americans
Overall, Americans with college degrees are divided almost evenly over the issue of gay marriage (49% oppose, 44% favor) while those without oppose the idea by well over two-to-one (63% to 27%). Education is a particularly important factor among older generations.
College graduates age 65 and older are more than three times as likely to favor gay marriage than are seniors with less education (33% to 9%). Among those age 50-64, college grads are twice as likely to favor gay marriage as their less educated counterparts (43% to 21%). By comparison, education makes relatively little difference among those under age 30, where support for gay marriage runs highest. Since younger generations are more likely to have college degrees than older, this education gap contributes to the overall size of the generation gap on gay marriage.
While majorities of both genders are opposed to the idea of gay marriage, men express somewhat more opposition than women. This gender gap exists across all age ranges, with men consistently four-to-eight percent more likely to oppose gay marriage than women.
Not surprisingly, the most religious Americans are the least likely to favor gay marriage. Nearly half of Americans with relatively low religious commitment approve of allowing homosexual couples the right to marry, compared with just 17% of those who are more religious. This gap along religious lines exists across all age groups.
The issue of gay marriage has a clear political component. Both Democrats and independents (39% each) are twice as likely as Republicans (18%) to approve of gay marriage. This political gap between Democrats and Republicans exists across all age levels.
Attitudes about gay marriage are closely linked to where a person lives with opposition significantly higher in the South, and in rural areas of the country. But there is little racial divide over gay marriage. Both whites and blacks oppose gay marriage by roughly two-to-one most Hispanics also oppose the idea, but by a smaller margin (51% to 36%).
Perceptions of homosexuality are closely related to views about gay marriage. In particular, people who believe homosexuality is a choice, as opposed to a trait people are born with, are far more opposed to gay marriage, as are people who believe homosexuals can change.
Overall, most people (55%) who think homosexuality is something people are born with favor gay marriage, compared with just 21% of those who think it is just the way that some people prefer to live. Similarly, 49% of those who think homosexuality cannot be changed favor gay marriage, compared with 19% of those who think it can.
Personal contact with homosexuality is also a key factor in shaping people’s views on this policy issue. Americans who have a friend, colleague or family member who is gay are roughly twice as likely to favor gay marriage as those who do not (39% to 21%). This gap exists across all age groups, but does not override the importance of age in shaping peoples’ views. Among both the youngest and oldest cohorts, those who know someone who is gay are about twice as likely to favor gay marriage as those who do not. Among those under age 30, about half (49%) of those who know a gay person are supportive of gay marriage compared with 27% of those who do not have a gay acquaintance or relative. But among those age 65 and older, just 20% of those who know a homosexual favor gay marriage, compared with 10% who are not acquainted with a gay person.
Moral Objections Cited Most
The most common reasons given for objecting to gay and lesbian marriage are moral and religious. Asked in an open-ended format their main reason for opposing gay marriage, more than a quarter of opponents (28%) explicitly cite the view that homosexuality is immoral, a sin, or inconsistent with biblical teaching, and another 17% say the idea simply is in conflict with their religious beliefs. One-in-five who oppose gay marriage explain their position in less moral, and more literal terms, saying that the definition of marriage involves a man and a woman (16%), or that the purpose of marriage is reproduction (4%).
Other issues that frequently come up in the debate over gay marriage are not the primary factors in the public’s mind. Just 1% say they oppose gay marriage on the grounds that it undermines traditional families, and just 1% refer to possible legal or governmental problems, or the possibility of people taking advantage of such laws to get economic benefits.
Impact on Families a Concern
Although few people volunteer the impact gay marriage might have on the traditional family structure as the main reason they oppose such unions, these concerns do resonate with the public. More than half of Americans (56%) believe that allowing gay and lesbian couples to legally marry would undermine the traditional American family, and four-in-ten say they completely agree with this argument. Fully 76% of those who oppose gay marriage believe it would undermine the traditional American family, and 61% feel strongly about it.
A somewhat greater percentage say that gay marriage would go against their religious beliefs (62%). More than eight-in-ten opponents of gay marriage (82%) say it runs counter to their religious beliefs, with 73% completely agreeing with that sentiment. While concerns about religion and family are widespread, only a minority classify gay parents as unfit, and very few believe that the society has the right to regulate sexual behavior. By a 54% to 37% margin, most agree that gay and lesbian couples can be as good parents as heterosexual couples, and by 80% to 13% the vast majority say that society should not put any restrictions on sex between consenting adults in the privacy of their own home.
Overall, an analysis of the beliefs, perceptions and values that shape support and opposition to gay marriage finds that while religion is very important, other views about diversity, parenting, and the nature of homosexuality itself have a strong impact on opinions about gay marriage as well. This balance is also reflected in the fact that 45% of those opposed to gay marriage mentioned religious reasons while about the same number gave other justifications.
Seniors’ Objections to Gay Marriage: A Closer Look
While opposition to gay marriage is most widespread among older generations, this does not necessarily reflect greater moral concerns among older people, or that they see the issue of homosexuality through a predominantly religious lens. People over age 65 are no more likely to say that gay marriage “goes against my religious beliefs” than are younger respondents, and they express no greater concern about gay marriage undermining the traditional American family.
Rather, the biggest generational differences in views about homosexuality have to do with more practical, and less moralistic, concerns. A plurality of seniors worry that gays and lesbians cannot be as good parents as other couples (by a 47% to 37% margin). By comparison, people under age 30 believe gay couples can parent just as well by a 69% to 29% margin.
Older Americans also are more likely than young people to harbor doubts about how happy gay people are. And while people under age 30 say greater acceptance of homosexuality would be good for the country, not bad (by a 30% to 19% margin), older Americans tend to disagree, with 41% saying it would be bad for the country, and just 9% saying it would be good.
To a large extent, these differences reflect the fact that older Americans particularly those over age 65 have had far less contact with homosexual people, and have far less firmly rooted beliefs and perceptions about homosexuality. Fully half of seniors could not think of the name of a single homosexual person, either in their own lives or a celebrity. This compares with only 19% of those under age 50 and 27% of those age 50 to 64. And older Americans are far less likely to say they have a friend, relative or colleague who is gay. When asked their perceptions of and views on homosexuality, people over age 65 are much more likely to say they have no opinion.
The greater opposition to gay marriage among older Americans reflects this greater uncertainty and lack of familiarity more than it does any moral or religious opposition to the idea. In fact, people over age 65 are no more likely to cite moral or religious reasons than are younger respondents when asked to explain why they oppose gay marriage. Instead, older generations tend to explain their position either in reference to the definition of marriage being between a man and a woman or for the purposes of having children, or with vague references to homosexuality just being wrong or not normal.
Civil Unions Also Opposed
Granting some legal rights to gay couples is somewhat more acceptable than gay marriage, though most Americans (51%) oppose that idea. Public views on giving legal rights to gay and lesbian couples depend a good deal on the context in which the question is asked. On the survey, half of respondents were asked their views on civil unions after being asked about gay marriage, and half were asked the questions in the reverse order. When respondents have already had the opportunity to express their opposition to gay marriage on the survey, more feel comfortable with allowing some legal rights as an alternative. But when respondents are asked about legal rights without this context, they draw a firmer line.
This context difference has little effect on core support and opposition to gay marriage itself, which is opposed by nearly two-to-one regardless of how the questions are sequenced. But opponents of gay marriage are much more willing to accept the idea of some legal rights after they have had the opportunity to express their opposition to gay marriage. The percent favoring legal rights rises to 45% in this context, while just 37% favor the idea alone. Put in other words, opponents of gay marriage are much more likely to accept allowing some legal rights when they have already had the opportunity to express their opposition to gay marriage itself.
Those who oppose gay marriage but favor allowing legal rights to gay and lesbian couples offer different explanations for their opposition to gay marriage than those who oppose both ideas. People who oppose both gay marriage and the option of civil unions are much more likely to explain their position in terms of homosexuality being morally wrong, a sin, or simply unnatural. People who oppose gay marriage but favor the idea of giving gay and lesbian couples legal rights outside o
f marriage say they oppose gay marriage because the definition of marriage is a union between a man and a woman, that the purpose of marriage is to have children or that allowing gay marriage might undermine the traditional family structure.
While allowing legal rights is acceptable to a greater number of Americans than marriage itself, there is no evidence that this distinction has particular relevance to specific groups. While overall levels of support vary dramatically by age, religion and religiosity, region, and political party, the gap between support for gay marriage and legal rights varies little.
Long-Term Trend: Growing Tolerance
Numerous survey organizations have tracked public attitudes toward homosexuality in a variety of ways, and virtually all measures show the same pattern. While many Americans harbor concerns about legalizing gay marriage, the public is a much more tolerant toward homosexuals than it was twenty years ago.
In 1987, the Times Mirror Center for the People and the Press found Americans divided over whether school boards should (51%) or should not (42%) be allowed to fire teachers based on their sexual preference. Today, Americans reject this idea by nearly two-to-one (62% to 33%). While significant differences remain across partisan, religious, and generational lines, all segments of American society have become less willing to allow this kind of explicit job discrimination, even in schools.
Since 1973, the General Social Survey, conducted by the National Opinion Research Center at the University of Chicago, has been tracking whether Americans believe sexual relations between adults of the same sex are always wrong, almost always wrong, sometimes wrong, or not wrong at all. The most recent wave of the GSS in 2002 found a slight majority (53%) saying that homosexual relations are always wrong, down from 74% as recently as 1987. The proportion saying homosexual relations are not wrong at all has nearly tripled, from 12% to 32%, over the same time span.
Throughout the nearly thirty years in which the GSS has been tracking public attitudes, very few Americans see shades of gray on the issue of homosexuality. At no point has more than 15% of the public said that sexual relations are “almost always” or “sometimes” wrong. In every survey, more than eight-in-ten Americans have said homosexuality is either always or never wrong.
The Gallup Organization has tracked two general items about homosexuality for more than twenty years, and both also show increasing acceptance of homosexuals and homosexuality. In May 2003, Gallup found 88% saying that homosexual men and women should have equal rights in terms of job opportunities, up from 71% in 1989 and 56% in 1977. Asked whether homosexuality should be considered an acceptable lifestyle or not, 54% said “yes” in May of this year, up from 34% in 1982. However, Gallup measured some backlash on this item following the Supreme Court decision in June regarding state sodomy laws. The percent saying homosexuality should be considered an acceptable lifestyle in Gallup’s July survey fell to 46%.
Global Views on Homosexuality
While Americans have become more accepting toward homosexuality over the past few decades, Americans are significantly less tolerant than citizens of most other advanced democracies in Europe and North America. In 2002, the Pew Global Attitudes Project surveyed public attitudes across a wide range of social and political issues in 44 nations, and found that the question of homosexuality highlights a stark global divide over social values.
Openness toward homosexuality is most widespread in the Western European nations of France, Britain, Italy and Germany, where more say homosexuality should be accepted by society than not by well over three-to-one. Residents of Canada, as well as the Czech and Slovak Republics also take an overwhelmingly accepting position on the issue of homosexuality.
Americans, by comparison, are split on this issue. A bare majority of Americans (51%) believe homosexuality should be accepted, while 42% disagree. In this regard, American attitudes have less in common with Western Europe or Canada than with Latin America, where opinion is also largely divided.
Across Africa, and in most predominantly Muslim nations such as Indonesia, Bangladesh, Pakistan, Uzbekistan, Jordan, Lebanon and Turkey, lopsided majorities believe homosexuality should not be accepted by society. There is similar opposition to social acceptance in India, Vietnam and South Korea.
Methodology
Results for the survey are based on telephone interviews conducted under the direction of Princeton Survey Research Associates among a nationwide sample of 1,515 adults, 18 years of age or older, during the period October 15-19, 2003. Based on the total sample, one can say with 95% confidence that the error attributable to sampling and other random effects is plus or minus 3 percentage points. For results based on either Form 1 (N=735) or Form 2 (N=780), the sampling error is plus or minus 4 percentage points.
In addition to sampling error, one should bear in mind that question wording and practical difficulties in conducting surveys can introduce error or bias into the findings of opinion polls.
Survey Methodology in Detail
The sample for this survey is a random digit sample of telephone numbers selected from telephone exchanges in the continental United States. The random digit aspect of the sample is used to avoid “listing” bias and provides representation of both listed and unlisted numbers (including not-yet-listed). The design of the sample ensures this representation by random generation of the last two digits of telephone numbers selected on the basis of their area code, telephone exchange, and bank number.
The telephone exchanges were selected with probabilities proportional to their size. The first eight digits of the sampled telephone numbers (area code, telephone exchange, bank number) were selected to be proportionally stratified by county and by telephone exchange within county. That is, the number of telephone numbers randomly sampled from within a given county is proportional to that county’s share of telephone numbers in the U.S. Only working banks of telephone numbers are selected. A working bank is defined as 100 contiguous telephone numbers containing one or more residential listings.
The sample was released for interviewing in replicates. Using replicates to control the release of sample to the field ensures that the complete call procedures are followed for the entire sample. The use of replicates also insures that the regional distribution of numbers called is appropriate. Again, this works to increase the representativeness of the sample.
At least 10 attempts were made to complete an interview at every sampled telephone number. The calls were staggered over times of day and days of the week to maximize the chances of making a contact with a potential respondent. All interview breakoffs and refusals were re-contacted at least once in order to attempt to convert them to completed interviews. In each contacted household, interviewers asked to speak with the “youngest male 18 or older who is at home.” If there is no eligible man at home, interviewers asked to speak with “the oldest woman 18 or older who is at home.” This systematic respondent selection technique has been shown empirically to produce samples that closely mirror the population in terms of age and gender.
Non-response in telephone interview surveys produces some known biases in survey-derived estimates because participation tends to vary for different subgroups of the population, and these subgroups are likely to vary also on questions of substantive interest. In order to compensate for these known biase
s, the sample data are weighted in analysis.
The demographic weighting parameters are derived from a special analysis of the most recently available Census Bureau’s Current Population Survey (March 2002). This analysis produced population parameters for the demographic characteristics of households with adults 18 or older, which are then compared with the sample characteristics to construct sample weights. The analysis only included households in the continental United States that contain a telephone. The weights are derived using an iterative technique that simultaneously balances the distributions of all weighting parameters.
This study was conducted jointly by the Pew Research Center for the People and the Press and the Pew Forum on Religion and Public Life. Professor John Green of the University of Akron made important contributions to the project.