
Screening Likely Voters: A Survey Experiment
Introduction and Summary Traditionally, pollsters trying to accurately assess voter intentions have struggled with a basic problem — figuring out who actually is going to show up to vote. In the 2000 election campaign, sharp fluctuations in the Gallup Organization’s daily tracking poll were blamed by some on difficulties in nailing down likely voters. Similar […]
Introduction and Summary
Traditionally, pollsters trying to accurately assess voter intentions have struggled with a basic problem — figuring out who actually is going to show up to vote. In the 2000 election campaign, sharp fluctuations in the Gallup Organization’s daily tracking poll were blamed by some on difficulties in nailing down likely voters. Similar complaints arose during the 1998 congressional elections, when some critics of President Clinton charged that likely voter samples included too many Democrats sympathetic to Clinton. In 1999, the Pew Research Center undertook an experiment to study the accuracy of the likely voter models employed for decades by leading survey organizations, including Gallup and the Pew Research Center. In this comprehensive experiment, we set out to discover how many of the voters we classified as “likely” actually voted. The Center used as a test case the closely-contested 1999 mayoral race in Philadelphia. It was one of that city’s closest ever — just 9,447 votes separated the victor, Democrat John Street, from his Republican rival Sam Katz. Polling was conducted in two waves among 2,415 registered voters: one survey was taken two weeks before the election, the second was conducted in the last week before voters went to the polls. Aside from the usual battery of questions assessing voting preferences and intentions of voting, participants were asked to provide their name and address — information which was used to match pre-election survey responses with actual voting records. Overall, we were able to match 70% of registered voters polled with Philadelphia voting records to determine whether they actually voted. What we discovered was that the traditional methods originally developed by Gallup in the 1950s to sort voters from non-voters still work reasonably well, particularly when compared to the alternatives. This method uses an eight-item likely voter index designed to assess not only a voter’s preferences, but their past history of voting, interest in the campaign and knowledge of where to vote on Election Day. Using this index, the Center correctly predicted the voting behavior of 73% of registered voters.
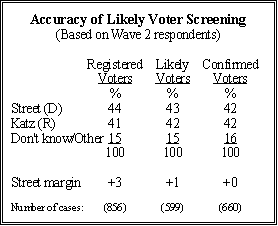
Clearly, the index does not forecast the behavior of all respondents. The 73% accuracy rate means that 27% of respondents were wrongly classified — those who were determined as unlikely to vote but cast ballots (17%), or non-voters who were misclassified as likely to vote (10%). But the likely voter index successfully identified the preferences of respondents who actually went to the polls, according to the validation study. In the second wave of polling, conducted the week before Election Day, Street held a three-point lead among registered voters. But the dead heat among likely voters more accurately reflected the split among those respondents who actually voted. More important, the result virtually mirrors the findings of a similar voter validation study conducted by Gallup during the 1984 presidential election, which correctly classified 69% of registered voters. While the polling business has undergone massive changes since then, the likely voter index remains a model of consistency. Here is a summary of our principal findings. A more comprehensive analysis by Pew Center survey director Michael Dimock is the subject of a paper presented May 19 at the annual conference of the American Association for Public Opinion Research. (Complete paper; You can also contact Michael Dimock via email at mdimock@pewresearch.org).

One of the main successes of the likely-voter index is in identifying a pool of respondents which, if not a perfect replica of the electorate, shares a similar demographic profile with the voting public. It gives a better approximation of the electorate than using registered voters. The survey of likely voters conducted two weeks before the election was nearly as accurate in assessing voters’ preferences as the one taken just prior to the election. Still, it is possible that the effectiveness of the likely voter screen would decline if used too early in an election campaign. In 1998, the Democratic composition of the likely voter poll changed significantly between September and Election Day. Using a single measure to determine likely voters increases the risk of bias and subjects estimates to the vagaries of individual elections. Some individual questions, such as those relating to actual voting intention (“Do you plan to vote?”) result in too many respondents being classified as likely voters, thus increasing the chance of a Democratic bias. Other rifle-shot questions — focusing on a respondent’s level of attention to the campaign, for example, — may classify too few people as likely voters, resulting in a Republican bias. Interestingly, the Pew experiment showed that, in particular, an individual question related to a candidate’s strength of support (how strongly the respondent supported the candidate) is not closely associated with voter turnout. Registered voters who expressed no preference in pre-election surveys were nearly as likely to vote as those who voiced strong support for candidates (and those with no preference were more likely to vote than those expressing moderate candidate support).

Clearly, Gallup’s index is not the only way of identifying likely voters — other indices, employing as few as four or as many as 15 questions, also are effective. These indices are superior to relying solely on samples of registered voters, and also are more effective than using regression analysis to determine a probability of voting for each respondent.