Pew Research Center

FOR RELEASE NOVEMBER 16, 2000

Campaign 2000 Highly Rated

Introduction and Summary Even with an uncertain conclusion, Campaign 2000 gets better grades from the public than most recent presidential contests. Fully 83% of voters say they learned enough from the campaign to make an informed choice — a larger percentage than expressed that view in surveys conducted in the days following the three previous […]

FOR MEDIA OR OTHER INQUIRIES:

Communications Department
202.419.4372
www.pewresearch.org

RECOMMENDED CITATION

Pew Research Center, November 2000, "Campaign 2000 Highly Rated"

About Pew Research Center

Pew Research Center is a nonpartisan, nonadvocacy fact tank that informs the public about the issues, attitudes and trends shaping the world. It does not take policy positions. The Center conducts public opinion polling, demographic research, computational social science research and other data-driven research. It studies politics and policy; news habits and media; the internet and technology; religion; race and ethnicity; international affairs; social, demographic and economic trends; science; research methodology and data science; and immigration and migration. Pew Research Center is a subsidiary of The Pew Charitable Trusts, its primary funder.

© Pew Research Center 2026

Table of contents

  • About Pew Research Center
  • Campaign 2000 Highly Rated
  • Other Important Findings and Analyses
  • Methodology

Campaign 2000 Highly Rated

Introduction and Summary Even with an uncertain conclusion, Campaign 2000 gets better grades from the public than most recent presidential contests. Fully 83% of voters say they learned enough from the campaign to make an informed choice — a larger percentage than expressed that view in surveys conducted in the days following the three previous […]

Introduction and Summary

Even with an uncertain conclusion, Campaign 2000 gets better grades from the public than most recent presidential contests. Fully 83% of voters say they learned enough from the campaign to make an informed choice — a larger percentage than expressed that view in surveys conducted in the days following the three previous presidential campaigns. There was less mudslinging, more discussion of issues, and the debates were more useful than four years ago, said a sample of voters in the Pew Research Center’s quadrennial “weekend after” poll.

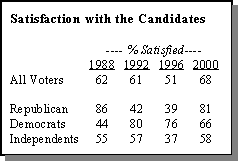
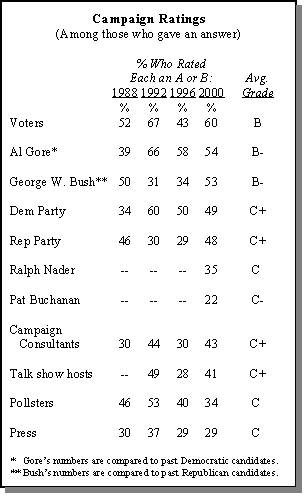
The poll, conducted Nov. 10-12 among 1,113 voters, also finds a greater number of respondents satisfied with the choice of candidates this year than in 1988, 1992 and 1996 — although most were only fairly satisfied with this year’s slate. Voters also are more generous in grading themselves this year, as 60% award themselves a grade of A or B for their performance, up from 43% in Pew’s survey following the 1996 campaign. But the public’s negative view of the press is unchanged from previous elections. Just 29% give the press top grades, while nearly four-in-ten (39%) graded the media D or F.

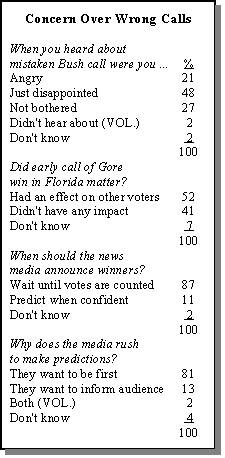
Media miscalls of the outcome of the presidential race on Tuesday have only intensified voters’ long-standing criticisms of press performance. Seven-in-ten voters (69%) voice anger or disappointment with the networks’ premature calls that George W. Bush had won the presidency. More than half of voters (52%) believe the networks’ earlier mistake of calling Florida for Gore may have had an effect on how people in other parts of the country voted (with as many as 58% of those in the West supporting this view). Little wonder that the perception that the media had too much of an influence on the outcome climbed to 53% in the current survey from 47% in 1996 and 46% in 1992.

Roughly nine-in-ten respondents (87%) want the networks to wait to announce winners until nearly all the votes are counted on election night rather than predicting a winner when they feel confident based on early returns. Almost as many (81%) think news organizations make projections in order to be the first to call the winner, rather than because they think it’s important that their audience know the outcome as soon as possible.

More GOP Satisfaction

In keeping with the enthusiasm advantage Bush enjoyed during the campaign, Republicans were more satisfied than Democrats with the choice of presidential candidates this year: 81% of Republicans vs. 66% of Democrats say they were very or fairly satisfied. This represents a dramatic increase in satisfaction on the part of Republicans, only 39% of whom were content with their choices in 1996. Independents were less satisfied this year than partisans — only 58% liked their choices.
By overwhelming margins, voters say they learned enough about the candidates and the issues to make an informed choice. Again, this represents a significant improvement from recent presidential elections. Men and women, young and old, Republicans and Democrats agree on this point. No major demographic group subscribes to the view that it was difficult to choose among the candidates because they didn’t learn enough from the campaign. The widely publicized indecision on the part of voters this year was not due to a lack of information about the candidates or the issues.

The presidential debates were quite influential in helping voters decide which candidate to support. Nearly two-thirds of voters (62%) found the debates helpful — up from 41% in 1996. More women than men say the debates helped them make up their minds (66% vs. 58%). Young voters were more influenced by the debates than older voters — 74% of those under age 30 vs. 57% of those age 65 and older say they found the debates instructive. Bush and Gore voters evaluate the debates about equally. Not only were the debates helpful, but a sizable minority of voters (20%) say they made up their minds definitively during the debate period, up from only 3% in 1996.

On balance, voters say there was more discussion of the issues in this campaign compared to past presidential elections — 46% vs. 36% who say there was less discussion of issues. Again, that is a significant improvement from 1996 when 65% of voters said there had been less discussion of issues.

At the same time, voters saw less mudslinging in this campaign compared to past presidential elections. By a margin of 46%-34%, voters say there was less, not more, negative campaigning this time around; another 16% said there was about the same amount this time. In both 1996 and 1992, voters said negative campaigning was on the increase. Bush and Gore voters have similar evaluations of the campaign in this regard — 49% of Gore voters saw less mudslinging this year. Among Bush voters, 43% said less.

As was the case in both 1992 and 1996, the candidates’ commercials were not well received by the voters. Two-thirds say the commercials were not helpful to them in deciding which candidate to vote for, down only moderately from 73% in 1996. Young voters are among the most critical of the candidates’ commercials — 72% say they were not helpful. Democrats judge the commercials as slightly more helpful than do Republicans (37% vs. 27%). Still most deemed them to be of little importance.
Other Important Findings and Analyses

Voters Trump Candidates

In addition to evaluating the campaign process, voters were asked to rate the various players in the campaign. When stacked up against the candidates, the parties and the media establishment, the voters themselves come out on top. More than one-in-five give voters an A, up dramatically from 12% in 1996. In 1996, Bill Clinton came out on top. This time, the voters trump both candidates.

Interestingly, Gore supporters rate themselves more highly than do Bush supporters — 62% vs. 46% A or B. However, when it comes to rating their candidates, Bush voters give their candidate slightly higher marks than Gore voters: 85% of Bush supporters give the Texas governor an A or B vs. 80% of Gore supporters who rate the vice president that highly.

Overall, Gore receives A’s and B’s from 54% of voters, while Bush gets similar grades from 53%. Ralph Nader and Pat Buchanan receive relatively low marks. Just over one-third of voters (35%) give Nader a grade of A or B; only 22% grade Buchanan A or B. Nader’s grades are higher than those received by Ross Perot in 1996, though much lower than Perot’s 1992 grades. Neither of the third-party candidates fared significantly better among political independents.

Voters give the Republican Party much higher grades for its performance in this campaign than they did in 1996. This year, 48% of voters give the GOP an A or B, compared to only 29% in 1996. The biggest improvement for the party has come from GOP loyalists themselves. In 1996, only 42% of Republicans gave their party an A or B; this year 76% did so. Evaluations of the Democratic Party have remained much more stable. About half of the voters polled give the Democrats an A or B, basically unchanged from four years ago.

Reflecting, perhaps, voters’ satisfaction with the quality and tone of this year’s campaign, the grades given to campaign consultants rose from 30% A or B in 1996 to 43% this year. Talk show hosts also improved their standing from 1996. Ratings for the pollsters, on the other hand, continue on a downward trajectory: 34% rate them A or B this year, down from 40% in 1996 and 53% in 1992.

The press winds up at the bottom of the heap, with only 29% giving them high marks for their performance. As many as one-in-five voters give the press a failing grade, a higher percentage than for any other group or person rated. Republicans are by far the most critical of the press, with only 20% giving them an A or B and 27% giving them as F. The press receives high grades from 39% of Democrats and failing grades from only 10%.

Cable Outranks the Networks

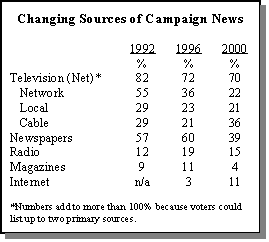
For the first time in a presidential campaign, more voters cite cable news outlets as a primary source of information about the campaign than either network or local television news. More than one-third of voters (36%) say they got most of their news from cable, compared to 22% for the networks and 21% for local television. Since the 1996 campaign, cable has increased by 15%, while the networks have declined by 14%.

Television, broadly defined, remains the leading source of election-related news. Seven-in-ten voters cite either cable, network and/or local news as a primary source of election news, down from 72% in 1996 and 82% in 1992.

There has been a precipitous decline in the number of voters relying on newspapers as a major source of campaign news. Fewer than four-in-ten (39%) say they got most of their news about the presidential campaign from newspapers, down from 60% in 1996. This falloff has occurred across all demographic groups, although it has been somewhat more pronounced among well-educated voters, who traditionally have been steadfast newspaper readers.

In 1996, 70% of college graduates cited newspapers as a major source of campaign news, compared to only 54% of those who had no more than a high school degree. This education gap has narrowed considerably. Today, newspapers are cited as a major source of election news by just 46% of college graduates, compared to 37% of voters with no more than a high school degree.

More Go Online for Election News

In place of traditional media sources, voters are increasingly going online for election information. Roughly 11% of voters list the Internet as one of their primary sources of campaign news, and another 19% say they got at least some of this news from the Internet. The overall total of 30% citing the Internet as a source for election news is three times the 1996 level.

Though Internet use has risen across the population, more educated and wealthier voters have been the most ready to take advantage of this new resource. Fully 37% of college graduates got at least some news about the campaign from the Internet, compared to just 22% of those with a high school degree or less. More than four-in-ten (42%) of those in households with annual incomes of $50,000 or more say they went online for campaign news, compared to only 15% of those in households with incomes of less than $20,000 annually.

Age is another factor associated with Internet use. Four years ago, 16% of voters under 30 got at least some campaign news online, compared to only 1% of those over age 65. Though there have been increases in Internet use among all voters, the disparity between young and old still exists. During the 2000 campaign, 42% of voters under 30 say they went online for campaign news, compared to only 10% of seniors.

The digital divide for election news is based more on age and income than race. While three-in-ten white voters say they went online to learn something about the election, almost as many African-American voters (28%) say the same.

Too Much Media Influence

Along with changing media habits, the 2000 election has also been marked by increasing concerns about the news media’s influence. For the first time, a majority of voters (53%) feel that news organizations exerted too much influence on the outcome of this year’s presidential election.

Republicans and Bush supporters are particularly unhappy with the press’ role in the election, with nearly two-thirds (63%) of each group saying the media has excessive influence, compared to 43% of Gore supporters and 42% of Democrats.

Some of this dissatisfaction is evidently linked to perceptions of media fairness in covering the candidates. Overall, 71% of voters feel the press was fair in the way it covered Gore’s election campaign, and 65% say the press was fair to Bush.

But as has been the case in the past, Republicans are less satisfied with press coverage, and more likely to perceive a press bias against their candidate. For many Republicans, perceptions of press bias go beyond the media’s treatment of their candidate. Less than half of Republicans (47%) believe that news organizations have been fair to both candidates this year, compared to 68% of Democrats. While 23% of Republicans say coverage was only fair to Gore, another quarter say the press was unfair to both candidates in covering the campaign.

High Interest, Deep Concern

Both voters’ interest in the campaign and dissatisfaction with the news media can be seen in their reactions to election coverage. Fully 88% of voters said they followed the returns on election night, with over 40% staying up past 1:00 AM Eastern Time, and 18% still watching at 3:00 AM Eastern Time — late enough to see the networks declare a Bush victory.

Regardless of how late they stayed up, most voters turned thumbs down on the media’s performance on that chaotic night. While there was widespread anger and disappointment over the networks’ erroneous call of a Bush victory, a majority say the earlier, mistaken call of a Gore win in Florida may have affected voters elsewhere. Republicans were particularly concerned about the early call of Florida for Gore — 62% felt it affected voters in other parts of the country compared to only 42% of Democrats. Republicans and Democrats were equally unhappy with the late night call of Florida for Bush.

Voters are nearly united with respect to the issue of when news organizations should announce the winners in the states By nearly an eight-to-one margin, they say the media should wait until nearly all the votes are counted, rather than predicting a winner when they feel confident about the outcome based on early returns.

Almost as many voters question the media’s motives for making early election calls. The vast majority (81%) says the main reason news organizations sometimes make projections too quickly is because they want to be the first to call the winner, not because they feel it is important for their audience to know the outcome as soon as possible.

Methodology

The survey results are based on telephone re-interviews conducted November 10-12, 2000 among 1,113 voters under the direction of Princeton Survey Research Associates. (“Voters” are those respondents who said they voted in the 2000 election.) This sample was selected from those identified as registered voters in two previous nationwide surveys of adults 18 years of age or older, the first conducted September 2000 and the second in Early October 2000. For results based on the total sample of voters, one can say with 95% confidence that the error attributable to sampling and other random effects is plus or minus 3 percentage points.

In addition to sampling error, one should bear in mind that question wording and practical difficulties in conducting surveys can introduce error or bias into the findings of opinion polls.