Pew Research Center

FOR RELEASE JULY 13, 2000

Voter Turnout May Slip Again

Introduction and Summary Americans are more satisfied with their choice of presidential candidates this year than in 1996 and 1992, and they are, if anything, less critical of the way the campaigns are being conducted and covered by the news media than they were at comparable points in those elections. Yet voters are more disengaged […]

FOR MEDIA OR OTHER INQUIRIES:

Communications Department
202.419.4372
www.pewresearch.org

RECOMMENDED CITATION

Pew Research Center, July 2000, "Voter Turnout May Slip Again"

About Pew Research Center

Pew Research Center is a nonpartisan, nonadvocacy fact tank that informs the public about the issues, attitudes and trends shaping the world. It does not take policy positions. The Center conducts public opinion polling, demographic research, computational social science research and other data-driven research. It studies politics and policy; news habits and media; the internet and technology; religion; race and ethnicity; international affairs; social, demographic and economic trends; science; research methodology and data science; and immigration and migration. Pew Research Center is a subsidiary of The Pew Charitable Trusts, its primary funder.

© Pew Research Center 2026

Table of contents

  • About Pew Research Center
  • Voter Turnout May Slip Again
  • I. The Campaign: A Wide-Open Race
  • II. Voter Engagement
  • III. Voters Judge the Candidates, the Campaign and the Media
  • IV. What the Voters Want
  • Methodology

Voter Turnout May Slip Again

Introduction and Summary Americans are more satisfied with their choice of presidential candidates this year than in 1996 and 1992, and they are, if anything, less critical of the way the campaigns are being conducted and covered by the news media than they were at comparable points in those elections. Yet voters are more disengaged […]

Introduction and Summary

Americans are more satisfied with their choice of presidential candidates this year than in 1996 and 1992, and they are, if anything, less critical of the way the campaigns are being conducted and covered by the news media than they were at comparable points in those elections. Yet voters are more disengaged than they have been in the recent past, and these early indications suggest that turnout may be even lower than it was four years ago.
Two main factors appear to underlie flagging voter interest. First, many citizens say that who is elected president is not as important as it once was. Secondly, younger Americans are more cynical and disconnected from politics than even in the recent past. These are the principal findings of a nationwide survey of voter attitudes by the Pew Research Center, which is comparable to polls conducted by the Center at about this stage in the two previous presidential elections.

At this point, there is a good chance that voter turnout will be lower than in 1996, when just 49% of age-eligible citizens cast ballots. And it seems virtually certain that participation will fall below the 55% who voted in 1992. There are several signs pointing to a possible decline in voter turnout, despite the highly competitive nature of the race between Al Gore and George W. Bush.

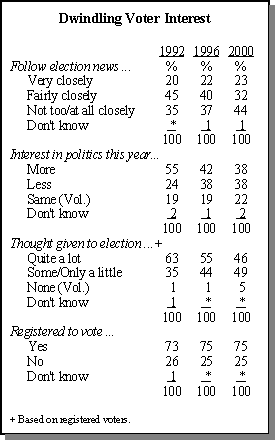
First, fewer respondents say they have been following news about the campaign than in 1996 and 1992, and an increasing number say they are less interested in politics this year. While the poll finds no decline in the percentage of Americans registered to vote, not as many potential voters say they are focused on the campaign as in the past.

At the same time, there are strong indications Americans do not place as much importance as they once did on who is elected president. One-in-five flatly agree with the statement that who is elected is not as important as it was in the 1970s and 1980s. Perhaps more tellingly, 30% said it does not make much difference who is elected, up from 18% in surveys conducted in 1992 and 1976. Cynicism over what the next president can achieve is running at the same level as it was in August 1976, when the country was still recovering from Watergate and the oil shortages of the mid-1970s. Then, as now, nearly half agreed that “things will pretty much be the same” no matter who is elected.

In this vein, while 37% say they are having trouble choosing between Gore and Bush because they believe neither is qualified, almost as many say they are having trouble because either would be qualified. A bare majority of voters think Gore and Bush have different positions on issues. In fact, the percentage saying the two men take similar positions is somewhat higher than it was before the campaigns began in earnest a year ago (33% vs. 24%).
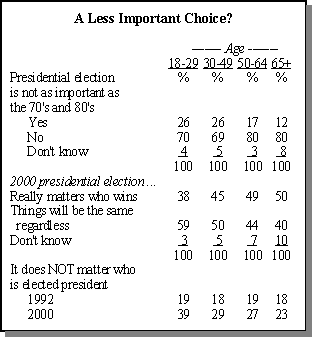
Generational factors are evident in both the declining voter interest and the diminishing view of the presidency. While Americans in all age groups are less engaged by the current presidential campaign, the falloff is sharper among voters under 50 years of age. Only about half of those in that age group are paying close attention to news about this year’s presidential campaign, compared to nearly two-thirds of those age 50 and older. This generation gap in attentiveness was not as apparent four years ago at this time. In addition, increasing numbers of younger people say they don’t vote because of their distaste for politics and dislike of candidates.

Younger Americans are also much more likely to express doubts about the power and prestige of the presidency. Those under age 50 are much more likely than older Americans to say that it is less important who is elected; more younger people also believe the next president won’t change things. Since 1992, a growing number of people in every age group say it does not matter who is elected president. But the increase among those under age 50 holding this view is more than double the increase among older people.

In part, these trends reflect uncertainty and divisions over how much change the country actually wants. A slim plurality supports making major policy changes to solve problems rather than staying the course. While there is an obvious partisan undertone in the debate over change vs. continuity, nearly one-third of Republicans support staying the course and independents are fairly evenly split on the desire for change.

Paradoxically, the signs of the public’s political listlessness are surfacing at a time when many more Americans express satisfaction with their choice of candidates than did so four years ago. Satisfaction with the presidential field has risen dramatically among Republicans; nearly three-quarters (73%) express satisfaction with the candidates compared to 49% in 1996. Independents and Democrats are also more pleased with the field than they were in 1996. Similarly, the Bush campaign is getting better grades from voters than did GOP standard-bearer Bob Dole’s campaign of four years ago. Gore’s effort is less highly-rated, but is judged about the same as Clinton’s campaign was during the summer of 1996.
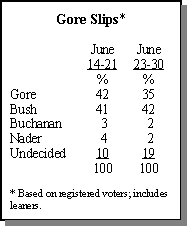
Many indicators in the survey suggest that the presidential race is still wide open, especially when compared to the relatively unchanging tenor of voter opinions four years ago. The Pew Center’s surveys have fluctuated since the primary season ended in the spring. In mid-March, after the primaries, Gore moved out to a six-point lead among registered voters. In contrast, surveys in May and early June found the race dead even. The most recent survey, conducted from June 23-30 — after the renewed controversy over Gore’s possible fund-raising improprieties — found a small lead for Bush (42%-35%). Four years ago, Clinton held a consistent lead over Dole in all Pew Research Center post-primary surveys.

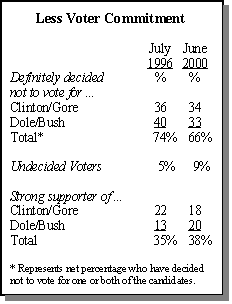
The poll also finds voters expressing less conclusive attitudes toward the candidates this time. Four years ago, 74% of registered voters had firmly decided not to cast a ballot for either Clinton or Dole. This year fewer (66%) have made that judgment regarding Gore and Bush. Independents are especially non-committal — only 56% have ruled out one of the candidates, compared to 64% four years ago. The current polling also finds slightly more undecided voters (9%) than in June 1996 (5%), but fewer than in June 1992 (14%).

But Bush’s campaign can point to promising signs. Currently, the Texas governor has an enthusiasm edge over Gore; his support is firmer than the vice president’s, particularly from within his own party base. In addition, core Republicans, especially conservatives, are more likely to say who gets elected matters and they are paying closer attention to the race than liberal Democrats.

Gender continues to be one of the most important prisms for understanding the presidential race. Men have more consistently favored Bush, while women have vacillated in their support for Gore. Younger women, who decisively favored Clinton over Dole four years ago, are especially torn between Bush and Gore. Suburbanites, white Catholics, mainline Protestants, and middle-income voters have also been consistently on the fence in recent months.

While the majority of Americans regard the presidential race as dull, fewer feel that way than did four years ago (65% vs. 73%). And they are not inclined to blame the news media for their lack of interest in the campaign. Nearly half of Americans (48%) rate the media’s coverage of the campaign as good or excellent, compared to 42% in 1996. But while the public is moderately satisfied with how the press is reporting on the campaign, relatively few Americans are actively seeking out election news. In yet another indication of the public’s inattentiveness to this election, just 15% say they actually seek news about the campaign while 83% come across it by chance.

Although the public overwhelmingly wants the news media to focus on issues in covering this election, as opposed to stories about the candidates’ backgrounds and personal experiences, Americans rate a candidate’s reputation for honesty as the most important thing to learn before the election. No single issue dominates the voters’ concerns, but recent signs that the economy is cooling appear to have attracted increasing public interest. Relegated to the second-tier of issues a year ago, the economy is now one of a quartet of subjects — along with education, health care and Social Security — that voters want candidates to discuss.

Other Findings

A narrow majority of Americans believe that Bush will win the presidential election. At this point, Republicans are much more confident in their party’s chances in November than Democrats are in theirs.

The public is receptive to the idea of replacing paid TV ads with more frequent candidate debates. Republicans are slightly more enthused by that proposal — which Gore has promoted — than are Democrats.

Americans are divided over whether major new policy changes are needed, but just 40% want the next president to continue the programs and policies of the Clinton Administration.

Fewer people are getting news about the campaign from traditional media sources, including broadcast and cable television, radio and newspapers compared to four years ago. But among the minority of Americans who actively look for campaign news, nearly two-thirds turn to newspapers and cable.

While white evangelical Protestants overwhelmingly favor Bush over Gore, seculars are divided. Gore holds a slight lead over Bush among members of this group in a two-way race. But Green Party candidate Ralph Nader draws some of the vice president’s secular supporters, and in a four-way race (including Nader and Pat Buchanan) Gore and Bush run even.

I. The Campaign: A Wide-Open Race

The Public’s Mood Mellows

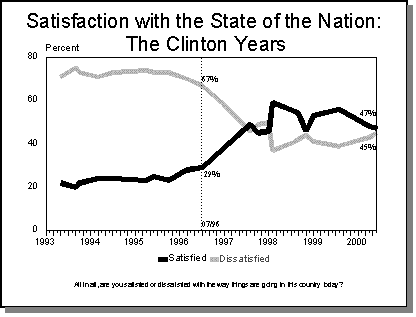
Satisfaction with the state of the nation is down slightly over the past 12 months, though still high relative to the early 1990s. In the current survey, 47% of citizens say they are satisfied with the way things are going in the country, down from recent highs of 56% in August 1999 and 59% in February of 1998. Dissatisfaction is at 45%, the highest level since January 1998.

This recent falloff in satisfaction has occurred in nearly all segments of society, but has been particularly pronounced among Hispanics and African-Americans. Only 39% of blacks say they are satisfied with the state of the nation, and 50% say they are dissatisfied; in August 1999, fully 56% of African-Americans were satisfied and 39% dissatisfied. A similar decline has occurred among Hispanics. Just 52% of Hispanics say they are satisfied today, compared to 67% last summer.

Politically, Democrats remain more satisfied with the nation’s direction than Republicans, by a 56% to 39% margin. But the partisan divide has narrowed since last August — when it stood at 70%-47% — because of a 14-percentage point drop in satisfaction among those identifying themselves as Democrats. Dissatisfaction also remains high among self-described conservatives, 55% of whom are unhappy compared to 39% of moderates and 40% of liberals.

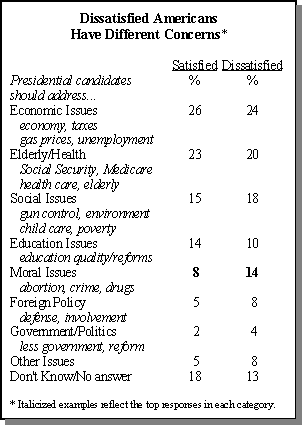
This rising public dissatisfaction appears to be rooted, in part, in moral, social, and political concerns. Dissatisfied citizens are more likely to say that they want to hear the presidential candidates talk about moral and social issues — such as abortion, crime and drugs, child care, and poverty — than those who are satisfied with the state of the nation.

Whether this shift in the public mood will negatively affect Gore’s electoral prospects is unclear. On the one hand, satisfaction is clearly related to candidate preferences. Among those who say they are satisfied with the state of the nation, Gore leads Bush by a solid margin, 57% to 36%. Among those dissatisfied, Gore trails 34% to 55%. Yet Clinton was able to win reelection four years ago although public satisfaction was much lower than it is now.

Accompanying this latest shift in mood is a modest increase in concern over the economy. More Americans (24%) expect economic conditions to be worse a year from now than expect to see the economy improve (15%). By contrast, in the fall of 1998 only 17% thought the economy would get worse in the next year and 18% were optimistic. But this rising anxiety may reflect a perception that the economy is already so strong that it is unlikely to improve even more, rather than a deepening pessimism.

In fact, the dominant view among the public is that the economy will probably not change one way or the other over the next year. Most Americans (55%) believe economic conditions in the country will remain the same. Moreover, 52% of respondents say their personal financial situation is either excellent or good, a percentage which has remained steady since the mid-1990s.

Fund-raising Flap Boosts Bush

While the presidential race has remained close over the past several months, the renewed focus on Gore’s role in the Democrats’ 1996 fund-raising efforts appears to have boosted Bush’s standing. The Pew Research Center poll was conducted in two waves, with the first set of interviews ending June 21, the day before newspapers reported there had been a new recommendation for an Independent Counsel to look into Gore’s 1996 activities.

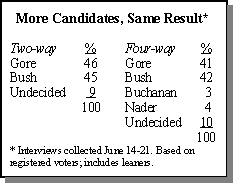
At that point, the vote in a two-way match-up was evenly divided: Gore 46%, Bush 45%. The race was equally tight with third-party candidates Pat Buchanan and Ralph Nader on the hypothetical ballot: Gore 42%, Bush 41%, Buchanan 3% and Nader 4%. But in polling conducted June 23-30, after the fund-raising story broke, Bush had a slight edge over the vice president, 42%-35%.

Many Democrats Ambivalent

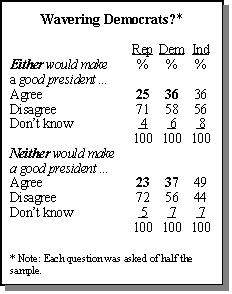
Voters are surprisingly ambivalent about the outcome of this election, perhaps because of the competitiveness of the race and the lack of defining issues. Significant minorities say it is difficult to choose between Gore and Bush because either would make a good president, or alternatively, because neither could do the job.

As with many issues, there is a clear generational pattern in responses to these questions, with those under age 50 more likely to have a hard time choosing between Gore and Bush. Among this younger group, 36% say either candidate would make a good president, compared to 27% of those over age 50. Similarly, 41% of those under age 50 say neither would make a good president, compared to 29% of those 50 and older.

There are also significant partisan differences, which point to Gore’s potential weakness within his own party base. Democrats are more likely than Republicans to say either candidate would make a good president. And fully 37% of Democratic Party loyalists say it’s difficult to choose between Gore and Bush, because neither would make a good president — hardly a vote of confidence for the vice president. This compares with only 23% of Republicans who say neither man is capable of performing as president. Independents are more likely than either major party group to share this negative sentiment: fully 49% think neither candidate is up to the job.

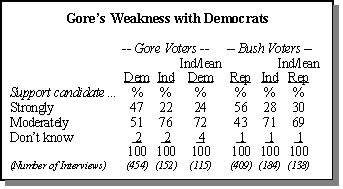
This lack of enthusiasm on the part of Democrats is again demonstrated in the intensity of each candidate’s support. Respondents were asked whether they support their candidate of choice strongly or only moderately. Overall, Bush has slightly more strong supporters than does Gore: 44% vs. 40%, respectively.

But Bush receives strong support from a solid majority of the Republicans who support him (56%), while fewer than half (47%) of the Democrats who support Gore characterize themselves as strong supporters. At this point, independents are not firmly in either candidate’s camp. However, Bush’s independent voters are slightly more likely than Gore’s to identify themselves as strong supporters.

Majority Says Bush Will Win

All of this means that the race is extremely fluid. At this point, for instance, there doesn’t seem to be a significant gap between likely and unlikely voters in terms of their candidate preferences. Likely voters divide evenly between Bush and Gore — 47% for each, with 6% undecided.(1) Those who are less likely to vote are also evenly divided, though more are undecided (13%).

[Note 1. Likely voters are identified by their answers to five questions concerning interest in the election and past voting behavior.]

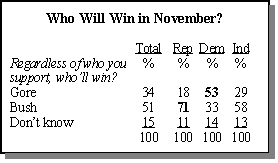
But in spite of the inability of many people to make up their minds, a thin majority of the public thinks Bush will prevail in November. When asked who they think the likely victor will be, regardless of who they themselves support, 51% of Americans point to Bush, only 34% think Gore will win, and 15% aren’t sure how it will turn out.

Republicans have much more confidence in their nominee than Democrats have in theirs. Fully 71% of Republicans think Bush will win the election, compared to only 53% of Democrats who say the same about Gore. By a two-to-one margin, independents expect Bush to triumph. The public’s predictions were quite accurate in the summer of 1996, when 71% said Clinton would likely win the election and only 19% said the same about Dole.

Bush’s Edge on Personal Traits

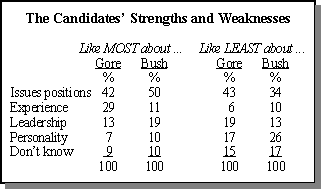
Gore supporters continue to point to his stand on the issues as his strongest selling point, and voters give him little credit for his more personal qualities. When asked what they like most about the vice president, 42% of Gore voters say it’s his stand on the issues, 29% point to his experience, and only 20% choose his personality (7%) or leadership ability (13%).These numbers have changed very little since the fall, suggesting that voters are no more attracted to Gore on a personal level today than they were at the outset of the campaign.

Bush supporters are also drawn primarily to the governor’s policy positions. Fully 50% of them say Bush’s stand on the issues is what they like most. But Bush receives slightly higher marks than Gore on the more personal dimensions: 29% cite his personality (10%) and leadership ability (19%) as his strongest selling points. Not surprisingly, experience is less of a plus for Bush. Only 11% say this is what they like most about the candidate. Again, these numbers are largely unchanged from recent months.

When asked what they like least about each of the candidates, a plurality of Bush supporters point to his issue positions as his biggest liability. More than four-in-ten (43%) of Gore’s detractors say his stand on the issues is what they like least about the vice president. Roughly one-third (36%) point to personal qualities (17% personality and 19% leadership). A mere 6% take issue with Gore’s experience.

Among Bush detractors, personal qualities are more of a turnoff than the governor’s issue positions. Roughly four-in-ten Gore supporters (39%) say what they don’t like about Bush is his personality (26%) or leadership ability (13%). Slightly fewer (34%) point to his policy positions.

Bush’s stand on the issues is more of a problem for young voters than older ones. Fully 54% of Gore supporters under 30 say Bush’s position on the issues is what they like least about him, compared to only 19% of those 65 or older.

Gore Leads on Key Issues

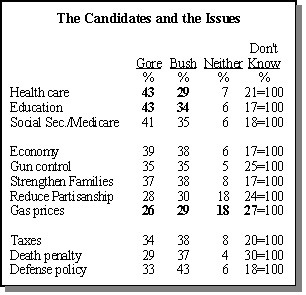
On the issues citizens most want to hear about from the candidates — education, health care, Social Security and the economy — Gore is generally seen as the superior candidate. When asked which candidate would do the better job improving the health care system, 43% choose Gore, while just 29% opt for Bush. Gore also leads Bush by nine points on education (43% to 34%) and six points on keeping Social Security and Medicare sound (41% to 35%). Gore’s advantage on education represents a significant change from the spring. In March, Bush was seen as the candidate better able to improve education, by a 44% to 41% margin.

Bush has the edge when it comes to who is better able to make wise defense policy decisions (43% Bush, 33% Gore) and representing people’s views on the death penalty (37% Bush, 29% Gore). But a sizable minority (30%) is unsure of which candidate best represents their views on that controversial issue.

Neither candidate has a clear advantage in being viewed as better able to control the price of gasoline. While 29% choose Bush and 26% say Gore would do better, 18% volunteer that neither would do a good job and 27% are undecided. Bush held a formidable advantage on this issue in March. At that time, he out-polled Gore on being better able to control gas prices, 41% to 25%.

Education, Social Security, Medicare and health care are seen as Gore’s strongest issues by those who support him for his policy positions. Roughly eight-in-ten of these voters say Gore would do a better job than Bush of dealing with each of these issues. On the other hand, Bush voters who say they like the governor’s policy positions view foreign policy, family values and taxes as his biggest strengths. More than three-quarters say Bush could best Gore on each of these issues.

Character Crucial for Bush

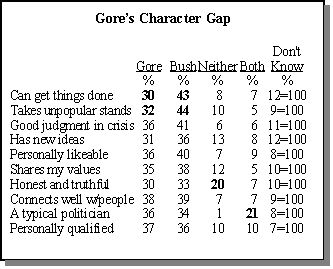
Though Bush trails Gore on a number of issues, he receives far better marks when it comes to character evaluations — particularly those relating to the candidates’ leadership abilities. Fully 44% think Bush is more “willing to take a stand, even if it’s unpopular,” and 43% see Bush as the candidate who “can get things done.” Gore gets the nod on these traits from only 32% and 30% of the public, respectively.

Bush also leads Gore in being perceived as using good judgment in a crisis (41% Bush, 36% Gore), having new ideas (36% Bush, 31% Gore), and being personally likeable (40% Bush, 36% Gore), though by smaller margins. When it comes to other traits such as honesty, qualifications and the ability to connect well with ordinary Americans, neither candidate has a clear edge. However, a certain amount of voter cynicism can be seen in the fact that 21% of respondents volunteered that the phrase “a typical politician” described both candidates well, and 20% offered that neither candidate was “honest and truthful.”

Younger Women, Older Men Divided

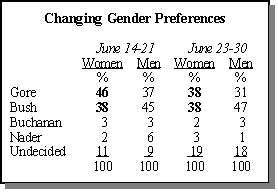
The dynamics of the presidential race continue to be influenced in part by the fluctuating preferences of women. While men have consistently preferred Bush to Gore over the past 18 months, women have frequently changed course. Most recently, women favored Gore over Bush by an eight-point margin in the first wave of interviewing for this survey. In the second wave, however, they divided equally between Gore and Bush. In 1996, Clinton’s advantage in the women’s vote never faltered. Throughout the year, he sustained a double-digit lead over Dole among women.

But not all women are having doubts about Gore. Women age 50 and older have generally supported the vice president, but Gore’s support tends to be weaker among women under age 50. For Bush, older men pose a challenge. Men age 50 and older have gone from favoring Gore by 10 points in March, to preferring Bush over Gore by an equal margin in May, and now opting narrowly for Bush. Until these swing groups settle into one camp or the other, the race may continue to fluctuate.

In addition to the gender gap, there is a particularly large “marriage gap” in voting preferences this year. Overall, Gore trails Bush by 13 percentage points among married people (39% to 52%) but leads Bush by 18 points among those who are unmarried (55% to 37%). In June 1996, Clinton led in both groups, though by a smaller margin among the married (50%-46%) than the unmarried (62%-33%).

The differences between 1996 and 2000 are even more striking when both marital status and gender are considered at the same time. While Clinton led Dole among married women 53% to 43%, Gore trails Bush 42% to 50%. In June 1996, married men were evenly split between Clinton and Dole. This year Bush holds a commanding 54% to 36% lead in this group.

Clinton’s 20-point lead over Dole among single men has shrunk to a mere 4-point Democratic edge this year (48% Gore, 44% Bush). Gore’s strongest support comes from single women, who prefer him nearly two-to-one over Bush (60% to 31%). However, even this 29-point lead among single women still falls short of Clinton’s commanding 37-point advantage over Dole among single women in 1996.

Bush Leads Among Parents

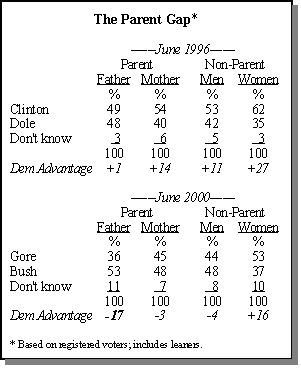
Gore has failed to attract strong support among parents with children under 18 in the home, who make up 33% of the registered voters sampled. In particular, while Clinton was able to win the support of 54% of mothers, Gore currently trails Bush among mothers 45% to 48%. Bush holds a 17-point lead of 53% to 36% among fathers, who were evenly split between Clinton and Dole at this time in 1996.

Gore’s difficulties among men extend to those who do not have children as well. Clinton led Dole 53% to 42% among male non-parents in 1996, while Gore trails Bush 44% to 48% this year. And though Gore does lead among women who are not parents, 53% to 37%, this still falls short of Clinton’s 62% to 35% advantage among these women in 1996.

Catholics Narrowly Favor Bush

Members of major religious groups are also expressing different preferences in this election cycle compared to 1996. Not surprisingly, Bush leads Gore among white evangelical Protestants (65%-28%).

However, the candidates are running even among mainline Protestants and white Catholics. In 1996, Clinton enjoyed an 11-point lead over Dole among non-evangelicals, and Catholics preferred him by nearly a two-to-one margin (62%-34%).

Gore leads Bush among secular voters in the two-way match-up (46%-40%). However, in a four-way contest (with Nader and Buchanan included), some of these voters abandon the vice president in favor of Nader. Seculars are three times more likely than the general public to support Nader (13% vs. 4% of the general public). In 1996, Clinton held a commanding 67%-30% lead among seculars.

Ultimately, however, the race will hinge on the preferences of political moderates. Fully 91% of conservative Republicans and liberal Democrats are solidly behind their respective candidates. However, among moderate-to-liberal Republicans and moderate-to-conservative Democrats, roughly 20% currently support the other party’s candidate.

Nader, Buchanan Have Little Effect

The overall impact of adding Nader and Buchanan to the race is, at this point, negligible. Combined, the two pull in a mere 7% of the vote. Buchanan’s strongest support comes from men under age 30, 7% of whom say they would vote for the former TV talk show host. Nader’s strongest supporters are middle-aged men and political independents. Nonetheless, neither of the third party hopefuls are able to draw in even 10% of any major demographic group.

The supporters of these alternative candidates have distinctive views about the campaign and the candidates. Overall, they are much less satisfied with the state of the nation than are most Americans. By a margin of 57%-38% they say they are dissatisfied with the way things are going in the country today. This compares with 45% dissatisfied vs. 47% satisfied among the general public. They are also less approving of the job Clinton is doing (49% approve vs. 56% of all Americans). Even so, they prefer Gore over Bush, when forced to choose between the two (48%-38%).

These voters are extremely dissatisfied with their choices for president this year. Fully 70% say they’re not satisfied with the likely presidential candidates, compared to only 34% of the public. In addition, nearly half (46%) see Bush and Gore as pretty similar in their positions on issues; just 33% of the public takes that view. And fully four-in-ten say, if given the chance, they would cast a vote of no confidence in all the candidates running for office this year. Only 19% of the public expresses this view.

II. Voter Engagement

Tuned Out

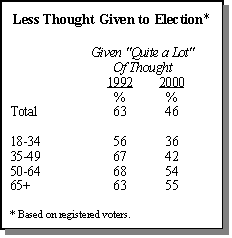
The presidential campaign is not on the minds of most Americans. Fewer than half of registered voters (46%) say they have thought a lot about the election. That represents a modest decline from a similar point in the campaign four years ago (when 50% said they gave the campaign a lot of thought) and a substantial decrease from June 1992, when 63% were fully engaged.

Interest in the campaign is down among nearly all demographic groups, but particularly among younger voters. The percentage saying they are giving a lot of thought to the election has declined by more than 20 percentage points among those under age 50 since 1992. The decline in interest among young people has been most pronounced among the well-educated: In June 1992, 68% of 18-34 year-old college graduates said they had given a lot of thought to that year’s election. Today, just 39% agree.

By comparison, there has been a smaller decrease in interest among older Americans. Today, 55% of registered voters age 65 and older have given a lot of thought to the election, down only eight percentage points from 63% in 1992.

Interest in politics has changed slightly along partisan lines compared to 1992, when the GOP was the incumbent party and the Democrats were challenging. In 1992, just 17% of Republicans were following election news very closely, compared to 23% of Democrats. Today, 28% of Republicans and 24% of Democrats are paying close attention.

Few Familiar with Positions

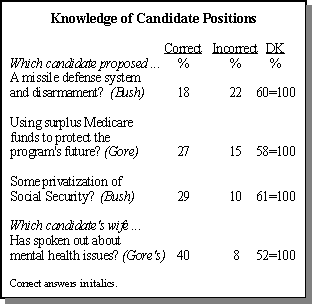
Lack of interest in the campaign is also reflected in limited public awareness of candidate positions. When asked which candidate has proposed building a missile defense system and reducing the number of U.S. nuclear weapons, even if Russia refuses to do the same, only 18% correctly identified Bush, while 20% incorrectly guessed Gore.

Slightly more people correctly identified Gore as the candidate who has proposed using surplus Medicare funds to protect the program’s future and Bush as the candidate who has proposed allowing workers to invest some of their Social Security contributions in stocks and bonds. But the vast majority were in the dark on these questions.

Unfamiliarity with specific policy positions taken by the candidates does not signify a complete lack of attention to the campaign, however. Fully 40% of respondents correctly identified Tipper Gore as the candidate’s wife who has spoken out about the need to help Americans with mental illness.

Men typically are more familiar with candidate policy positions than women. But as many women as men are aware of Tipper Gore’s activities (42% of women, 39% of men). Moreover, older voters consistently do better than younger ones at identifying candidate positions and campaign events.

Do Elections Still Matter?

Not only are many Americans turned off by the current campaign, a significant number say it doesn’t much matter who is eventually elected. Nearly half of Americans (49%) believe things will pretty much stay the same regardless of who is elected; less than half (45%) say that, as far as making progress on the important issues facing the country is concerned, it really matters who wins the 2000 presidential election.

While there is a clear generational divide on these questions, with younger people more skeptical that the election matters, education and income are also important factors. For example, 57% of those whose education ended with high school say conditions in the country will be the same regardless of who is elected in November. That compares to only 38% of college graduates.

Independents are more likely than party loyalists to express doubt about the election’s significance. Fully 37% of independents say it doesn’t make much difference who’s elected president, compared to 28% of Democrats and 23% of Republicans. Similarly, 58% of independents say things will be the same regardless of who is elected in 2000, vs. 45% of Democrats and 41% of Republicans.

Beyond that, fully one-third of the public believe that Gore and Bush do not have well-defined policy differences. This perception is strongly linked to feelings about the importance of the upcoming election. Among those who say the candidates have similar issue positions, 62% say things will remain the same, regardless of who wins in November. Among those who perceive the candidates as having different positions, only 38% hold this view.

Attitudes Associated with Voting

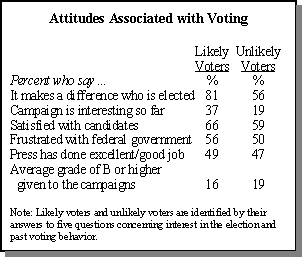
The diminished relevance of the election in many citizens’ minds is one factor contributing to the possibility of low voter turnout in this year’s election. Fully 81% of likely voters feel that it makes a difference whether Bush or Gore is elected, while only 56% of unlikely voters agree.

A more exciting campaign over the coming months still might serve to drive up voter participation in November, as voting is strongly connected to interest in the campaign. More than a third (37%) of likely voters say the campaign has been interesting so far, compared to only 19% among those less likely to vote. By comparison, evaluations of the quality of the campaigns and press coverage have little effect on the likelihood of voting.

For Non-voters: It’s the Candidates

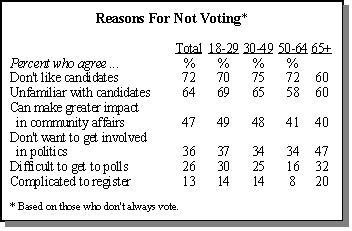
Taking a longer view, Americans generally blame the poor quality of candidates and an aversion to getting involved in politics as reasons they don’t always vote. Fully 72% of those who do not always vote say it is because they sometimes don’t like any of the candidates, up from 65% in 1992. This increase has been most dramatic among non-voters age 50 or older, who now express nearly as much dissatisfaction as younger voters. In 1992, just 55% said dissatisfaction with candidates was a reason for not voting, compared to 68% today. Among those under age 50, 73% list dissatisfaction with candidates, compared to 68% in 1992.

Indeed, those who are least likely to vote in this election are slightly less satisfied with the Gore-Bush match-up (59% satisfied) than those who are likely to vote (66% satisfied).

In addition to dissatisfaction with the candidates, a growing proportion of non-voters express a distaste for politics as a reason for sitting out elections. Today, 36% say not wanting to involve themselves with politics is a reason for not always voting, up from only 24% in June of 1992. Independents, in particular, are finding politics a turnoff. Today, 40% give this as a reason for not voting, compared to only 23% in 1992.

Among other factors cited for not voting, fully 47% of those who don’t always vote say they could make more of a difference by getting involved in the community than by participating in elections. This view is more prevalent among younger people and liberals than older Americans and conservatives. Almost half (49%) of those age 18-29 who don’t always vote say they can make more of a difference getting involved in the community than by voting in elections; 40% of those age 65 and older agree. More than half (53%) of those who don’t always vote and identify themselves as liberals feel this way, compared to 43% of non-voting conservatives.

However, people who give this reason for failing to vote are not necessarily more likely to involve themselves in community activities. Only 49% of respondents agreeing with this reason for not voting report actually doing volunteer work for a church, charity or community group, compared to 52% of the general public.

Relatively few cite difficulty getting to the polls (26%) or the complications of registering (13%) as reasons for non-voting. By comparison, 64% of people who don’t always vote say not knowing enough about the candidates is one reason for their non-participation.

Many Young People Unregistered

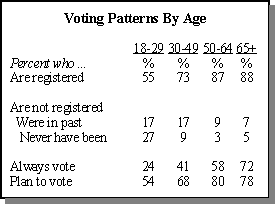
Despite the declining interest in this campaign, more general measures of voter involvement — such as registration and propensity to vote — have changed little over the past few elections. Currently, three-quarters of Americans report being “absolutely certain” they are registered, compared to 73% in June 1992. When asked specifically about this year’s race, more than eight-in-ten (84%) of those registered to vote are “absolutely certain” they will vote in November’s election, compared to 88% in 1992 .

Age, more than income, education and party identification, continues to be the most critical factor in registration and voting patterns. Only 55% of those age 18-29 are registered, compared to 87% of those age 50 and older. Barely half (54%) of those age 18-29 say they plan to vote this fall, compared to 80% of those age 50 and older.

Well-educated and high-income Americans also register and vote at higher rates than those who are less educated and have lower incomes. More than eight-in-ten college graduates (82%) say they are “absolutely certain” they will vote in November’s election, compared to only 66% of high school graduates and 52% of those with less than a high school education. Similarly, three-fourths of those with household incomes over $50,000 say they are sure to vote in the fall, compared to only 61% of those making under $30,000.

Registration rates and voting intentions are highest among Republicans, with 85% registered and 82% planning to vote. By comparison, 79% of those who identify themselves as Democrats are registered, and only three-fourths say they are certain to vote this fall. Independents lag even further behind, with only 64% registered and 55% planning to vote. Women are just slightly more likely to be registered than men (76% to 73%) and to be certain about voting in this year’s election (71% to 68%).

Voting Via Internet

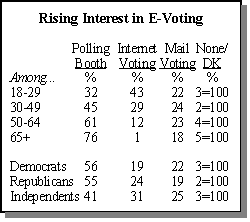
Almost half of the public (47%) would choose voting over the Internet or voting by mail over a voting booth if they had a choice. Almost one-quarter (24%) specifically would prefer the Internet. Young people would much rather use the Internet as a voting tool. Some 46% of men age 18-29, and 41% women age 18-29 would prefer to vote over the Internet. More independents (31%) would like to vote over the Internet than Democrats (19%) or Republicans (24%).

Disabled Voters

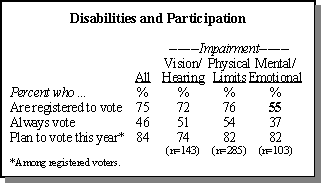
For the most part, voter registration and intentions to vote are as high among people with disabilities as in the rest of the population. There is one important exception: Those who identify themselves as having physical, mental or emotional conditions that increase the difficulty of learning, remembering or concentrating report lower rates of registration and regular voting than the general public.

However, Americans with vision or hearing loss and conditions which limit physical activities are just as likely to be registered to vote as the general population and as likely to say they always vote in elections. The survey explored the possibility that the older age profile of people with disabilities masked a turnout problem among them, as older people turnout at higher rates than younger people. But even when age was taken into account, only minor differences in registration and intention to vote were observed between disabled and non-disabled Americans.

While disabled people vote at relatively high rates, they more often cite getting to the polls as a barrier to voting compared to the general public. Among those who do not always vote, 44% of people with conditions that impair physical activity mention this as a reason for not voting. By contrast, only 26% of the public cites this as a reason for not voting.

Disabilities are measured on the survey using definitions from the U.S. Census. Overall, 21% of respondents identified themselves as having at least one of the three types of conditions listed, with 7% citing vision or hearing impairment, 14% citing conditions that limit physical activities, and 6% citing mental or emotional conditions.

III. Voters Judge the Candidates, the Campaign and the Media

Far More Republicans Satisfied Than in ’96

While Americans are more indifferent to the presidential election than at this stage in the campaigns of 1992 or 1996, they also are more satisfied with their choice of candidates. Indeed, more than six-in-ten (62%) express satisfaction with the candidates, far more than at a comparable point in the Clinton-Dole campaign of four years ago (46%), or the 1992 race between Clinton and Bush (37%).

The biggest jump in satisfaction comes among Republicans, many of whom were turned off by the Clinton-Dole match-up. Nearly three-quarters of Republicans (73%) are content with this year’s candidate slate, a 24% increase from 1996. The change in GOP attitudes is striking; in 1996, nearly as many Republicans were dissatisfied by their choices as satisfied (48%-49%). It also represents a major shift from 1992, when just 47% of Republicans were satisfied with the candidates.

Democrats and independents are also more pleased with their choices this election. Two-thirds of Democrats (66%) express satisfaction with the Gore-Bush contest, up 10 percentage points from four years ago and 30 points from eight years ago. A majority of independents are satisfied with the match-up (52%), compared to 36% who were content at this stage in 1996 and 30% in 1992.

This rise in satisfaction with the candidates has been accompanied by a more modest increase in the number of people who find the current campaign interesting. Still, fewer than three-in-ten (28%) rate the campaign to date as interesting, while 65% label it dull. Among Republicans, there has been a nine-percentage point gain since 1996 in the number who find the campaign interesting (from 22% to 31%) along with a 10-point gain among independents (from 14% to 24%).

There is no consensus among those turned off by the campaign as to why they find it boring: Approximately equal numbers point the finger at the quality of the candidates (17%), their campaign styles (18%), and press coverage of the election (17%).

While satisfaction with the candidates has increased, nearly half of Americans (46%) say it is at least possible that they would cast a vote of no confidence in all of the candidates if they had the chance. The number of people who are open to voting for “none of the above” is down from 1992, when a 54% majority expressed at least some interest in casting votes of no confidence.

Reflecting their lower rates of satisfaction with the candidates, far more independents than Democrats or Republicans prefer the none-of-the-above option. Fully six-in-ten independents say it as at least possible they would cast a vote of no confidence with the candidates, compared to 41% of Democrats and 35% of Republicans.

Bush Gets Better Grades

Rating the candidates on their persuasive abilities, the public gives Bush slightly higher grades than Gore. Equally important, Bush’s campaign is much more highly regarded than Dole’s was at a comparable stage in the campaign four years ago.

Four-in-ten registered voters award Bush letter grades of “A” or “B” for making a convincing case for his election; just over half that number (22%) gave the same grades to Dole in July 1996. Bush has made significant gains among GOP partisans. While 64% of Republican voters give Bush an A or a B, just 41% awarded those grades to Dole.

Bush’s narrow edge over Gore probably reflects his lead in the presidential horse race. While 40% give Bush the highest grades, slightly more than one-third (35%) give Gore an A or B. Bush also gets higher marks from Democrats (24% award him an A or B) than Gore earns among Republicans (15%). And more independents give Bush the top letter grades (35%) than Gore (29%).

Few Seek Campaign News

The public’s declining interest in politics is shown in the shrinking audiences for campaign coverage provided by newspapers, television news and other traditional media. And these smaller audiences, by and large, are not comprised of political junkies. Only a small minority (15%) actually goes through the effort of looking for campaign news; the vast majority (83%) typically comes across such information by happenstance.

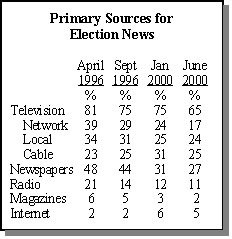
Most Americans (65%) cite television as their primary source for campaign news, but that figure is down sharply from the last presidential campaign, when about eight-in-ten cited television as their top election news source. The television audience has also slipped since the beginning of this year, when 75% named TV news as the main source of campaign information. Network news, which as recently as 1992 was named as a top source by half of Americans, now is mentioned by fewer than one-in-five (17%).

One-quarter mention cable news as their primary source for election news, about the same as in 1996 and down from 31% in January of this year, a period when both parties were waging primaries battles.

Newspapers are cited as a primary source by one-quarter of Americans, down significantly from four years ago when more than four-in-ten named newspapers as the top source. Newspapers are far more popular as an election news source among college graduates (36%) than either network news (18%) or cable news (22%). Older, affluent Americans are also more reliant on newspapers than other news outlets to keep up with the campaign.

Not even the rise of the Internet as a news source has been able to stem the overall decline in the audience for campaign news. Just 5% of the public — and 8% of those who go online — cite the Internet as their main election news source. While young people are more likely than those in other age groups to cite the Internet, less than one-in-ten of those age 18-29 (9%) name the Internet as their primary source for campaign news.

Active Consumers Prefer Newspapers, Cable

Older Americans are more likely than younger people to actively seek campaign news. Still, only 21% of those age 50 and over — who tend to be heavier consumers of most types of news — say they go looking for election news while 77% say they do not. Less than one-in-ten of those age 18-29 (9%) and 12% of those 30-49 search for campaign news.

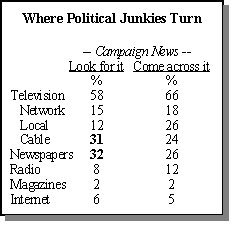
Those who go looking for campaign news turn to different outlets than the much larger group that does not intentionally seek such information. Fewer active consumers of political news turn to television (58%) than those who do not search for such news (66%). Active consumers are slightly more likely to use newspapers (32%) and cable (31%) to learn about the campaign than passive consumers of political news (26% and 24%, respectively).

Local television news is named as the primary source for political information by fully one-quarter (26%) of the passive political news audience, compared to only 12% of the active consumers of such news. Both groups are about as likely, or unlikely, to turn to the Internet for political news, with 6% of the active group and 5% of passive consumers of political news going online to learn more about the campaign.

Fair Ratings for Press Coverage

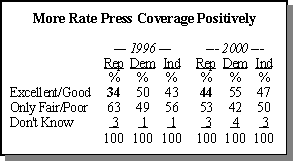
A solid majority of Americans (60%) are satisfied with the amount of coverage the media is devoting to the presidential campaign. Fewer (48%) rate that coverage good or excellent. But that 48% represents an increase of six percentage points from July 1996.

For the most part, Americans who say they are less interested in the current election than the 1996 campaign do not blame the media. Indeed, those who are less interested give the media almost the same high marks as the general public, with 46% of this group rating coverage good or excellent. Slightly more than half (51%) of those who are more interested in the current campaign grade coverage as good or excellent.

Republicans, who are far more satisfied with the candidates this time around, are also more content with the way the press is covering the campaign. During the last campaign, just over one-third of Republicans (34%) rated coverage good or excellent; 44% consider coverage of the current campaign good or excellent. Democrats and independents are slightly more satisfied with press coverage this time around.

Most Americans are satisfied with the amount of campaign coverage, regardless of their partisan leanings. Solid majorities of all age groups also say news organizations are providing the right amount of coverage. But young people, who are tuning into campaign 2000 at lower rates than their elders, are somewhat more likely to say that the media is devoting too little coverage to the campaign. A sizable minority of those age 18-29 (24%) say news organizations are giving too little coverage to the campaign; 19% of those age 30-49 and 10% of those age 50 and older agree that the amount of coverage has been inadequate.

Republicans Like Gore Plan

Nearly seven-in-ten Americans (69%) say they plan to watch this year’s presidential debates. That figure is likely to grow as the debates approach. In October 1992, for instance, fully eight-in-ten (83%) said they planned to watch that fall’s debates.

Young people and those who have not registered to vote are less interested in viewing the debates. About six-in-ten of those age 18-29 (61%) say they plan to watch the debates, compared to 69% of those 30-49 and 73% of those 50 and older. More registered voters intend to watch the debates (73%) than those who are not registered (58%).

Americans are favorably disposed to the notion of replacing campaign political advertising with a series of weekly debates by the candidates. A majority (54%) say they would prefer a campaign in which the candidates faced off in weekly debates, while 36% opt for the current system of political ads with only a few debates.

Interestingly, slightly more Republicans than Democrats are enthused about the weekly debate proposal — although the idea has been promoted by Gore, the Democratic standard-bearer. While 58% of Republicans prefer more debates and no paid ads, 53% of Democrats agree. Independents also opt for the weekly debates, by a 55%-38% margin.

IV. What the Voters Want

Coverage of Issues, Debates Popular …

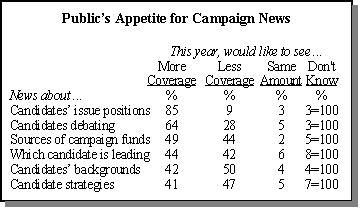
Most Americans say they want news organizations to tell them what the candidates stand for — not what they are like personally. Fully 85% say they want more news coverage of the candidates discussing their positions on issues, while 64% want more coverage of the candidates debating each other.

At the same time, half of Americans say they want less news coverage of the candidates discussing their personal backgrounds and experiences. This level of dissatisfaction with coverage of candidates’ backgrounds and experiences reflects a significant jump from the 41% who wanted less of this type of coverage in the fall of 1991.

The public is more evenly divided over news coverage of campaign finances — 49% would like more coverage about the sources of candidates’ campaign money, while 44% would like to see less coverage. Similarly, 44% would like more coverage about which candidate is leading in the polls and just 41% would like more news about the strategies candidates are using in their campaigns.

Men are slightly more interested than women in news coverage about the debates and candidate fund-raising. Fully 69% of men say they want more coverage of the candidates debating, for example, compared to 58% of women. Similarly, more than half of men (52%) would like more coverage about the sources of candidates’ campaign money, compared to just 45% of women.

There are few real differences between those who want to see more coverage of these topics and those who want to see less coverage when it comes to rating press coverage of the campaign, with one exception. Among those who would like to see more news coverage of which candidate is leading in the polls, 55% give press coverage of the campaign a rating of excellent or good. In contrast, just 46% of those who would like less coverage about which candidate is ahead give the press as favorable a rating.

… But Character Still Most Important

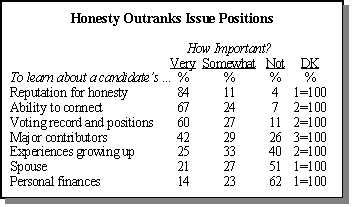
Even as Americans look for more coverage of campaign issues and less coverage of candidates’ backgrounds and experiences, several key personal characteristics nonetheless remain at the top of the list of things voters want to learn before Election Day. Fully 84% of Americans say it is very important for them to learn about a candidate’s reputation for honesty, and 67% say it’s very important to learn how well a candidate connects with average people.

Notably, each of these factors are seen as important by more people than say the same about a candidate’s voting record or policy positions, which is rated as very important by 60% of Americans. Just 42% say learning about a candidate’s major campaign contributors is very important, while one-in-four want to learn about a candidate’s experiences growing up.

For some of these characteristics, the things voters want most to learn about the candidates varies across party lines. Republicans are nearly unanimous in rating a candidate’s reputation for honesty as very important (92%), while 84% of independents and just 78% of Democrats say the same. In contrast, Democrats care more about whether candidates can connect with average people. Fully 71% of Democrats say this is a very important quality to learn about, compared to 62% of Republicans.

Economy, Gas Prices Emerging Issues

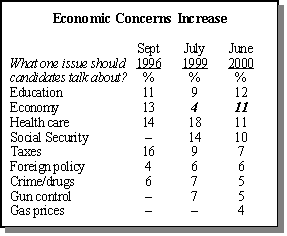
Education, health care, and Social Security top the list of issues people want the candidates to talk about this year. But the economy may be emerging as a more important campaign issue for voters, as well.

Roughly one-in-ten Americans (11%) mentioned economic issues when asked what one issue they would most like to hear the candidates talk about. This puts the economy on a par with education (12%), health care (11%), and Social Security (10%), and is a substantial increase from the 4% who volunteered issues having to do with the economy a year ago. Another 4% of Americans mentioned gas prices as the one issue they want the candidates to focus on.

Talk about the government’s budget surplus over the past several years seems to have eased much of the public concern about federal spending and the national debt. Just 2% mentioned the federal budget and debt as the issue they most want candidates to talk about, down from as many as 14% in 1995.

Many See Need for Change

If this election is a debate over change versus continuity, Americans are narrowly divided on the question– though slightly more see a need for major change. Nearly half (47%) say it is more important for the next president to make major changes in national policy to solve problems that are not getting any better, while 41% say the next president should continue policies that are now leading to improved conditions around the country.

Not surprisingly, most Republicans — 61% — say the country needs major changes, while on balance Democrats favor continuity (49% say continue current policies, 40% say make major changes). Independents are evenly divided, with 42% favoring current policies and 45% favoring major change.

Americans are not as narrowly divided on the question of continuing the policies of the Clinton presidency, however. Just 40% say they would like the next president to offer programs similar to those of the Clinton administration, while 52% want a president who offers different policies and programs. While opinion on this question falls sharply along party lines, fully half of independents say they want the next president to pursue different programs and policies.

But regardless of party, Americans across the board believe the country needs strong leadership that tries to solve problems “without worrying how Congress and the Supreme Court might feel.” Nearly two-thirds (63%) favor strong leadership, while just 27% take the opposite view, saying strong leadership might be dangerous. Support for a strong presidency is unchanged from eight years ago, but substantially greater than in the post-Watergate period of 1976.

News Interest Index: Gas Prices Top News Story

The escalating price of gasoline was the month’s top news story. Interest was particularly strong in the Midwest, where gas prices have been highest. Overall, 61% of the public followed this story very closely, but nearly seven-in-ten (69%) of those living in the Midwest tracked it very closely. Interest in gas prices has not been this high since the Persian Gulf crisis in October 1990.

Interest in the presidential campaign has increased slightly, with 23% following it very closely in June compared to 18% in April. More Republicans are paying close attention to the campaign (28%) than either Democrats (24%) or independents (19%). Americans under age 30 continue to show less interest than older people in the election; only 16% are following it very closely, compared to 31% of those age 50 and older.

A federal judge’s ruling that Microsoft should be broken up was followed very closely by 28% of the public. Internet users have taken a particularly strong interest in this story. Nearly one-third (32%) of those who go online followed the ruling very closely compared to 22% of non-Internet users. Men have paid much more attention to this story than women (34% vs. 21%).

One-quarter of the public paid close attention to the reports about missing files from the Los Alamos nuclear laboratory. Republicans have been more in interested in this story than Democrats or independents (35% compared to 21% and 22%, respectively).

The recent summit between President Clinton and Russian President Putin was followed very closely by only 9% of the public. That is about the same percentage that paid close attention to Clinton’s 1997 summit with former Russian President Boris Yeltsin. There has been a steep decline in attention to these meetings since the end of the Cold War; fully one-third of the public closely followed President George Bush’s summit with Soviet leader Mikhail Gorbachev a decade ago.

Methodology

Results for the main survey are based on telephone interviews conducted under the direction of Princeton Survey Research Associates among a nationwide sample of 2,174 adults, 18 years of age or older, during the period June 14-28, 2000. For results based on the total sample, one can say with 95% confidence that the error attributable to sampling and other random effects is plus or minus 2.5 percentage points. For results based on either Form 1 (N=1,089) or Form B (N=1,085), the sampling error is plus or minus 3.5 percentage points. For results based on Registered Voters(N=1,673), the sampling error is plus or minus 3 percentage points.

Results for Q.9/Q.9a through Q.14 concerning candidate preferences are based on interviews conducted June 14-21, 2000 (N=1,509 Registered Voters), the sampling error is plus or minus 3 percentage points. In addition Q.9/Q.9a was asked of a separate sample during the period June 23-30, 2000 (N=463 Registered Voters), with a sampling error of plus or minus 5 percentage points.

In addition to sampling error, one should bear in mind that question wording and practical difficulties in conducting surveys can introduce error or bias into the findings of opinion polls.

Survey Methodology in Detail

The sample for this survey is a random digit sample of telephone numbers selected from telephone exchanges in the continental United States. The random digit aspect of the sample is used to avoid “listing” bias and provides representation of both listed and unlisted numbers (including not-yet-listed). The design of the sample ensures this representation by random generation of the last two digits of telephone numbers selected on the basis of their area code, telephone exchange, and bank number.

The telephone exchanges were selected with probabilities proportional to their size. The first eight digits of the sampled telephone numbers (area code, telephone exchange, bank number) were selected to be proportionally stratified by county and by telephone exchange within county. That is, the number of telephone numbers randomly sampled from within a given county is proportional to that county’s share of telephone numbers in the U.S. Only working banks of telephone numbers are selected. A working bank is defined as 100 contiguous telephone numbers containing three or more residential listings.

The sample was released for interviewing in replicates. Using replicates to control the release of sample to the field ensures that the complete call procedures are followed for the entire sample. The use of replicates also insures that the regional distribution of numbers called is appropriate. Again, this works to increase the representativeness of the sample.

At least five attempts were made to complete an interview at every sampled telephone number. The calls were staggered over times of day and days of the week to maximize the chances of making a contact with a potential respondent. All interview breakoffs and refusals were re-contacted at least once in order to attempt to convert them to completed interviews. In each contacted household, interviewers asked to speak with the “youngest male 18 or older who is at home.” If there is no eligible man at home, interviewers asked to speak with “the oldest woman 18 or older who is at home.” This systematic respondent selection technique has been shown empirically to produce samples that closely mirror the population in terms of age and gender.

Non-response in telephone interview surveys produces some known biases in survey-derived estimates because participation tends to vary for different subgroups of the population, and these subgroups are likely to vary also on questions of substantive interest. In order to compensate for these known biases, the sample data are weighted in analysis.

The demographic weighting parameters are derived from a special analysis of the most recently available Census Bureau’s Current Population Survey (March 1999). This analysis produced population parameters for the demographic characteristics of households with adults 18 or older, which are then compared with the sample characteristics to construct sample weights. The analysis only included households in the continental United States that contain a telephone.

The weights are derived using an iterative technique that simultaneously balances the distributions of all weighting parameters.