Introduction and Summary The rhetoric and events of the presidential campaign so far are having little impact on the attitudes of voters nationwide. Voter preferences are being shaped more by general impressions of the candidates than by what they are saying or by what is happening to them along the campaign trail. While many Americans […]
About Pew Research Center
Pew Research Center is a nonpartisan, nonadvocacy fact tank that informs the public about the issues, attitudes and trends shaping the world. It does not take policy positions. The Center conducts public opinion polling, demographic research, computational social science research and other data-driven research. It studies politics and policy; news habits and media; the internet and technology; religion; race and ethnicity; international affairs; social, demographic and economic trends; science; research methodology and data science; and immigration and migration. Pew Research Center is a subsidiary of The Pew Charitable Trusts, its primary funder.
Introduction and Summary The rhetoric and events of the presidential campaign so far are having little impact on the attitudes of voters nationwide. Voter preferences are being shaped more by general impressions of the candidates than by what they are saying or by what is happening to them along the campaign trail. While many Americans […]
Introduction and Summary
The rhetoric and events of the presidential campaign so far are having little impact on the attitudes of voters nationwide. Voter preferences are being shaped more by general impressions of the candidates than by what they are saying or by what is happening to them along the campaign trail.
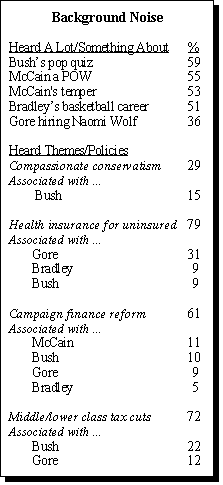
While many Americans have heard of such widely-publicized incidents as George W. Bush’s inability to respond to a reporter’s pop quiz, Al Gore’s hiring of feminist writer Naomi Wolf, or criticisms of John McCain’s temper, these episodes are not meaningfully affecting opinions of the candidates. On more substantive issues, relatively few people are able to associate candidates with their main policy proposals, although many people have heard about health insurance, tax cuts and campaign finance proposals as campaign themes.
McCain and Bill Bradley are both registering slightly increased support in campaigns for their parties’ nominations, according to the latest nationwide Pew Research Center survey of 1,073 adults conducted Dec. 8-12, 1999. Bradley’s status as a former professional basketball player has more of an impact on his support than his plan to provide health insurance for the uninsured, which relatively few Americans know about. Similarly, knowing about McCain’s past as a prisoner of war in Vietnam has a direct bearing on his support, while the recent flap over his temper is having no adverse effect on opinion about him. By the same token, awareness of Bush’s failure to correctly answer questions about the names of world leaders has had no impact on his standing in the polls or on impressions of his qualifications to be president.
The poll, which asked voters to rate the leading candidates on their qualifications, positions on issues and personalities, found that general impressions are more relevant to voter attitudes at this stage than many of the things that have happened in the campaign so far. In addition, views on the general qualifications of the presidential candidates are more important than the specific stands on issues taken by Bush, Bradley and McCain. Personality was also a less important factor in opinions of all three. However, feelings about Gore’s personality are nearly as crucial to his support as beliefs about his qualifications. And the poll found that the vice president is relatively less likeable than the other major candidates.
Tightening Democratic Race
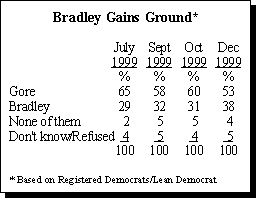
As Bradley’s insurgent campaign continues to gain ground, the race for the Democratic nomination has tightened up in recent weeks. At the same time, Bush has increased his lead over Gore in a possible general election match-up.
Gore now leads Bradley among registered Democratic voters and those who lean Democratic by a margin of 53% to 38%. The vice president’s share of the Democratic vote has fallen seven percentage points since October, precisely the same size as Bradley’s gain.
Much of the movement away from Gore has come from women, particularly white women. In October, white women overwhelmingly preferred Gore over Bradley — 68% to 23%. This month the margin has narrowed significantly — 50% to 38%.
McCain’s Steady Climb
The race for the Republican nomination remains largely unchanged from October, with Bush maintaining his commanding lead. However, McCain has gained support in recent weeks and has quadrupled his share of the vote since July. Today, 64% of Republican voters and Independents who lean Republican say Bush is their first choice for the GOP nomination. That is virtually unchanged from October when 63% considered him their first choice.
But McCain is now the first choice of 17% of Republican voters. This represents a significant increase from October when McCain’s support stood at 10%. In addition, McCain is becoming the most viable alternative to Bush for many voters. Fully 25% now consider the Arizona senator their second choice, up from 12% two months ago.
McCain has greater appeal among older voters than among young and middle-aged voters. In the current poll, 26% of those 50 and older named McCain as their first choice for the GOP nomination; this compares with 10% of those under 50. Much of McCain’s increase in support in recent months can be attributed to his popularity with older voters: In October, 13% in this group said McCain was their first choice vs. the 26% who say so now.
The rest of the Republican field remains in single digits. Steve Forbes is the first choice of 8% of GOP voters. Alan Keyes, Orrin Hatch and Gary Bauer all fall below 5%.
Recent GOP debates appear to have had only a marginal impact on voter preferences. Republican voters who closely followed the debates in New Hampshire and Arizona are slightly more likely to support McCain as their first choice for the party’s nomination, as opposed to those who paid little or no attention — 24% vs. 15%, respectively. Close followers of the debates are slightly less likely to prefer Bush (60% vs. 66%).
Gore’s Struggles
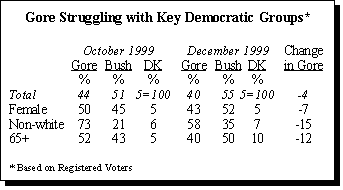
Despite some criticism Bush received from political pundits over his debate performance and lack of foreign policy expertise, the Texas governor actually increased his lead over Gore in recent weeks. Bush’s lead, which had narrowed somewhat between September and October, is back to double-digits. Registered voters now favor Bush over Gore by a margin of 55% to 40%, a slight gain from his 51%-44% advantage in October.
As has been the case throughout the fall, female indecision about Gore is behind much of the fluctuation in the two-way match-up with Bush. In October, women favored Gore over Bush 50% to 45%. Women’s preferences have shifted significantly since then; they now prefer Bush over Gore 52%-43%.
Gore has lost support among other key Democratic constituencies as well. Non-whites, while they still prefer Gore over Bush, have shifted away from the vice president in significant numbers. In October, 73% said they would vote for Gore compared to 58% today.
Senior citizens have also migrated away from Gore. In October, voters 65 and older preferred Gore over Bush by a margin of 52% to 43%. Today, they prefer Bush 50%-40%. While Gore has made some gains among independent voters, he has lost the support of some of his own party faithful. Today, 73% of Democrats say they’ll vote for Gore over Bush. The Texas governor has more solid support from his own party loyalists — 90% of Republicans say they’ll vote for him over Gore.
Bradley fares about as well as Gore in a two-way match-up with Bush. Under this scenario, 54% of voters say they would vote for Bush, while 41% say they would vote for Bradley. Bradley does run stronger than Gore among higher-income voters and those with a college degree.
Other Important Findings and Analyses
The Public Remains Disconnected
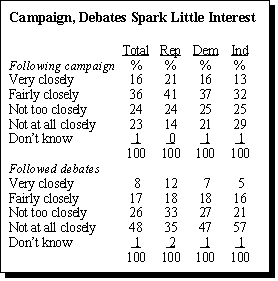
In spite of the accelerated pace of the 2000 presidential campaign, only 16% of the public is following news about candidates very closely. Interest in the campaign has not meaningfully increased since July, despite competitive contests for both parties’ nominations.
Even fewer Americans closely followed the recent GOP candidate debates. Less than one-in-ten (8%) have followed the debates very closely; fully 48% haven’t followed them at all. Even among Republicans, interest in the debates has been low: 12% have followed very closely.
Lack of interest in the campaign is reflected as well in the public’s inattentiveness to several recent campaign developments. Only about one-third (36%) of the public heard about Al Gore hiring Naomi Wolf as a campaign advisor. Just 51% of Americans know that Bill Bradley was a professional basketball player
before entering politics. And similarly small majorities have heard reports about John McCain’s temper (53%) and his experience as a prisoner of war in Vietnam (55%). Slightly more (59%) heard about George W. Bush’s inability to name foreign leaders in a pop quiz posed by a television reporter. Even so, fully 41% of Americans did not hear about this widely reported event.
In addition, the public is having difficulty associating key themes and issues with the candidates who are advocating them. Less than one-third of Americans (29%) have heard about “compassionate conservatism,” which is Bush’s campaign theme. Only 15% associate this phrase with the Texas governor. While Republicans are slightly more likely than Democrats and Independents to have heard about compassionate conservatism, 60% of GOP loyalists are unfamiliar with this phrase.
Americans are more aware of other issues and themes tested in the poll, however, they are less clear about which candidates to associate with those issues. More than three-quarters (79%) of Americans say they have heard the candidates talking about providing health insurance to people currently uninsured. Yet Bradley, who has made this issue central to his campaign, receives very little credit for it. Only 9% of the public associates the former New Jersey senator with expanding health care coverage. Voters are just as likely to associate Bush with this issue. Gore is seen by about one-third of the public (31%) as championing this issue.
Roughly seven-in-ten Americans (72%) have heard the candidates talking about tax cuts targeted at lower and middle-income groups. One-in-five (22%) associate this issue with Bush, who has made tax cuts a centerpiece of his campaign. Another 12% links Gore with this issue.
Though campaign finance reform has been a primary focus of McCain’s Senate career, as well as his presidential campaign, very few Americans associate the Arizona senator with this issue. Fully 61% of the public has heard this issue discussed over the course of the campaign, but only 11% credits McCain.
By and large, these campaign events and issues have had little bearing on voter preferences. Whether the subject is Bush’s failed pop quiz, his theme of compassionate conservatism or his tax cut plan, none of these items have a statistically significant relationship to support for him among GOP voters. Similarly, Democratic voters who heard about Gore’s hiring of Naomi Wolf are no more or less likely to support the vice president in his nomination race with Bradley.
There are a few important exceptions to this pattern. Certain facts about the candidates, relating to their life stories, do seem to make a difference. Taking into account other factors that might influence support for McCain, Republican voters who have heard about the senator’s experiences as a POW in Vietnam are more likely than those who have not heard about this to support McCain for the GOP nomination. Perhaps surprisingly, those who are aware that McCain is reported to have a temper are also more likely to support him in the nomination race.
For Bradley, his experience as a basketball player is a real plus, at least among those Democrats who are aware of his years as a New York Knick. Holding constant other factors, Democratic voters who know that Bradley played in the NBA are more likely to support him for their party’s nomination than those who don’t know this.
Bush Seen as Qualified
General impressions of the candidates — perceptions of their qualifications, their positions and their personalities — are more closely linked to support for their campaigns than the issues and events discussed above. Overall, the public views Bush, McCain, Gore and Bradley as qualified to be president. There is no evidence in this poll to suggest that Bush is seen as lacking in stature or experience. If anything, the Texas governor is seen as the most qualified candidate in the group. Gore is not viewed as being any more qualified than Bradley.
By and large, the public gives the candidates high marks for their stands on the issues and for being personally likeable. However, Gore lags behind on both of the qualities. Six-in-ten (61%) of those able to rate the vice president say he has good positions on the issues. This compares with 70% or better for Bradley, McCain and Bush. Similarly, 67% find Gore personally likeable compared to 80% or better for the other three contenders.
In most cases, candidate qualifications matter more than issue positions in determining whom voters support. Among Republican voters, assessments of Bush’s qualifications are more closely linked to his support than are feelings about his stands on the issues or views of him personally. The same is true for McCain and, among Democratic voters, for Bradley.
For Gore, however, personality matters almost as much as qualifications. Whether or not Democratic voters see Gore as personally likeable is nearly as strong a predictor of support for Gore as are voters’ assessments of his qualifications. Overall, Gore is seen as being less likeable than Bradley.
Modest Support for Canal Treaty
More than two decades after the bitter political debate over the Panama Canal treaty, Americans remain divided over the prospect of actually turning the canal over to Panama. With the Dec. 31 deadline for transferring the canal approaching, 46% say they favor the treaty, against 40% who oppose the agreement. Not much has changed in public attitudes on this subject since the Senate ratified the treaties in 1978. In February of that year, shortly before the Senate debate, 43% favored the pact, with 38% opposed.
While control over the canal has receded as a political issue, most of those surveyed (60%) are aware that the official turnover will take place at year’s end. But there is a clear generation gap in terms of support for the treaty between senior citizens and younger Americans.
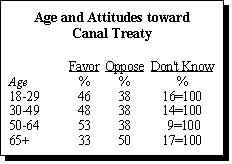
Three-quarters (76%) of those aged 65 and over say they have heard about the canal transfer. But half of those 65 and older oppose the agreement — the only age group in which opponents outnumber supporters — while 33% favor it. Among those 65 and older who know about the transfer, opposition is even more lopsided, with 58% opposed and just 35% in favor. People under age 50 tend to be less aware, but more supportive, of the transfer and treaty.
Almost as many Americans in the 50-64 age group (74%) as in the older group are aware that the United States is about to relinquish control over the canal. But people in this category have a more favorable impression of the treaty, supporting it 53% to 38%. Among 18-29 year-olds, who either were not born when the canal debate raged or were probably too young to remember it, only 42% are aware of the transfer — the lowest percentage of any age group. But this group also favors the treaty, 46% to 38%. And those in this category who have heard of the transfer support the treaty by a 2-to-1 margin, 62% to 31%.
Conservative Republicans vehemently opposed the treaty in the late 1970s, and many Republicans still harbor doubts about the pact. Republicans are generally more aware of the canal transfer than Democrats (69% to 56%). Republicans narrowly favor the treaty (47% to 44%) while Democrats support it by a wider margin (49% to 36%).
Optimism Reigns
Americans look back at 1999 with satisfaction and approach the start of the 21st century with high hopes. Two-thirds (66%) believe 2000 will be better than 1999, up from 59% last year and the highest percentage since the question was first posed by Gallup in 1981.
This has been a good year for most Americans personally, and, despite an unpopular presidential impeachment, a slim majority considers 1999 to have been a good
year for the nation. When asked to assess 1999 from a personal standpoint, nearly three-quarters (74%) consider it a good year, approximately the same as last year. That percentage declines to 57% — also similar to last year’s result — when people consider how well the country fared in 1999.
An overwhelming majority (86%) of those in the highest annual income bracket — $75,000 or more — say 1999 has been good for them; a smaller but healthy majority (64%) of those making $20,000 or less agree. Optimism dampens only slightly when predicting what 2000 will bring: 75% of the high income group believes the new year will be better than 1999, compared to 60% of those with the lowest incomes.
Men have a more positive assessment of 1999 than women. Two-thirds (66%) of men say 1999 has been good for the country compared to less than half (49%) of women. And a strong majority (72%) of men say 2000 will be better than 1999 while 61% of women agree.
As the millennium approaches, Americans are increasingly blasé about the start of the new century. Only 23% say the year 2000 has special significance, down 10 percentage points from April of this year. Nearly three-quarters (74%) are indifferent about 2000: They say it is just another year on the calendar.
News Interest Index
Reports of the crash of EgyptAir flight 990 and the investigation into what happened topped the news interest index for the month. Three-in-ten people say they followed news about the crash very closely. Just 18% say the same of the failure of the Mars Polar Lander spacecraft to send data back to Earth.
News about the protests at the World Trade Organization meeting in Seattle captured the attention of one-in-five Americans (18%), with people in the West expressing the greatest interest in the story. Fewer people followed coverage of the agreement allowing China to join the WTO (12%), although more members of labor union households followed news of the agreement with China at least fairly closely (50%) than did those in non-union households (39%).
Only one-in-ten people (11%) say they followed reports of the antitrust trial against Microsoft, relatively unchanged from interest in this story in November 1998. Attention to news about the lawsuit was higher among those who go online than those who do not (52% vs. 32%, respectively, say they followed it at least fairly closely).
Just 11% of Americans say they paid any attention to news about the fighting between the Russian military and rebels in Chechnya. Interest in the conflict has changed little since it was measured four years ago. More men than women say they followed coverage of Russian military action in the area at least fairly closely (16% vs. 7%).
E-shopping Expansion
The number of people purchasing goods or services over the Internet has increased significantly over the past year. Nearly three-in-ten (28%) say they have made a purchase online, up from 17% at the beginning of the year, while almost one-in-five (19%) say they have made a purchase within the last month. Among the more affluent and better educated Americans, more than half (61% and 55%, respectively) say they have bought something over the Internet.
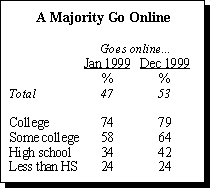
More generally, the year ends with a majority of Americans going online (53%), up from 47% in January 1999. Continuing the trend toward a broadening of the Internet population, the increase was slightly greater among those with only a high school degree (up 8 percentage points) than among those with a college degree (up 5 percentage points). Likewise, the largest gains in going online by income were among those earning less than $20,000 a year (34% up from 22% in January). Overall, the largest increase in online usage over the past year was among men ages 18-29 (82% up from 66%).
Genetically-Altered Foods Little Known
Most Americans know little about genetically-altered foods yet they overwhelmingly support labeling such products. The vast majority — 84% — wants the Food and Drug Administration to require labels identifying products that have been genetically-altered to taste better, last longer, or increase crop yields. Those who have heard a lot about this subject and even those who have purchased genetically-altered foods agree that labels are needed.
About half (49%) of Americans have heard at least something about genetically-altered foods. Half also say that, to their knowledge, they have never bought such foods, and a plurality — 40% — don’t know whether their grocer stocks these items. Yet news reports paint a different picture. American grocery stores do carry many genetically-altered products and people have most likely eaten such foods whether they are aware of it or not, according to recent news reports in Time magazine and elsewhere.
Men, college graduates, and those with higher incomes tend to be more aware of genetically-altered foods and somewhat less concerned about them. While 28% of men say they have bought these foods, only 17% of women agree. Yet 90% of women want the FDA to require labels, compared to 77% of men.
Among college graduates, 35% say their grocer sells modified foods and 73% support labeling. Among those who have completed high school, those figures are 20% and 89%, respectively. Almost one-third (32%) of those with at least a $75,000 annual income say they have bought genetically-altered foods, compared to just 18% of those making $20,000 or less. Three-quarters of those in the highest income bracket want these foods labeled while 88% of those making $20,000 or less want labels.
An overwhelming majority, regardless of whether or not they have heard a lot about genetically-altered foods or have consumed such products, wants labels. Of the relatively small group that has heard a lot about this subject, nearly three-quarters (74%) support labeling. Similarly, most people (72%) who say they have bought genetically-altered foods want the FDA to require labels. By contrast, almost nine-in-ten Americans (89%) who have heard nothing at all about genetically-altered foods want labels. Of those who say they are not aware of purchasing genetically-altered foods, 90% support labeling.
Methodology
Results for the survey are based on telephone interviews conducted under the direction of Princeton Survey Research Associates among a nationwide sample of 1,073 adults, 18 years of age or older, during the period December 8-12, 1999. For results based on the total sample, one can say with 95% confidence that the error attributable to sampling and other random effects is plus or minus 3.5 percentage points. For results based on either Form 1 (N=518) or Form 2 (N=555), the sampling error is plus or minus 5 percentage points. For results based on registered voters (N=745), the sampling error is plus or minus 4 percentage points.
In addition to sampling error, one should bear in mind that question wording and practical difficulties in conducting surveys can introduce error or bias into the findings of opinion polls.
REGRESSION ANALYSES IN DETAIL
The extent to which voters’ general opinions about the candidates and awareness of campaign events and issues are related to their support for candidates in the primary elections was analyzed in part with multiple regression analyses. One table in the text presents the unstandardized regression coefficients associated with items included in the analyses. These values are one measure of the relative statistical association between an item and support for a candidate. Items which are not significantly related to support are identified with ns (i.e., not statistically significant).
A separate multiple regression analysis was calculated for each candidate. In addition, the impact of campaign events and issues (e.g., having heard about George W. Bush’s pop quiz or that Bill Brad
ley played professional basketball) and the impact of general impressions of the candidates were measured in separate multiple regressions. For each analysis, demographic factors including age, education, sex, race, and region, as well as measures of interest in the campaign, were taken into account by including them as factors in the regression model.
SURVEY METHODOLOGY IN DETAIL
The sample for this survey is a random digit sample of telephone numbers selected from telephone exchanges in the continental United States. The random digit aspect of the sample is used to avoid “listing” bias and provides representation of both listed and unlisted numbers (including not-yet-listed). The design of the sample ensures this representation by random generation of the last two digits of telephone numbers selected on the basis of their area code, telephone exchange, and bank number.
The telephone exchanges were selected with probabilities proportional to their size. The first eight digits of the sampled telephone numbers (area code, telephone exchange, bank number) were selected to be proportionally stratified by county and by telephone exchange within county. That is, the number of telephone numbers randomly sampled from within a given county is proportional to that county’s share of telephone numbers in the U.S. Only working banks of telephone numbers are selected. A working bank is defined as 100 contiguous telephone numbers containing three or more residential listings.
The sample was released for interviewing in replicates. Using replicates to control the release of sample to the field ensures that the complete call procedures are followed for the entire sample. The use of replicates also insures that the regional distribution of numbers called is appropriate. Again, this works to increase the representativeness of the sample.
At least five attempts were made to complete an interview at every sampled telephone number. The calls were staggered over times of day and days of the week to maximize the chances of making a contact with a potential respondent. All interview breakoffs and refusals were re-contacted at least once in order to attempt to convert them to completed interviews. In each contacted household, interviewers asked to speak with the “youngest male 18 or older who is at home.” If there is no eligible man at home, interviewers asked to speak with “the oldest woman 18 or older who is at home.” This systematic respondent selection technique has been shown empirically to produce samples that closely mirror the population in terms of age and gender.
Non-response in telephone interview surveys produces some known biases in survey-derived estimates because participation tends to vary for different subgroups of the population, and these subgroups are likely to vary also on questions of substantive interest. In order to compensate for these known biases, the sample data are weighted in analysis.
The demographic weighting parameters are derived from a special analysis of the most recently available Census Bureau’s Current Population Survey (March 1999). This analysis produced population parameters for the demographic characteristics of households with adults 18 or older, which are then compared with the sample characteristics to construct sample weights. The analysis only included households in the continental United States that contain a telephone.
The weights are derived using an iterative technique that simultaneously balances the distributions of all weighting parameters.