
Pew Research Center

FOR RELEASE AUGUST 7, 1998

More Rancorous, But Not “Do Nothing”

The View of Congress

FOR MEDIA OR OTHER INQUIRIES:

Communications Department
202.419.4372
www.pewresearch.org

RECOMMENDED CITATION

Pew Research Center, August 1998, "More Rancorous, But Not “Do Nothing”"

About Pew Research Center

Pew Research Center is a nonpartisan, nonadvocacy fact tank that informs the public about the issues, attitudes and trends shaping the world. It does not take policy positions. The Center conducts public opinion polling, demographic research, computational social science research and other data-driven research. It studies politics and policy; news habits and media; the internet and technology; religion; race and ethnicity; international affairs; social, demographic and economic trends; science; research methodology and data science; and immigration and migration. Pew Research Center is a subsidiary of The Pew Charitable Trusts, its primary funder.

© Pew Research Center 2026

Table of contents

  • About Pew Research Center
  • More Rancorous, But Not “Do Nothing”
  • Other Important Findings
  • About this Survey

More Rancorous, But Not “Do Nothing”

The View of Congress

Introduction and Summary

As Congress heads home for the summer campaign season, both parties face tough sells for their election themes. Despite Democratic charges of a Republican-led do-nothing Congress, Americans see the 105th Congress as no different than others in recent memory. But the GOP will have to shore up its image on issues, as the public lines up with Democrats on the issue of health care reform.

The dominant perception of this Congress is that it has been more rancorous than usual: 51% of the public says members have been bickering and opposing one another more than usual. Asked about Congress’ productivity, only 15% of Americans say that it has accomplished less than most — 18% think it has accomplished more. Even among those who disapprove of the Republican leadership, 55% think that this Congress has been as active as previous ones.

These are the principal findings of a Pew Research Center telephone survey of 1,189 adults, conducted July 29-August 2, 1998. The survey has a margin of error of +/- 3.5%.

Public Wants Action on HMOs

Americans’ perception of an active Congress may reflect public support for several proposals to regulate health maintenance organizations (HMOs) and expand patient rights. Early this summer, the public ranked HMO regulation as very important to them personally and for the country.1 This month, even when presented with arguments against new restrictions, most Americans back federal involvement.

Fully 53% of Americans support the creation of national standards for patients in HMOs and managed care plans; only 35% say that such regulation would “get the government too involved in health care.” Similarly, 53% of the public supports changing the law to allow patients to sue insurance companies that deny or delay medical benefits. Only 35% say that such changes would “increase the costs of insurance too much.”
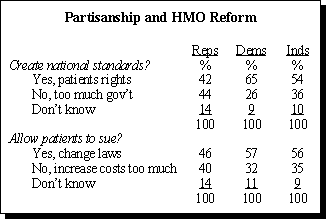
Not surprisingly, the Democratic rank and file support both proposals: 65% favor national standards and 57% favor granting patients the right to sue their insurance companies.

Republicans are divided in their attitudes toward national standards (42% support vs. 44% oppose). A plurality favors legislation to allow lawsuits (46% vs. 40% oppose). Majorities of Independents support both proposals.

Americans’ preference for government regulation of managed care aligns them with the Democratic Party on this issue. A plurality of the public (39%) expresses more confidence in congressional Democrats “to do the right thing regarding the regulation of HMOs”; only 29% say the same of the Republicans on the Hill. The remainder are undecided.

A Back Seat for a Tax Cut
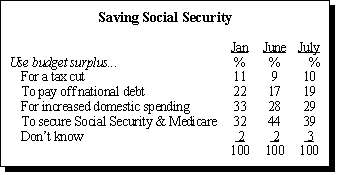
In another top issue on the congressional agenda — the allocation of a potential budget surplus — the public supports President Clinton’s call to use a surplus to stabilize Social Security and Medicare. A clear plurality (39%) choose this option over increased spending on domestic programs (29%), paying off the national debt (19%) or providing a tax cut (10%).

When the choice is simply between a tax cut and making the Social Security system financially sound, Americans overwhelmingly opt for shoring up the retirement program by a margin of more than three-to-one: 76% favor focusing on Social Security; 22% favor a tax cut. Even a 68% majority of Republicans prefer dealing with these entitlements over cutting taxes.

Like their elder counterparts, Generation Xers choose spending over taxes by a wide margin (65% vs. 33%, respectively). However, those between the ages of 18 and 29 are the least supportive of any age group. When given the option, they overwhelmingly select increased spending on domestic programs over stabilizing Social Security (48% vs. 19%, respectively).

Congressional Horse Race
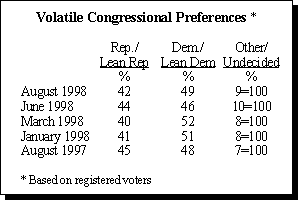
Partisan preferences in congressional voting intentions have fluctuated throughout the year, with the two parties in a statistical dead heat as recently as June. Today, Democrats hold a 49%-to-42% advantage over Republicans among registered voters. The unsettled opinion on this question may reflect a lack of conviction and engagement. Just 13% of the public reports paying very close attention to news about the campaign.

Previous Pew Research Center surveys have shown greater indications of Republican strength. There is stronger support for incumbents this year than four years ago and an expected lower-than-usual turnout may also help GOP chances.2

Other Important Findings

China’s Image

Though few Americans paid very close attention to President Clinton’s trip to China, significantly more Americans see China moving in the direction of democracy and capitalism today than did so before Clinton’s June visit. Fully 35% of the public thinks that China’s government is “becoming more democratic” and “allowing more freedoms”; only 26% thought so in an October 1997 Gallup poll. An even greater number (41%) think that the Chinese economy is becoming more like the “free-market system found in the United States,” up from 34% in the earlier survey.

President Clinton’s trip attracted the attention of only a small group of Americans; just 14% followed the story very closely. Of those, almost half (47%) believe China’s government is becoming more democratic; 50% think its economy is moving toward a free-market system.

However, Americans’ overall opinion about China stayed in its post-Tiananmen Square slump. Only 32% of the public gives China a “very” or “mostly” favorable rating. This is roughly comparable to public opinion since the demonstrations but significantly less than the 72% who rated China favorably prior to the government crackdown.

Attitudes toward Mexico and Russia have also soured over the past several years. Less than half (46%) of the public has a favorable impression of Mexico, a dip of 11 percentage points since March 1996. Opinion toward Russia has taken an even greater fall: Only 37% of Americans give it a favorable rating, down from 56% last November.

The public is even more critical of the two nations that conducted nuclear tests in May. India is given a favorable rating by 29% of Americans; Pakistan is viewed positively by only 16%. Indeed, Pakistan is almost as unpopular as Iran, which receives favorable ratings from only 11% of the public. With 36% of the public highly attentive to news of the nuclear explosions this spring, it was the most closely followed international story of the decade that did not involve U.S. troops.

News Interest Index

News about the shooting deaths of two police officers at the United States Capitol riveted the American public last month. With 45% saying they followed the news very closely, it was the third most closely followed story of the year. Only the school shootings in Arkansas and Oregon drew larger audiences.

The searing heat wave is of considerably more interest to ordinary Americans than are allegations about President Clinton and Monica Lewinsky: 38% followed the weather very closely compared to just 29% who followed the scandal last month. During the time the poll was in the field, the headlines were dominated by news that both Clinton and Lewinsky would provide testimony in the case, but interest in the story showed no increase over June, when it was off the front pages.

News about the end of the United Auto Workers’ strike drew the very close attention of 20% of the general public and 31% of union members. The cloning of mice in Hawaii was followed closely by only 6% of Americans, far less than the 17% who tracked news about the cloned sheep, Dolly.

The media itself was in the news last month, with CNN and Time magazine admitting that their story about possible nerve-gas use during the Vietnam War was inaccurate. Half (49%) of the public is aware of this admission, and 55% think the story is part of a larger trend, saying the media as a whole is generally less accurate these days.

Possible Republican presidential contender George W. Bush has also been in the news lately. Fully 56% of the public can correctly identify him as the governor of Texas or the son of the former president. Republicans are no more likely to know Bush than are Democrats (61%-to-57%). Even half (52%) of Independents can correctly identify the Texas governor. Only 17% of the public confused him with his famous father, former President George Bush.

About this Survey

Results for the survey are based on telephone interviews conducted under the direction of Princeton Survey Research Associates among a nationwide sample of 1,189 adults, 18 years of age or older, during the period July 29 – August 2, 1998. For results based on the total sample, one can say with 95% confidence that the error attributable to sampling and other random effects is plus or minus 3.5 percentage points. For results based on either Form 1 (N=595) or Form 2 (N=594), the sampling error is plus or minus 5 percentage points.

In addition to sampling error, one should bear in mind that question wording and practical difficulties in conducting surveys can introduce error or bias into the findings of opinion polls.

Survey Methodology in Detail

The sample for this survey is a random digit sample of telephone numbers selected from telephone exchanges in the continental United States. The random digit aspect of the sample is used to avoid “listing” bias and provides representation of both listed and unlisted numbers (including not-yet- listed). The design of the sample ensures this representation by random generation of the last two digits of telephone numbers selected on the basis of their area code, telephone exchange, and bank number.

The telephone exchanges were selected with probabilities proportional to their size. The first eight digits of the sampled telephone numbers (area code, telephone exchange, bank number) were selected to be proportionally stratified by county and by telephone exchange within county. That is, the number of telephone numbers randomly sampled from within a given county is proportional to that county’s share of telephone numbers in the U.S. Only working banks of telephone numbers are selected. A working bank is defined as 100 contiguous telephone numbers containing three or more residential listings.

The sample was released for interviewing in replicates. Using replicates to control the release of sample to the field ensures that the complete call procedures are followed for the entire sample. The use of replicates also insures that the regional distribution of numbers called is appropriate. Again, this works to increase the representativeness of the sample.

At least five attempts were made to complete an interview at every sampled telephone number. The calls were staggered over times of day and days of the week to maximize the chances of making a contact with a potential respondent. All interview breakoffs and refusals were re-contacted at least once in order to attempt to convert them to completed interviews. In each contacted household, interviewers asked to speak with the “youngest male 18 or older who is at home.” If there is no eligible man at home, interviewers asked to speak with “the oldest woman 18 or older who lives in the household.” This systematic respondent selection technique has been shown empirically to produce samples that closely mirror the population in terms of age and gender.

Non-response in telephone interview surveys produces some known biases in survey-derived estimates because participation tends to vary for different subgroups of the population, and these subgroups are likely to vary also on questions of substantive interest. In order to compensate for these known biases, the sample data are weighted in analysis.

The demographic weighting parameters are derived from a special analysis of the most recently available Census Bureau’s Current Population Survey (March 1996). This analysis produced population parameters for the demographic characteristics of households with adults 18 or older, which are then compared with the sample characteristics to construct sample weights. The analysis only included households in the continental United States that contain a telephone.

The weights are derived using an iterative technique that simultaneously balances the distributions of all weighting parameters.