Americans Only a Little Better Off, But Much Less Anxious
What Budget Agreement?
About Pew Research Center
Pew Research Center is a nonpartisan, nonadvocacy fact tank that informs the public about the issues, attitudes and trends shaping the world. It does not take policy positions. The Center conducts public opinion polling, demographic research, computational social science research and other data-driven research. It studies politics and policy; news habits and media; the internet and technology; religion; race and ethnicity; international affairs; social, demographic and economic trends; science; research methodology and data science; and immigration and migration. Pew Research Center is a subsidiary of The Pew Charitable Trusts, its primary funder.
Americans Only a Little Better Off, But Much Less Anxious
What Budget Agreement?
Introduction and Summary
Psychologically, Americans have turned an important corner recently. They have become much less concerned about meeting major financial commitments, even though they say their material conditions have not dramatically improved. Heightened worries about affording health care, saving for retirement, or saving for a child’s college education have fallen off significantly in recent months. Yet satisfaction with wages and general financial well being are assessed only slightly better than a few years ago when economic anxiety was greater.
Until recently, the public has been unable to shake off the effects of the last recession, which in its mind lingered on long after economists declared it over. The steady drumbeat of reports of extensive corporate downsizing, compounded by worries that Washington reforms would increase health care costs or cut back Medicare, further fueled public concerns. Slowly, if not almost grudgingly, Americans acknowledged that their personal financial picture had improved. But at the same time they remained very worried about meeting major financial obligations.
Only now have anxieties about the future begun to diminish. The Pew Research Center’s latest nationwide survey finds Americans continuing to give their financial situations a mixed rating. Half the public (50%) says it is in excellent or good shape and as many (49%) see their situation as only fair or poor. This represents a small but significant increase from spring 1994 when the balance of evaluations were negative (46% to 53%). It is a much improved reading over January 1993 when negative ratings far outweighed positive ones (37% to 62%).
And with favorable news about low unemployment and low inflation taking the place of downsizing stories, Americans appear less frightened about their future. The current survey finds 20% point declines in the number of people “very concerned” on a variety of financial measures. It is important to underscore, however, that very large percentages of Americans continue to be at least somewhat concerned about such things as saving for retirement, health care costs and other major expenditures.
Furthermore, positive economic expectations may be easily reversible. While the percentage expecting to be better off next year is as high as it has been in the past five years (68%), only 12% expect a much improved situation. Similarly, a recent Gallup poll found mixed economic expectations — just as many respondents had positive economic attitudes as negative ones.1
The Pew Research Center survey also found little increased satisfaction with wages. A 54% majority of Americans continue to say they are not paid enough to lead the kind of life to which they aspire. As many as one in five workers (18%) have given up hope of ever earning an adequate salary.
Other Important Findings and Analyses
Budget Agreement
Clearly, Bill Clinton’s continued high ratings, despite Whitewater and the DNC fund raising scandal, seem more tied to a reduction in economic anxiety than to success with the budget. News interest in the budget debate once again edged down at the very time the President and Republican leaders had come to their historic agreement. In fact, only half of those questioned were aware that a tentative deal had been reached.
On balance, those who have heard about the agreement approve of it, though significant proportions disapprove or are undecided. Forty-seven percent of those who were aware that a deal had been reached approve of the agreement, but 28% disapprove and 25% are unsure. Approval is greater among high income Americans, who are most likely to benefit from cuts in capital gains and estate taxes. Sixty-two percent of those earning over $75,000 a year approve of the deal vs. 40% of those making under $30,000. Democrats are more supportive of the agreement than Republicans. Some 56% of Democrats who had heard about the agreement expressed approval vs. 46% of Republicans and 42% of Independents.
Americans who have been following the budget debate very closely were more likely to know an agreement had been reached. However, they were no more likely to approve of the deal than those who had been paying less attention.
It Won’t Happen — 85%
The public is cynical about the budget actually being balanced by the year 2002. An astounding 85% doubt balance will be achieved. Those who have been following the budget debate very closely are no more optimistic about the prospects for a balanced budget than those paying less attention.
Assuming the budget is balanced over the next five years, Americans remain skeptical that a balanced budget will help them personally. Only 32% say a balanced budget will help them financially, down somewhat from 40% in January 1996. Fourteen percent say they will likely be hurt. A plurality (47%) say a balanced budget will have no real impact on their family finances. Higher income Americans are significantly more likely than those with lower incomes to say a balanced budget will help them financially. Four in ten of those earning over $50,000 a year are optimistic about their own prospects under a balanced budget, compared to only 26% of those earning less than $30,000.
The new spirit of bipartisanship in Washington is getting mostly positive reviews from the public. By and large, Democrats and Republicans think their respective parties have not compromised too much in their efforts to reach legislative agreements with the opposition. About one third (35%) of Republicans and those who lean Republican say the GOP has compromised too much recently on it goals of reducing the size of government and cutting taxes, but a majority (54%) disagrees. The findings are nearly identical among Democrats and those who lean Democratic: 33% say their party has compromised too much on its goals of helping needy people and using government to solve important domestic problems; 57% do not agree.
GOP Grassroots Angst
Among Republicans and Republican leaners, men more than women say the party has given up too much ground (42% vs. 28%). Party regulars are slightly more likely to take this view than Independent leaners, though the differences are not dramatic (37% vs. 31%). Those Republicans paying very close attention to the budget debate are less enthusiastic about their party’s conciliatory stance; 48% say the GOP has compromised too much, suggesting that bipartisanship may not play well with Republican activists at the grassroots level.
In contrast, attentive Democratic party regulars are much more positive about their leaders’ recent compromises. Fully two- thirds (68%) say their party has not compromised too much on its traditional goals, despite criticism by some inside the party that Clinton sacrificed traditional Democratic values in the recent budget deal and last summer’s welfare reform bill.
But the budget agreement between the White House and Congressional leaders has had no immediate impact on public approval ratings for President Clinton or GOP leaders in Congress. Clinton’s approval rating (57%) is largely unchanged since last month. Ratings for the Republican leaders (40% approve) have also remained steady in recent months.
A Smaller Deficit?
The public is largely unaware of the progress made in recent years toward reducing the federal budget deficit. Only 29% believe significant progress has been made toward this goal in recent years. More Democrats than Republicans are aware of progress (40% vs. 23%).
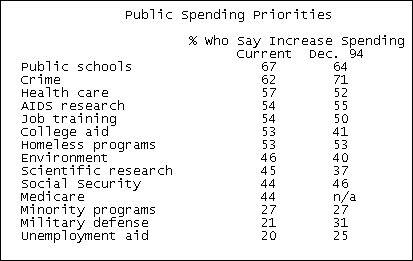
In spite of the perception that the deficit has not shrunk in recent years, the public remains committed to a full menu of spending priorities. Americans are no more willing to see cuts in major entitlement programs today than they were two years ago. Overwhelming majorities say if they were making up the federal budget this year, they would increase or maintain spending levels for Social Security and Medicare (90% and 88%, respectively).
The public now would commit more funds to higher education, scientific research and environmental protection than in December 1994. Support for increased spending on crime and unemployment assistance has fallen in recent years, but the biggest change in this regard is on military spending. Today, more Americans say military spending should be decreased rather than increased: 30% vs. 21%, a reversal of opinion from December 1994.
Tiger, Dennis and Ellen Best Known
Americans this month showed once again that they follow sports stars and entertainers far more closely than the power people.
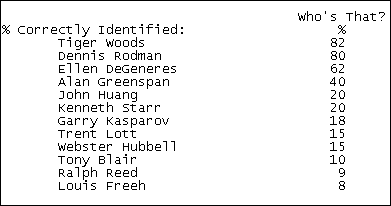
Tiger Woods, the young golfing phenom, was correctly identified by fully eight out of ten Americans (82%) as was Dennis Rodman, the Chicago Bulls bad boy of basketball (80%). Ellen DeGeneres, the comic who came out as a lesbian on prime time television, was known to 62%. Tony Blair, the newly elected Labor prime minister of Britain who ended two decades of Tory rule, was known to merely one in ten (10%).
Alan Greenspan, chairman of the Federal Reserve Board and arguably one of America’s most influential persons, was known to 40%, but FBI director Louis Freeh was recognized by only 8% of the public. Gary Kasparov, the Russian world chess champion who recently lost to the IBM computer, was correctly identified by 18%, twice as many as Ralph Reed, key organizer of the politically powerful Christian Coalition (9%). Trent Lott, Senate Republican Leader, was known to 15%.
Individuals associated with alleged scandals were not much more recognizable. John Huang, central to the dubious fund raising in Asia of the Democratic Party, was correctly identified by two in ten Americans (20%). Kenneth Starr, who is leading the investigation into the Whitewater real estate affairs of President and Mrs. Clinton, was similarly known to 20%, and Webster Hubbell, a Clinton friend and former associate considered a key potential witness in Whitewater, by 15%.
Men recognized Woods and Rodman somewhat more often than did women (by 12 and 10 percentage points, respectively), which is not surprising for male sports stars. But DeGeneres was correctly identified significantly more often by women than men (67% vs. 56%).
Greenspan was known far more often to men (50% vs. 30% of women) and older Americans (54% of those 50 years old and older, vs. 18% of adults under 30), the better educated and wealthier, and Republicans more than Democrats.
News Interest Doldrums Continue
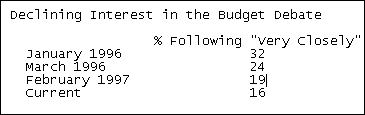
The public’s interest in serious news events was also low this month except for the trial of Oklahoma City bombing suspect Timothy McVeigh; 30% of Americans said they followed those proceedings very closely, up from 20% one month earlier. The debate in Congress over late-term abortions was followed very closely by 21%, the same proportion as six months earlier, with women more interested than men. But the debate in Washington about the federal budget attracted only 16% of the public, half the level of January 1996.
Charges of improper campaign contributions to Democrats from foreign businessmen was followed very closely by 18% of Americans, essentially unchanged since the story broke late last year. The same proportion followed the sexual harassment charges against Army sergeants. Both were apparently more interesting than the ongoing Whitewater investigation, a story that was followed very closely by only 13%, unchanged for almost two years.
Least interest was shown in the Kasparov-computer chess match (7%), the British elections (5%), and the brutal civil war in Zaire (4% followed very closely).
Majorities Opposed to Late-Term Abortions
Most Americans (54%) would favor laws banning “partial birth” abortions, and a similar percentage (58%) would favor banning all abortions after fetal viability, with exceptions to save the mother’s life or health. A fairly large minority, however, are opposed to such bans (37% and 29%, respectively). Men and women are nearly indistinguishable in their opinions on both legislative proposals.
Support for the partial birth abortion ban unites Americans of all party affiliations. Identical majorities of Republicans, Democrats and Independents say they would support the ban (55%, 54% and 56%, respectively), along with majorities in every age group. Catholics and evangelical Protestants show higher levels of support than mainstream Protestants (57%, 59% and 48% respectively). Those Americans who say they have been paying very close attention to the debate in Congress on late- term abortions are slightly more supportive of the partial birth ban than the general public (66% vs. 54%).
Opinion on a full ban on abortions of viable fetuses (with life and health exceptions) follows more traditional partisan patterns. Sixty-five percent of Republicans favor such legislation, compared to 53% of Democrats and 57% of Independents. Evangelical Protestants are more likely than other major religious groups to support the ban (71%, vs. 60% of Catholics and 50% of mainline Protestants).
Americans are willing to offer opinions on these controversial and highly-debated abortion procedures, but many admit to uncertainty about their own convictions on the issue. Approximately three in ten supporters of the bans say they sometimes wonder whether their position is the right one. Similar percentages of opponents say they sometimes question their position.
Whitewater
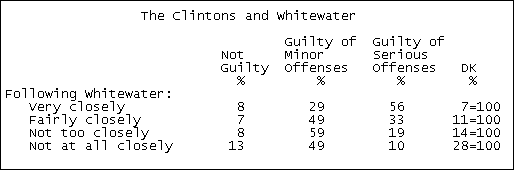
Three years into the Whitewater investigation, the public remains unconvinced that the Clintons are guilty of serious offenses. A plurality of Americans (49%) think the Clintons are guilty, but of minor offenses only. One in four (26%) say the Clintons are guilty of serious offenses. Only one in ten (9%) believe they are not guilty of any wrongdoing. The public is more convinced that the Clinton administration is knowingly covering up information about Whitewater. Two-thirds (65%) think there has been a cover-up. Even among Clinton supporters, 50% share this view.
Not surprisingly, Republicans are much more suspicious of the Clintons than are Democrats. Fully 47% believe they are guilty of serious offenses, compared to 9% of Democrats and 26% of Independents.
Among those who have followed news stories about Whitewater very closely, a majority (56%) think the Clintons are guilty of serious infractions. But only a small fraction of the public (13%) is paying such close attention. Another indication of the public’s lack of interest is that only 20% of the respondents in this poll could identify Kenneth Starr as the Whitewater independent counsel, and even fewer (15%) knew Webster Hubbell is a key potential witness and Clinton friend.
Nonetheless, four in ten (43%) Americans believe the media is giving too much attention to Whitewater; 39% say it is about the right amount. Very few (14%) say too little attention is being paid to Whitewater.
Reno Wrong
Most Americans believe Attorney General Janet Reno should have appointed an independent counsel to investigate campaign fundraising abuses in last year’s presidential campaign. Only 28% approve of her decision not to do so. Republicans feel much more strongly about this issue, but even 45% of Democrats say Reno should have taken the step. Public attentiveness to this ongoing story has remained flat over the last month. Fewer than one in five (18%) followed the story very closely, 33% followed it fairly closely. Fully half are paying little or no attention to the unfolding scandal.
Mixed Feelings About Justice and Law Enforcement
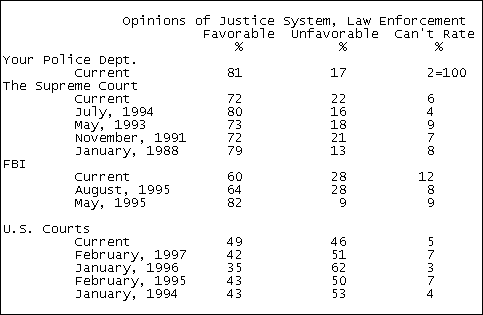
Public attitudes toward law enforcement institutions are mixed. The public is split about the courts generally, but more positive about the Supreme Court. Most Americans have a favorable opinion of the FBI, but a sizeable minority do not. Closer to home, local police departments receive generally positive reviews. But except for police, opinion is not enthusiastically favorable, with relatively low levels of “very favorable” ratings.
Almost half of Americans (49%) have a favorable view of the U.S. Court system, but nearly as many (46%) have an unfavorable opinion. This represents a small improvement since February, when 42% were favorable, and a substantial improvement over January 1996 (35% favorable). The current division in opinion is found equally among men and women, whites and nonwhites, young and old.
The most common reason offered for unfavorable views of the courts is that the system is too lenient on criminals (32%). The public is also concerned that justice is not always served (14%), and that the rich receive different (and better) treatment (12%). Five percent of the public specifically mentioned the O.J. Simpson trial when asked why they had an unfavorable opinion of the court system. Those with favorable opinions of the system said the courts are doing a good job (31%), the system is working well (14%), and is fair and even-handed (12%).
Unlike the Court system as a whole, the Supreme Court is viewed favorably by a large majority of the public. Fully 72% have a favorable opinion of the nation’s highest tribunal (16% “very favorable”). These results are very similar to surveys conducted in 1991 and 1993, though slightly below ratings in 1994. Republicans more often hold negative views of the court system in general and of the Supreme Court than do Democrats.
Opinion of FBI Unchanged
Ratings of the Federal Bureau of Investigation have not rebounded since August 1995, when they fell following Congressional hearings on the Branch Davidian siege at Waco, Texas. Currently, six in ten Americans have a favorable view of the agency (12% “very favorable”), 28% have an unfavorable view. Those over 50 years old are somewhat less likely to be favorable than younger persons (52%, vs. 63% of those 30 – 49, and 65% of those 18 – 29). Americans who live in Western states have slightly more negative views than those in other parts of the country (37% unfavorable, vs. 28% in the South, 27% in the East, and 26% in the Midwest).
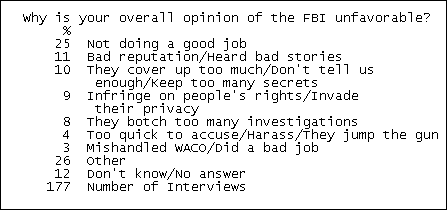
Of the 28% who express unfavorable opinions about the FBI, one in four say the agency is not doing a good job, while 11% say the agency has a bad reputation. Ten percent feel the FBI keeps too many secrets. Only 3% specifically mentioned Waco (a comparable proportion cited this as a reason for holding positive views of the FBI).
Opinion on the CIA is divided: 39% have a favorable view of the agency, and 33% an unfavorable view.
Local Police Liked
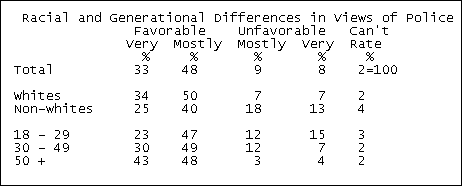
Fully 81% of respondents said they have a favorable opinion of the police department in their area, including 33% with a very favorable opinion. Whites are substantially more likely to feel favorably than are nonwhites, while those under age 30 are significantly more likely to be negative than middle aged and older Americans.
Favorable views of local police departments stem from the belief that the police are doing as good a job as they can (57%), that crime is low (11%), and that police are visible (10%) and quick to respond (10%). Negative views of the police are based on similar criteria but different judgments. Twenty-one percent of those with unfavorable opinions say that police are not visible, 17% say they go after the wrong people, and one in ten say they overstep their authority. Other criticisms mentioned include corruption, poor training, and racism (all 7%).
In the fight against crime, two-thirds of the public (66%) favor laws that would try more juvenile offenders as adults. Whites are slightly more likely to give this response than nonwhites (67% vs. 60%). Those under 30 are little different from older generations in this regard.
Softening of Support for the Military
Overall favorability (80%) for the military is about the same as a year ago (82%), but fewer Americans give the military the highest rating (23% “very favorable” now vs. 33% in February 1996). This is the second indicator (the first being rising sentiment for less military spending) which shows weakening support for the Pentagon. The swirl of stories about sexual harassment on Army bases may be affecting opinion toward the military, but Americans who say they are following these stories very closely are not more negative than the rest of the public. Men are slightly more favorable to the military (83% vs. 77% of women), and those over 30 more than those under 30 (82% of those over age 30, compared to 71% of those under).
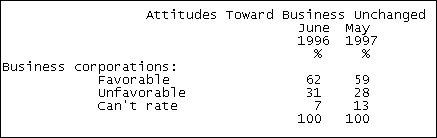
Despite low unemployment and a bull market, Wall Street investors and business corporations are viewed no more favorably than last year. Overall, 59% of the public has a favorable view of business corporations (only 9% of which is “very favorable”). Affluent Americans are more favorable to business than those with less education and lower incomes: 72% of those with incomes over $75,000 a year have a favorable opinion, vs. 49% earning less than $20,000. Majorities in both political parties have a positive view of business, but Republicans are more positive than Democrats or Independents (69% vs. 58% and 51%, respectively). Wall Street investors fare a bit worse: 48% of Americans give investors a favorable review, vs. 26% unfavorable.
Overall, labor unions receive lower favorability ratings than does business (49% favorable vs. 59%). A significant plurality of 39% have an unfavorable view of organized labor. As expected, Democrats and those who lean Democratic are much more favorable than Republicans and those who lean Republican (61% vs. 39%).
Methodology
Results for the survey are based on telephone interviews conducted under the direction of Princeton Survey Research Associates among a nationwide sample of 1,228 adults, 18 years of age or older, during the period May 15-18,1997. For results based on the total sample, one can say with 95% confidence that the error attributable to sampling and other random effects is plus or minus 3 percentage points. For results based on either Form 1 (N=615) or Form 2 (N=613), the sampling error is plus or minus 4.5 percentage points.
In addition to sampling error, one should bear in mind that question wording and practical difficulties in conducting surveys can introduce error or bias into the findings of opinion polls.
Survey Methodology in Detail
The samples for each survey are random digit samples of telephone numbers selected from telephone exchanges in the continental United States. The random digit aspect of the sample is used to avoid “listing” bias and provides representation of both listed and unlisted numbers (including not-yet-listed). The design of the sample ensures this representation by random generation of the last two digits of telephone numbers selected on the basis of their area code, telephone exchange, and bank number.
The telephone exchanges were selected with probabilities proportional to their size. The first eight digits of the sampled telephone numbers (area code, telephone exchange, bank number) were selected to be proportionally stratified by county and by telephone exchange within county. That is, the number of telephone numbers randomly sampled from within a given county is proportional to that county’s share of telephone households in the U.S. Estimates of the number of telephone households within each county are derived from 1990 Census data on residential telephone incidence that have been updated with state-level information on new telephone installations and county-level projections of the number of households. Only working banks of telephone numbers are selected. A working bank is defined as 100 contiguous telephone numbers containing three or more residential listings.
The sample was released for interviewing in replicates. Using replicates to control the release of sample to the field ensures that the complete call procedures are followed for the entire sample.
At least four attempts were made to complete an interview at every sampled telephone number. The calls were staggered over times of day and days of the week to maximize the chances of making a contact with a potential respondent. All interview breakoffs and refusals were re-contacted at least once in order to attempt to convert them to completed interviews. In each contacted household, interviewers asked to speak with the “youngest male 18 or older who is at home”. If there is no eligible man at home, interviewers asked to speak with “the oldest woman 18 or older who lives in the household”. This systematic respondent selection technique has been shown empirically to produce samples that closely mirror the population in terms of age and gender.
Non-response in telephone interview surveys produces some known biases in survey-derived estimates because participation tends to vary for different subgroups of the population, and these subgroups are likely to vary also on questions of substantive interest. In order to compensate for these known biases, the sample data are weighted in analysis.
The demographic weighting parameters are derived from a special analysis of the most recently available Census Bureau’s Current Population Survey (March 1994). This analysis produced population parameters for the demographic characteristics of households with adults 18 or older, which are then compared with the sample characteristics to construct sample weights. The analysis only included households in the continental United States that contain a telephone.
The weights are derived using an iterative technique that simultaneously balances the distributions of all weighting parameters.