Measuring the Risks of Panel Conditioning in Survey Research
Conditioning does not contribute significant error to panel estimates
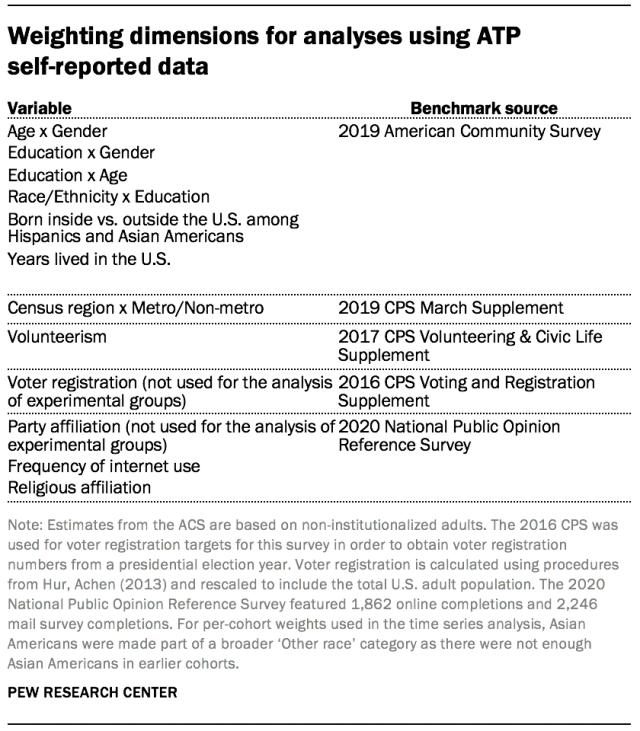
Pew Research Center conducted a series of analyses exploring data quality in its U.S. surveys, specifically those conducted on the Center’s online survey platform, the American Trends Panel (ATP). The goal was to determine whether participation in the panel changed respondents’ true or reported behavior over time (either immediately or over a longer period), a phenomenon referred to as panel conditioning. Because panel conditioning can be difficult to isolate from other differences (e.g., true change over time, reliability), analyses to detect conditioning were conducted in three different ways. First, an experiment was conducted in 2019-2020 in which some panelists were asked to complete several more surveys than others to determine if repeated exposure introduced conditioning. Second, estimates from newly recruited cohorts were compared with estimates from existing panelists at different points in time to determine if the existing panelists had different behaviors due to conditioning. Third, researchers appended administrative data on voting behavior pre- and post-empanelment to determine whether individuals changed their voting behavior over time, a sign of conditioning. All analyses were conducted using specially designed weights to control for panel attrition over time, cohort-level differences and variations in sampling procedures.
As public opinion polling increasingly moves toward the use of online panels, one threat that pollsters face is the possibility that their data could be damaged by interviewing the same set of people over and over again. The concern is that repetitive interviewing may introduce panel conditioning, a state in which panelists change their beliefs or behavior just by being exposed to and answering a variety of questions over time.
Panel conditioning can have a harmful effect on data quality if respondents change their original attitudes and behaviors because of the survey stimulus. For example, an individual respondent may not have heard of House Speaker Nancy Pelosi, her role, party affiliation or voting record. They would not be alone, as 41% of U.S. adults could not name the speaker of the House, and more than 10% reported never having heard her name. Panel conditioning would occur if the mere act of asking panelists about political leaders (e.g., “Do you approve or disapprove of the way Nancy Pelosi is handling her job as speaker of the House?”) causes panelists to seek out more information about them, form new opinions, or become more politically engaged than they would otherwise have been had they not joined the panel.
Alternatively, panel conditioning can have a beneficial effect on data quality when participation elicits more accurate reporting over time. Panelists may become more reflective of their own behaviors and attitudes and be able to more accurately report them. As the researcher and respondent build rapport, panelists may also become more willing to report their true behaviors and attitudes.
A new study explored potential risks and benefits from repeated interviewing of participants in Pew Research Center’s American Trends Panel (ATP). Among the key findings:
There was no evidence that conditioning has biased ATP estimates for news consumption, discussing politics, political partisanship or voting, though empanelment led to a slight uptick in voter registration. Multiple analyses conducted on variables deemed most susceptible to panel conditioning by Center staff failed to identify any change in respondents’ media consumption and dialogue behaviors, party identification, or voting record. However, empanelment did have a small effect on voter registration. Analysis of differences between ATP cohorts suggested that panelists were slightly more likely to register to vote soon after joining the ATP.
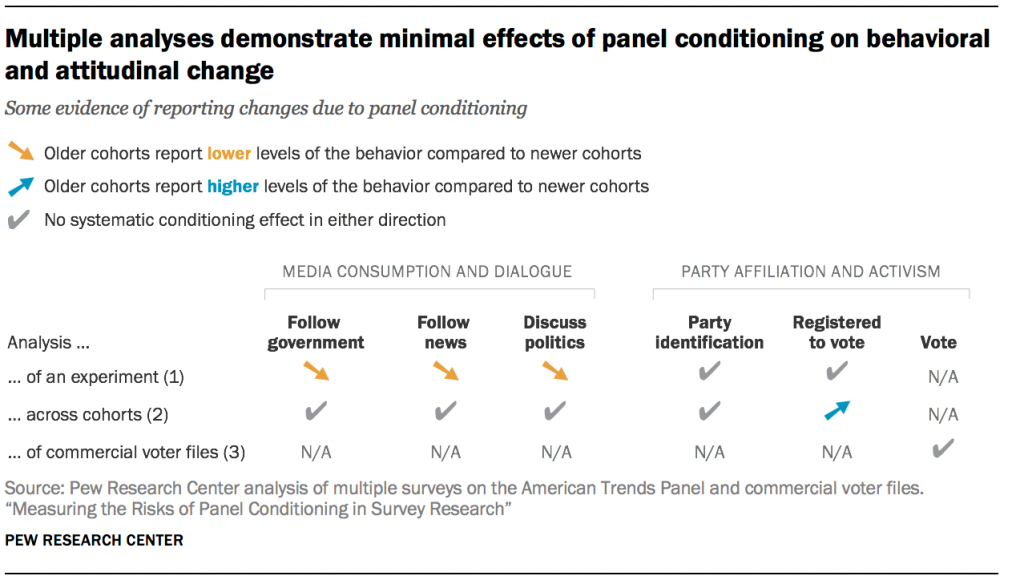
There is some evidence that panelists may change their reporting post-recruitment, likely improving data quality. On average, empaneled members reported less media consumption and dialogue in three out of six analyses. Evidence was mixed on whether these changes occurred gradually or soon after empanelment. While lower reports of consumption and dialogue may indicate higher misreporting when some response choices prompt several follow-up questions, the ATP rarely includes this type of design. Lower reports are likely, but not conclusively, an indicator of more accurate reporting and higher data quality over time.
Conditioning effects are difficult to isolate from true change over time, differences in panel cohorts, panel attrition and changes in measurements due to methodological enhancements. To ensure that all findings were replicable and robust, researchers began by selecting the six variables hypothesized to be most susceptible to conditioning – three media consumption and dialogue variables and three political affiliation and activism variables. Researchers then conducted three different types of analyses on the chosen variables. These included:
1. A randomized experiment executed around the 2020 election in which some panelists were asked questions susceptible to conditioning less often and some more often over time.
2. A comparison of newer cohorts (who have been asked these items less frequently as an effect of joining the panel more recently) and older cohorts across a five-year time frame.
3. A comparison of voter turnout records pre- and post-empanelment.
For this analysis, increasing trends over time among those empaneled (all else being equal) were interpreted as signs of a harmful and less accurate conditioning effect. This would include becoming more likely to follow government affairs, follow the news, discuss current events and politics, register to vote, identify as a member of a primary political party or vote as time since joining the panel increases. This assumption is founded in the theory that respondents’ awareness is raised and their interest is piqued when asked about a subject, increasing the frequency of these behaviors.
Decreasing frequencies may be the result of harmful or helpful effects of conditioning. Respondents may try to “game” the survey, answering in a manner that they believe will yield fewer follow-up questions and make the survey shorter. This can harm data quality. However, “gaming” is unlikely on the ATP since the length of the survey is rarely correlated with the response to a given question. Instead, decreasing frequencies are likely an indicator of improved data quality. These interpretations are consistent with the theory of social desirability bias, the idea that respondents wish to be seen favorably by researchers so they generally overreport good behaviors (e.g., voting). Only after building rapport and trust with the researcher are they more likely to report honestly and accurately.
Given the consistency of the results across all three sets of analyses and the fact that the variables used in the analyses were considered the most likely offenders, current methods appear to be sufficient to stave off large-scale harmful effects of panel conditioning and may improve data quality over time.
There’s potential for panel conditioning on the ATP
Pew Research Center collects over 15 million data points every year from over 13,000 American Trends Panel (ATP) panelists. The ATP is comprised of individuals who have been recruited to take about two surveys per month. Between its inception in 2014 and October 2020, 74 surveys were conducted using the ATP. Over the years, the Center has recruited individuals to the panel a total of six times (about once per year) to replace individuals who have opted out and to grow the size of the panel. This means that the 2,188 individuals who were recruited in 2014 and were still active panelists as of October 2020 could have participated in all 74 surveys, whereas the newest (2020) cohort of 1,277 active panelists had only had the opportunity to answer three surveys since they were recruited much more recently.
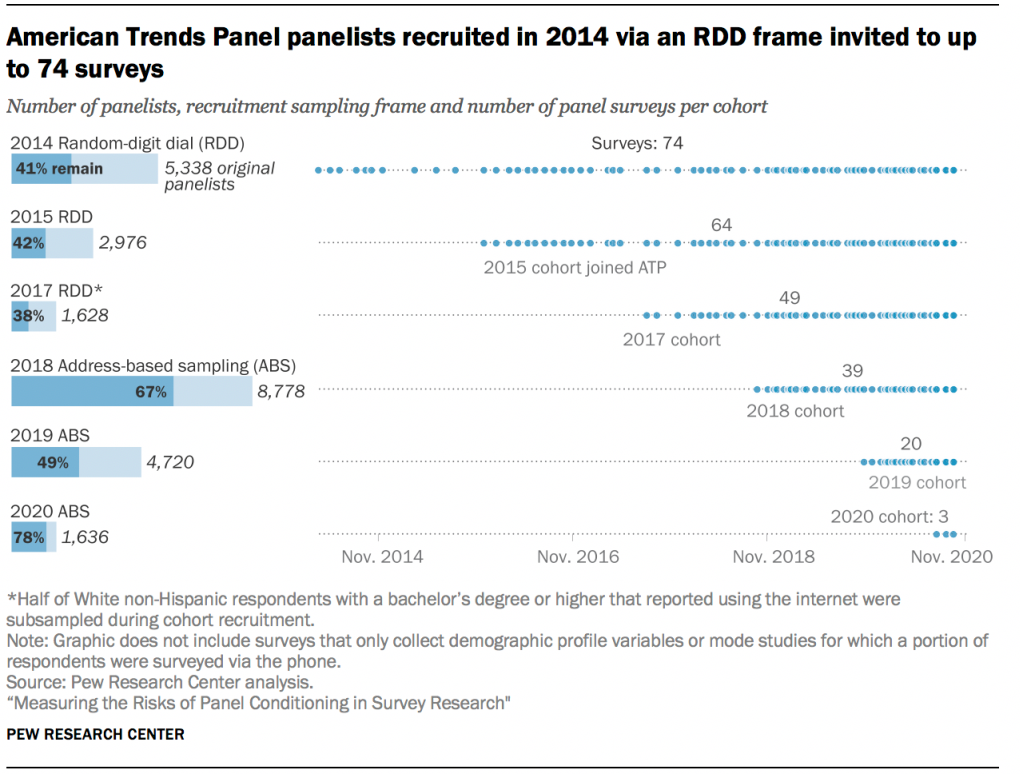
However, not every survey is created equal. All panelists are not invited to all surveys, as some surveys only require a subsample. Some panelists, even if invited, opt not to participate in a given survey. While this means that it’s unlikely that any panelist actually participated in all 74 surveys, individuals who have been empaneled the longest have still been exposed to numerous surveys and questions. Panelists recruited in 2014 have taken an average of 58 surveys as of October 2020.
Some questions and topics are more susceptible to panel conditioning than others. For example, a survey about religious beliefs is unlikely to change someone’s perception of God. These attitudes and beliefs are likely well-entrenched and less susceptible to change over time. However, these types of questions may also be prone to beneficial effects of panel conditioning. A respondent may not feel comfortable disclosing his/her religious identity to a relatively unknown actor. Over time, trust is developed, and a more honest report of religious identify may follow.
Regardless of the exact number of surveys or questions prone to conditioning, three things are evident. First, if panelists’ attitudes and behaviors are changed after just one survey on a given topic, then even the newest (2020) cohort will be altered after just a few surveys. This is referred to as “immediate” harmful conditioning. Second, if conditioning effects are ongoing or only become more likely after being asked similar content repeatedly over time, then the oldest (2014) cohort would elicit the most biased responses while our newest (2020) cohort may still be representative of the population (all else being equal). This is referred to as “gradual” harmful conditioning. Third, the reverse may be true. Respondents may change their reporting immediately or gradually as they become more experienced panelists. Panel familiarity may improve data quality as respondents are more willing to report accurately. This is considered a helpful effect.
Despite the risk of conditioning (harmful or helpful), other researchers have found little, if any, cause for concern for multi-topic panels (i.e., the topic varies from survey to survey). For example, research into the Ipsos Knowledge Panel has failed to find systematic conditioning effects on measures ranging from political activism to media consumption to internet usage, and minimal differences have been identified between more- and less-tenured AmeriSpeak panelists. This study is the first effort Pew Research Center has made to explore this topic in its panel. Our results broadly comport with these prior studies.
An experiment on the risks of panel conditioning during a presidential election
One way to test for conditioning bias is using a randomized experiment. Researchers assign a random subset of panelists to receive certain survey content, while other panel members do not receive that content. Done properly, this can isolate the effect of conditioning on panelists.
In November 2019, the Center administered a survey about news and media consumption to all ATP panelists. After the survey, respondents were divided into two random groups. One group of 1,000 individuals was not asked any more questions about news and media for 11 months while the second group of 10,855 panelists was invited to participate in six more surveys about news and media over the same time period. Then, both groups, along with a brand new cohort (2020), were invited to participate in an August 2020 survey about news and media, including some of the same questions from November 2019.
If panel conditioning occurs immediately after a participant’s first survey (for better or worse), existing panelists in the group receiving similar questions infrequently should report different levels of engagement (i.e., media consumption and dialogue and voter registration) and major political party affiliation than the new recruits for whom the August 2020 survey was their first ATP survey. Higher engagement or affiliation would indicate harmful conditioning among existing panelists while lower engagement or affiliation would indicate changes in reporting habits, likely a beneficial effect of conditioning.
Additionally, if panel conditioning is a gradual process based on the number of times a type of question is asked, the 10,855 respondents who were repeatedly asked about their news and media consumption should be different than the 1,000 existing panelists who received these types of questions less frequently. If panel conditioning has harmful effects (i.e., changes behavior), panelists asked about these topics frequently are expected to report higher consumption and engagement levels. By contrast, if conditioning changes how respondents report their behaviors and attitudes (i.e., helpful effects), panelists asked about these topics frequently are expected to report lower (presumably more honest) levels.
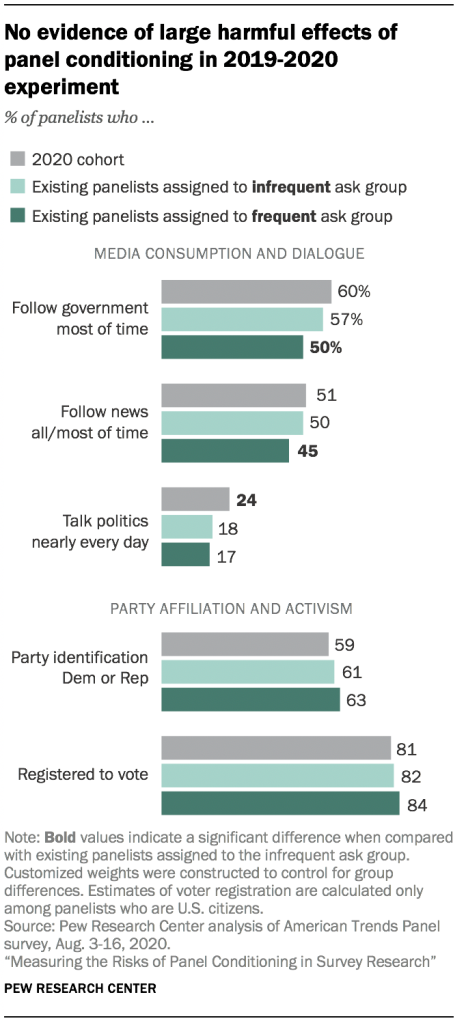
Overall, no evidence of harmful forms of conditioning was observed for any of the five variables analyzed. While the new cohort exhibited slightly lower estimates (compared with the infrequently surveyed existing panelists) in two of the five comparisons, the differences were small (2 percentage points or less) and not statistically significant. Similarly, none of the comparisons showed statistically higher estimates among the frequently surveyed existing panelists when compared with those less frequently surveyed.
Respondents who were asked more frequently about their media consumption and dialogue behaviors reported lowervalues than those asked less frequently. For example, 57% of panelists receiving fewer surveys reported following the government and current affairs “most of the time,” compared with just 50% among those who received the questions more frequently. A similar trend was observed when asked about following the news. For these variables, this change in reporting was gradual over time.
A more immediate shift was observed when respondents were asked how often they discuss politics. While no significant difference was observed between the two groups of existing panelists, there was a 6 percentage point difference between the new cohort and existing panelists assigned to the less frequent surveys group (24% vs. 18%, respectively).
While it is possible that the lower values are due to behavioral change, there is no strong theoretical reason that empanelment should reduce consumption. It may also be a harmful reporting change; panelists may be fatigued, may wish to shorten the survey, or be rushing through the survey. However, the most likely explanation is one of improved reporting. Respondents are more honest and willing to report less desirable behaviors after building trust and rapport with the Center.
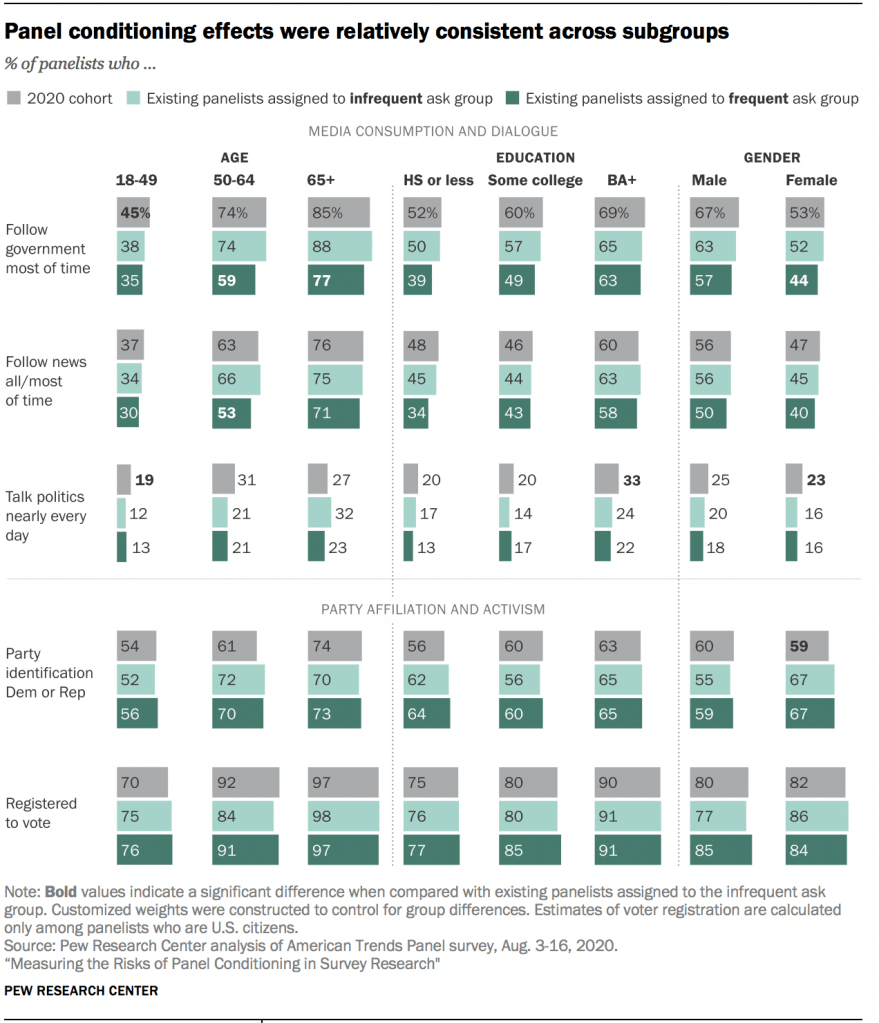
Because many factors affect the likelihood of conditioning, some individuals may be more susceptible to conditioning than others. To this end, comparisons were also made by age, education and gender.1 The subgroup analyses were generally consistent with the overall findings. However, not all subgroups behaved similarly. For example, 18- to 49-year-olds were statistically unaffected by empanelment when it came to reporting the frequency with which they follow the government and current affairs, whereas older individuals (both 50- to 64-year-olds and those 65 and older) exhibited a significant decline in frequency upon joining the panel. Given the different sample sizes among different subgroups, it was possible that a difference between groups appears significant for one comparison and does not reach significance for the other. Overall, similar patterns of change among the media and consumption variables were identified across groups.
Looking at the political affiliation and activism variables, there were slight harmful trends in the overall measures, but these differences failed to reach statistical significance. Similar trends were identified among most subgroups. Only women were subject to a significant, immediate shift in party identification. Specifically, the 2020 female recruits were less likely to identify with a major political party than existing panelists who were less frequently surveyed.
Testing for conditioning in newer vs. older cohorts over time
The Center often reports on how society has changed over time. In the absence of panel conditioning (and with proper weights and attrition adjustments), any observed change over time may be considered true change. However, if panel conditioning is present, it may bias the interpretation of the data. If the conditioning effect is in the same direction as the true change, i.e., people are becoming more engaged, then change would be magnified. If the direction of conditioning and true change are opposed, the true change would be underestimated.
To determine if panel conditioning was affecting analyses of change over time, data were collected following each ATP recruitment between 2014 and 2020. If conditioning were encouraging real change among panelists, older cohorts would be expected to report higher levels of media consumption and political activism than newer cohorts at a given point in time. If this change occurred soon after recruitment, the difference could be observed between the newest cohort and all other cohorts. In other words, the newest cohort at any given time point would look like a low outlier on a graph or figure. Additionally, if conditioning changes behavior gradually over time, newer cohorts would consistently consume less media and be less engaged than older cohorts. If graphing each cohort at a given point in time, gradual behavioral change would look like a set of stairs on a column chart or an ordered line on a dot plot.
Alternatively, if conditioning causes reporting changes, improving data quality, measurement would likely be reversed. Media consumption and political activism would appear highest for the newest cohort and lowest for the oldest cohort at a given point in time.
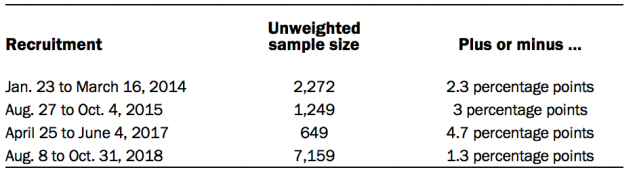
Measurements for each cohort were compared with each other at multiple time points to assess whether any type of conditioning was occurring. This yielded 20-35 comparisons per variable across six cohorts and 4-5 time points.2 The questions used in this analysis were the same as the analysis of the experiment. They included measures of frequency with which panelists follow the government, follow the news, and discuss politics as well as party identification and whether they are registered to vote.
Most variables exhibited patterns consistent with the absence of panel conditioning. For example, there was no evidence of panel conditioning affecting behavioral change in the frequency with which individuals follow the government and public affairs. If conditioning yielded behavioral change quickly, the newest cohort would produce the lowest frequency of consumption. The newest cohort was never the lowest estimate in any of the five time points. In fact, it produced the highest estimate in three of the time points (October 2015, February 2018 and August 2020). If conditioning was more gradual at creating behavioral change, the estimates should align in order of cohort for each time point (e.g., the 2020 cohort would have the lowest estimate in August 2020 followed by the 2019 cohort, 2018 cohort, 2017 cohort, 2015 cohort and 2014 cohort). This also did not happen. For example, in August 2020, 51% of the 2018 and 2019 cohorts reported following the government most of the time followed by the 2015 and 2017 cohorts at 54%, the 2014 cohort at 55% and the 2020 cohort at 60%.
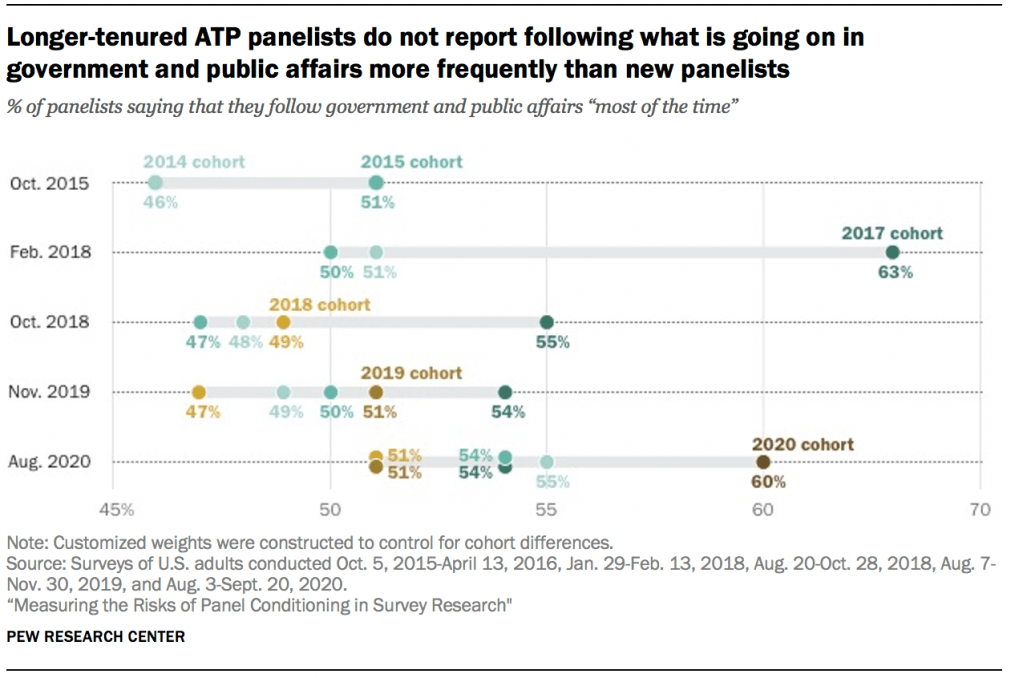
Not only did the cohorts fail to fall into an order indicative of harmful conditioning, most of the differences among cohorts at a given time point also failed to reach significance. Twenty-nine of the 35 comparisons conducted to measure the frequency of following the government failed to reach significance. Of the remaining, all but two suggested the older cohort was following the government less often than the newer cohort. While this could indicate a change (and improvement) in reporting behavior over time, the lack of a consistent trend suggests it is more likely true differences among cohorts that could not be accounted for with weights.
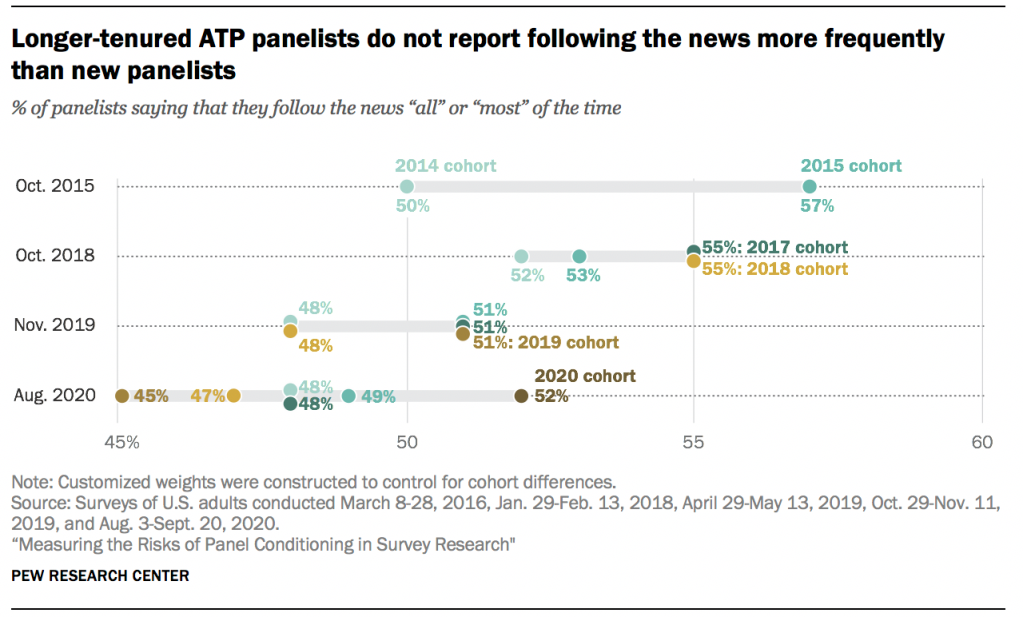
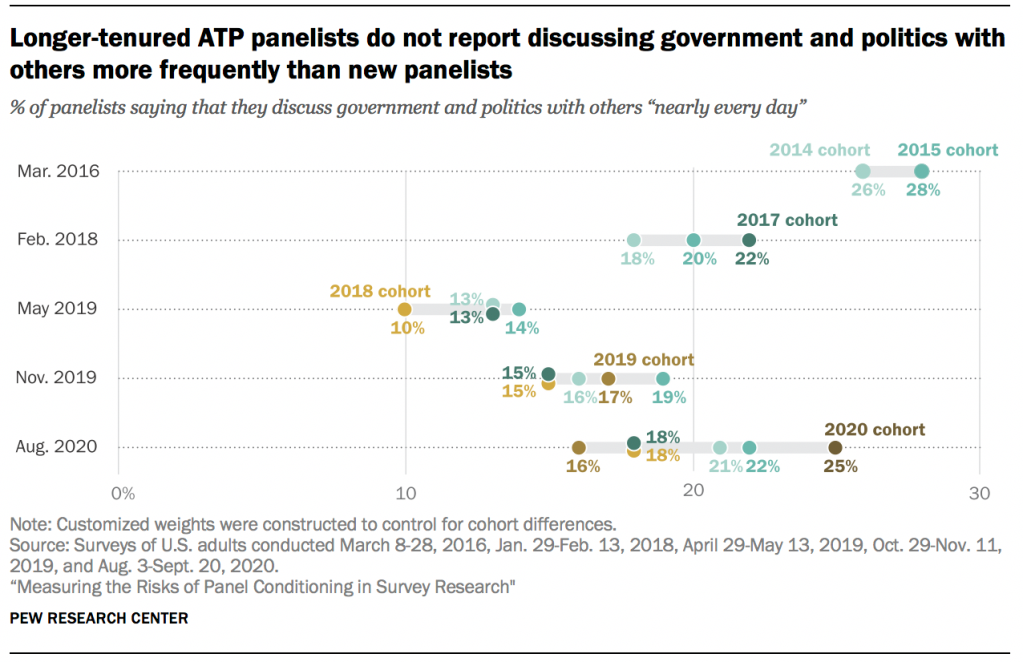
Other consumption and dialogue variables – frequency of following the news and discussing politics – were relatively similar to the measure of following the government. The newest cohort for a given time point never produced the lowest estimate of following the news all or most of the time. While the 2018 cohort did yield the lowest estimate of discussing politics nearly every day in May 2019, it was not statistically different from the 2017 cohort at the same point in time, and other new cohorts did not produce similar patterns. Also consistent with the lack of harmful effects was the lack of ordered estimates for any point in time and the failure of most comparisons (29 of 32 and 26 of 35 for following the news and discussing politics, respectively) to achieve statistical significance. Of those comparisons that did produce statistically significant differences, most were small and half were in the direction that suggests reporting improvements. While any change may yield slightly moderated or exaggerated results (depending on the direction of the change) in analyses of change over time, these changes are small. Luckily, for estimates that the Center publishes using the ATP, these effects are further mitigated when all of the cohorts are used.
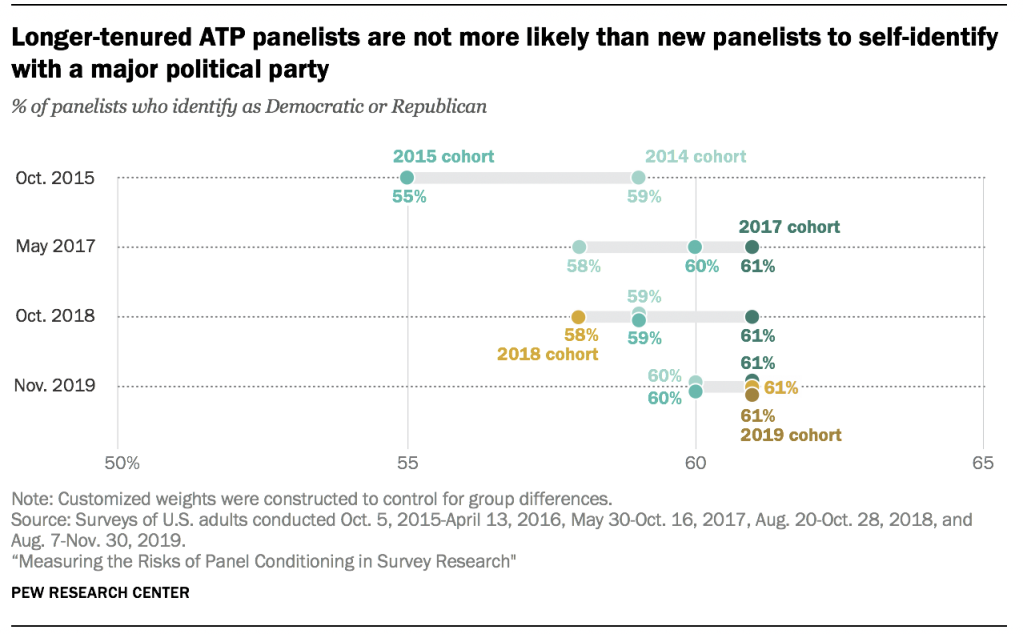
Party identification was the least susceptible to any type of conditioning (harmful or helpful) among the variables investigated. Of the 20 comparisons made among cohorts at four different points in time, none reached statistical significance.
In this set of analyses, empanelment appeared to be changing individuals’ behavior in one way – it encouraged individuals to register to vote. The newest cohort consistently reported lower rates of voter registration compared with other cohorts at the same point in time. For example, in October 2018, the registration rate was 76% among panelists recruited that year, compared with 79% among the panelists recruited in 2015 and 2017 and 82% among 2014 recruits.3 The panel may act as a reminder or nudge for panelists to register, causing an uptick in registration soon after empanelment. These effects are small (4-7 percentage points), and not all comparisons among the newest and older cohorts reached statistical significance. Moreover, the conditioning effects are muted when cohorts are combined to create overall estimates. Despite these mitigating factors, the consistency in pattern across all points in time for all cohorts suggests some presence of conditioning changing behavior.
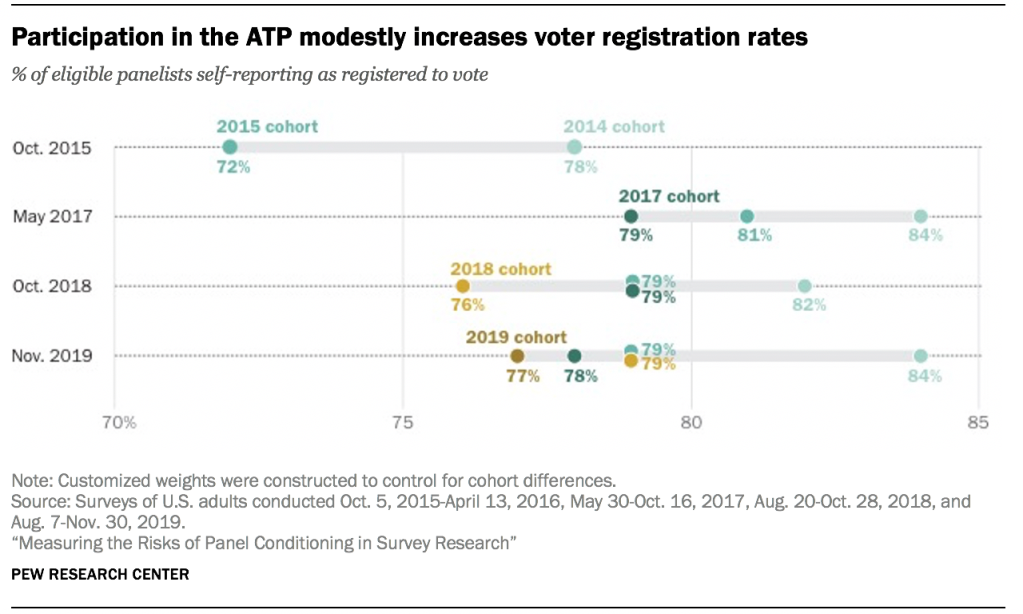
In addition to the small but significant uptick in voter registration due to conditioning, these analyses also shed light on another bias in the data: the ATP overrepresents eligible voters. While the Census Bureau estimates that 67%4 of citizens 18 years of age or older were registered to vote in 2018, 76%-82% of eligible ATP panelists were registered at the same point in time. This overrepresentation is not the result of conditioning. Instead, it is in part due to differential nonresponse. Of the people invited to participate in the panel, individuals who are registered to vote are more likely to respond and join the panel than eligible individuals who are not registered. The Center addresses this bias by weighting the data. However, as evidenced in these analyses, the weights do not eliminate the entire bias, and additional improvements are warranted.
Testing for conditioning with registered voter records
All surveys suffer from some error, so comparisons between survey estimates can conflate panel conditioning with other types of differences (e.g., measurement error, differences in recruitment methods). Researchers compared administrative data of voting before and after empanelment to further isolate panel conditioning from other differences. Specifically, Center researchers examined panelists’ voter turnout histories between 2012-2018 from two commercial voter files. This provided information about panelists both before and after they joined the ATP, allowing for analyses to determine whether the panel changed their behavior.
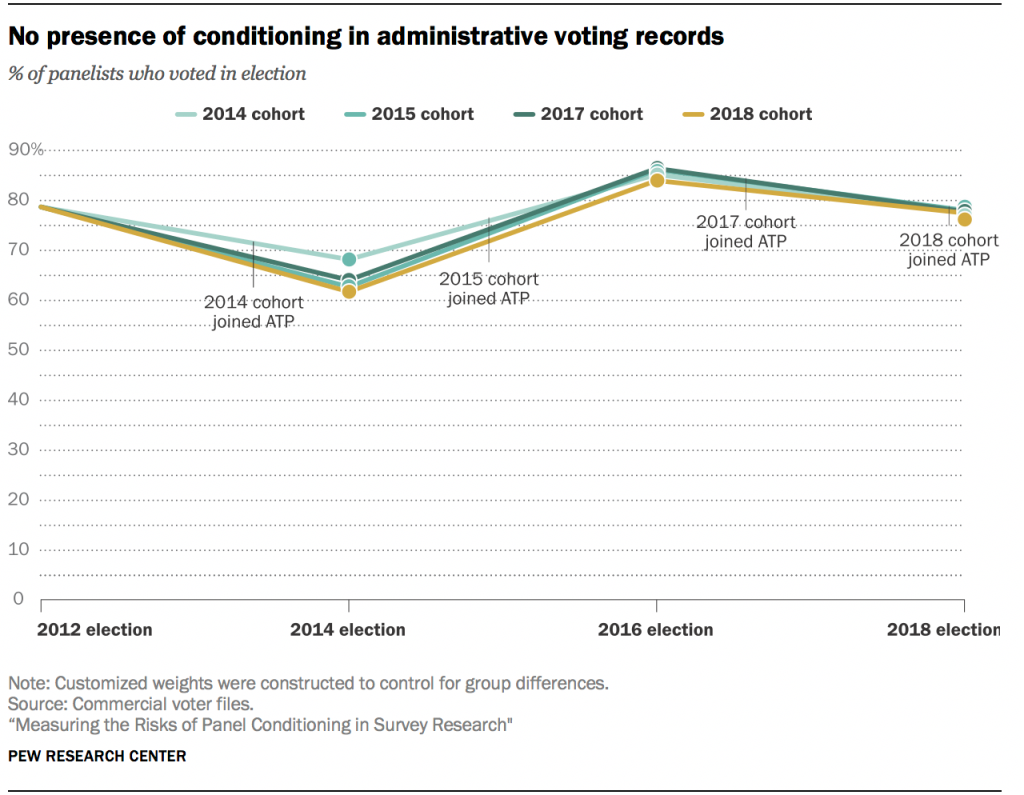
If panel conditioning changes behaviors among ATP panelists, the voter turnout among cohorts that have already joined the panel should be statistically higher than the voter turnout among cohorts that had yet to join the panel.5 If change happens immediately upon joining the panel, then the observed difference should appear immediately after empanelment and hold across years. If change is ongoing, then the difference between yet-to-be-empaneled cohorts and existing cohorts should grow over time. Since administrative records only measure behavior, this analysis cannot be used to assess whether participation in the panel changes reporting over time.
With the exception of the 2014 cohort, no differences in voter turnout were observed among cohorts in any of the four observed elections. The 2014 cohort was the only cohort to have been empaneled at the time of the 2014 election. A total of 68% of the 2014 cohort voted in the 2014 election, compared with 62%-64% of the other cohorts. However, after the 2014 election, there does not appear to be any compelling evidence of panel conditioning on the ATP when measuring voter turnout. The 2014 cohort turned out to vote at similar rates to yet-to-be-empaneled cohorts in both the 2016 and 2018 elections, and no other significant differences were observed among the other cohorts.