
Confronting 2016 and 2020 Polling Limitations
Pew Research Center’s efforts to examine its American Trends Panel surveys and develop solutions
Pew Research Center conducted a series of analyses exploring data quality in its U.S. surveys, specifically those conducted on the Center’s online survey platform, the American Trends Panel (ATP). The goal was to determine whether any stages in the survey process were introducing error, such as systematically underrepresenting certain types of Americans. Analysis of the ATP’s current recruitment practices involved obtaining the file of all residential addresses sampled for ATP recruitment in 2020. Researchers appended information to this file to determine whether those who agreed to join the ATP were different from those who were sampled but did not join. Analysis of panelist retention rates started with the 2016 post-election survey, which attempted to interview the entire panel. Researchers determined which of these panelists from 2016 were still taking surveys fours year later in 2020. Researchers tested whether certain panelists were more likely to stop taking surveys than others. Analysis of the partisan balance on the ATP uses weighted and unweighted estimates from surveys conducted 2014 to 2020.
The 2016 and 2020 elections raised questions about the state of public opinion polling. Some of the criticism was premature or overheated, considering that polling ultimately got key contours of the 2020 election correct (e.g., the Electoral College and national popular vote winner; Democrats taking control of the Senate). But the consistency with which most poll results differed from those election outcomes is undeniable. Looking at final estimates of the outcome of the 2020 U.S. presidential race, 93% of national polls overstated the Democratic candidate’s support among voters, while nearly as many (88%) did so in 2016.1
A forthcoming report from the American Association for Public Opinion Research (AAPOR) will offer a comprehensive, industry-wide look at the performance of preelection polls in 2020. But individual polling organizations are also working to understand why polls have underestimated GOP support and what adjustments may be in order.
Pew Research Center is among the organizations examining its survey processes. The Center does not predict election results, nor does it apply the likely voter modeling needed to facilitate such predictions. Instead our focus is public opinion broadly defined, among nonvoters and voters alike and mostly on topics other than elections. Even so, presidential elections and how polls fare in covering them can be informative. As an analysis discussed, if recent election polling problems stem from flawed likely voter models, then non-election polls may be fine. If, however, the problem is fewer Republicans (or certain types of Republicans) participating in surveys, that could have implications for the field more broadly.
This report summarizes new research into the data quality of Pew Research Center’s U.S. polling. It builds on prior studies that have benchmarked the Center’s data against authoritative estimates for nonelectoral topics like smoking rates, employment rates or health care coverage. As context, the Center conducts surveys using its online panel, the American Trends Panel (ATP). The ATP is recruited offline via random national sampling of residential addresses. Each survey is statistically adjusted to match national estimates for political party identification and registered voter status in addition to demographics and other benchmarks.2 The analysis in this report probes whether the ATP is in any way underrepresenting Republicans, either by recruiting too few into the panel or by losing Republicans at a higher rate. Among the key findings:
Adults joining the ATP in recent years are less Republican than those joining in earlier years. The raw, unweighted share of new ATP recruits identifying as Republican or leaning Republican was 45% in 2015, 40% in the 2018 and 38% in the 2020. This trend could reflect real-world change in participation (i.e., Republicans are increasingly resistant to polling) or real-world change in party affiliation (i.e., that there is a decline in the share of the public identifying as Republican), but it might also reflect methodological changes over time in how the ATP is recruited. Switching from telephone-based recruitment to address-based recruitment in 2018 may have been a factor. Regardless of the cause(s), more weighting correction was needed in 2020 than 2014 (when the panel was created) to make sure that Republicans and Democrats were represented proportional to their estimated share of the population.3
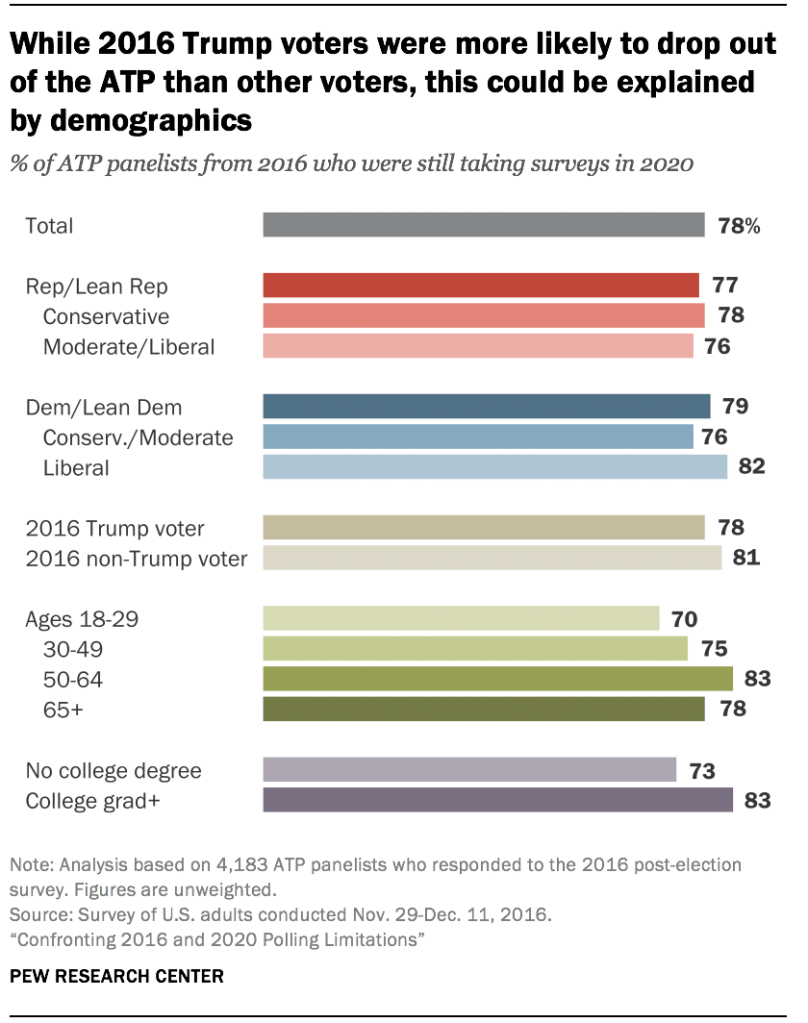
Donald Trump voters were somewhat more likely than others to leave the panel (stop taking surveys) since 2016, though this is explained by their demographics. The overall retention rate of panelists on the ATP is quite high, as 78% of respondents in 2016 were still taking surveys in 2020. But a higher share of 2016 Trump voters (22%) than Hillary Clinton or third-party voters (19%) stopped participating in the ATP during the subsequent four years. The demographic make-up of 2016 Trump voters basically explains this difference. In analysis controlling for voters’ age, race and education level, presidential vote preference does not help predict whether later they decided to leave the panel.
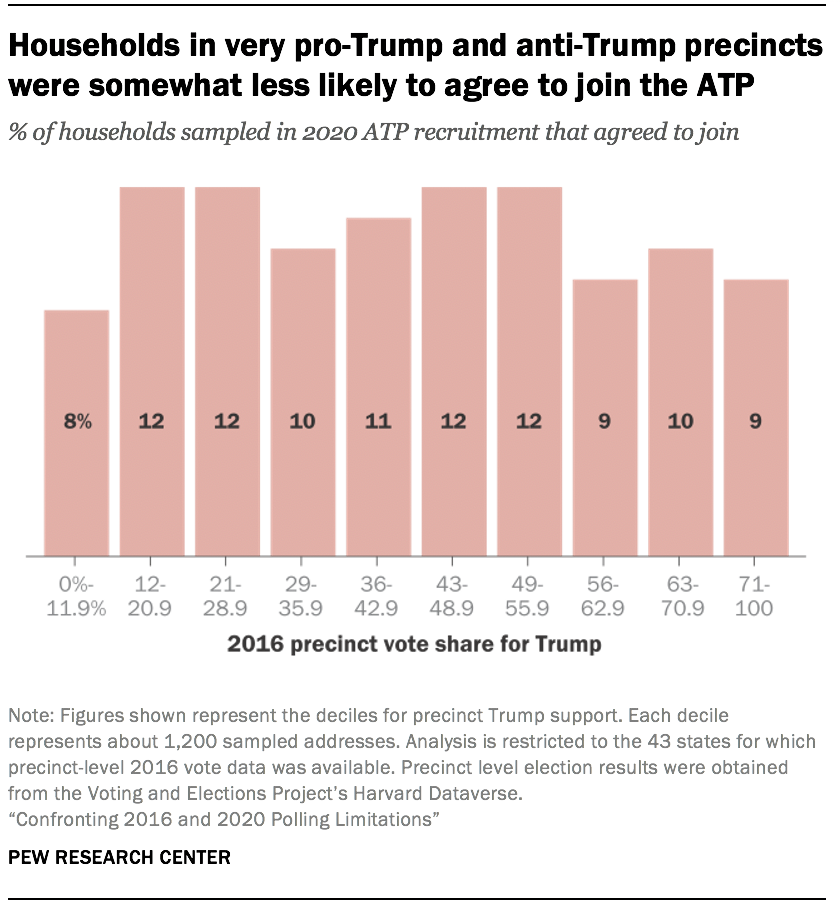
People living in the country’s most and least pro-Trump areas were somewhat less likely than others to join the panel in 2020. Researchers cannot know for sure whether someone is a Republican or Democrat based simply on their address, but election results in their voting precinct provide some insight. Analysis of addresses sampled for panel recruitment in 2020 found that households in the country’s most pro- and most anti-Trump areas were somewhat less likely to join the ATP than households in more politically balanced areas. The share of sampled households joining the ATP was 9% in the country’s most pro-Trump precincts, 8% in the country’s most anti-Trump precincts, and 11% in the remainder of the country. While these differences are not large, they are statistically significant.
Taken together, these findings suggest that achieving proper representation of Republicans is more difficult than it used to be. Survey participation has long been linked to individuals’ levels of education and social trust. Now that the GOP is doing better attracting voters with lower levels of education and, according to some analysts, doing better than in the past attracting low trust adults, Republican participation in surveys is waning, increasing reliance on weighting as a corrective.
One silver lining is that these effects do not appear to be particularly large, at least at present on the ATP. The differences between Republicans’ and Democrats’ rates of ATP participation tend to be a percentage point or two, only marginally significant in statistical testing. It seems possible for pollsters to close the gap – to increase Republicans’ participation to be more on par with Democrats – by modifying the way surveys are conducted. Based on this research, Pew Research Center is implementing a number of new strategies to improve the representation of its survey panel.
- Retiring overrepresented panelists. Researchers identified a set of panelists who are demographically overrepresented on the ATP and who, because of their demographic characteristics, contributed to the overstatement of Democratic support in the 2016 and 2020 elections. Later in spring 2021, the Center is retiring a subset of these panelists, removing them from the panel (about 2,500 panelists out of about 13,500 total will be retired). More details about the retirement process can be found in Appendix B.
- Calibrating the political balance of the ATP using a relatively high response rate survey offering mail and online response. Effective January 2021, each ATP survey is being weighted to the partisan distribution from the Center’s National Public Opinion Reference Survey (NPORS), which is a new annual survey using address-based sampling and offering mail or online response. The inaugural NPORS in 2020 had a 29% response rate and over 4,000 completions, most of which were by mail.4
- Testing an offline response mode. Part of the challenge with achieving robust representation of certain groups (e.g., from older, rural conservatives) on the ATP is that panelists must take surveys online. While the Center provides tablets and data plans to those without home internet, not everyone wants to be online. This spring the Center is fielding an experiment to determine whether it may be viable to allow panelists to respond over the phone by calling in to a toll-free number and taking a recorded survey (known as in-bound interactive voice response). Respondents receive $10 for completing the call-in survey. Those preferring to answer online can still do so.
- Empaneling adults who prefer mail to online surveys. Prior Center work has found that people who respond to an initial survey by mail (instead of online) are very difficult to recruit to the ATP, which is all done online. While such adults are hard to empanel, their inclusion would help with representation of older, less wealthy and less educated Americans. In early 2021 the Center fielded a special recruitment of adults who responded to a Center survey by mail in 2020. The recruitment used priority mailing and a $10 pre-incentive to motivate joining. The recruitment yielded several hundred new panelists.
- Developing new recruitment materials. Researchers are retooling the ATP recruitment materials with an eye toward using more accessible language and more compelling arguments for why people should join. Starting in 2021, the Center is sending sampled households a color, trifold brochure about the ATP in addition to the normal cover letter and $2 pre-incentive. The Center is also creating a short video explaining the ATP and why those who have been selected to participate should join.
One question raised by this multifaceted strategy is whether it might overcorrect for the initial challenge and result in an overrepresentation of Republicans. While that is a possibility, we feel that the risks from too little action are greater. The Center’s analysis pointed to two issues: partisan differences in willingness to join the ATP and in likelihood of dropping out of the panel. In turn, the panel weighting was needing to do an inordinate amount of work to compensate for differences between the panel and the U.S. adult population. The action plan described above speaks to both issues, but only with an eye toward truing things up, not blindly going beyond. Several of the steps are exploratory, determining if and how a design change might improve the panel. Depending on the testing results, such steps (e.g., offering inbound IVR as a supplemental mode) may or may not ultimately be implemented on the ATP. Moreover, steps such as exploring an offline response mode or modifying recruitment materials are expected to improve representation among several harder to reach segments of society, not simply supporters of one candidate.
A final question is whether such actions are necessary. Indeed, a recent Center analysis found that errors in election estimates of the magnitude seen in the 2020 election have very minor consequences for attitudinal, mass opinion estimates (e.g., views on a government guarantee of health care or perceptions of the impact of immigrants on the country). That simulation-based analysis, while helpful for scoping the scale of the issue, does not speak to the erosion of trust in polling and certainly doesn’t negate pollsters’ obligation to make their surveys as accurate as possible. Even if the steps outlined above yield relatively small effects, we expect that they will improve the data quality in Center surveys.
Testing for partisan differences in survey panel recruitment
The first step in selecting adults for Center surveys is drawing a random, national sample of residential addresses. We mail these addresses and ask a randomly selected adult to join our survey panel. One way that a partisan imbalance could emerge is if Republicans are less likely than Democrats to agree to join, or vice versa. Determining whether this is happening is difficult because the ideal data do not exist. Our surveys sample from all U.S. adults, and there is no database to tell us whether the adults we asked to join favor one party or another.
We can, however, answer this question for the people we asked to join who are registered to vote and live a state that records party registration. Researchers took the 16,001 addresses sampled in 2020 for recruitment and matched them to a national registered voter file. This matching yielded 23,503 registered voter records. Some 42% of those voter records were registered with a political party. This analysis finds no clear indication that people’s likelihood of joining the panel is related to partisanship. The share of registered Republicans at addresses we sampled who agreed to join the ATP (12%) was not statistically different from the share of registered Democrats who agreed to join (13%).
A different approach yielded a more discernable pattern. The alternate approach involved looking at the community in which people live – specifically whether it is a pro-Trump area or not – to make inferences about the people asked to join the panel. Researchers did this by looking at precinct-level voting data. At the time of this analysis, only data from the 2016 election was available. Researchers analyzed what share of the precinct’s voters backed Donald Trump in 2016 and looked to see if there was a relationship with willingness to join the ATP.
Overall, the relationship is fairly noisy. Willingness to join the ATP does not consistently increase or decrease as precincts get progressively more supportive of Trump. That said, there is some indication that willingness to join the panel is slightly lower at both extremes. In the most pro-Trump areas – precincts across the U.S. with the highest Trump vote share – 9% of sampled households agreed to join the panel. In the most anti-Trump areas – precincts with the lowest Trump vote share – 8% of sampled households agreed to join the panel. In the rest of the country 11% of sampled households agreed to join the panel.5
In analysis controlling for local levels of wealth, education, and racial composition, the electoral support for Trump remains a negative predictor (albeit a modest one) of a household’s likelihood of joining the ATP.6 On balance, these analyses suggest that Trump supporters may be slightly less likely than others to join the ATP.
Testing for partisan differences in dropping out of the panel
Another way that a partisan imbalance could emerge is if Republicans are more likely to drop out of the panel than Democrats, or vice versa. There are several reasons why people drop out of survey panels, including becoming too busy or disinterested, changing contact information and losing touch, incapacitation, death, or removal by panel management. On the ATP most dropout is from panelist inactivity (i.e., not responding to several consecutive surveys) eventually leading to their removal.
As a starting point, researchers examined panelists who completed the 2016 post-election survey, which attempted to interview the entire panel. Researchers determined which of these panelists from 2016 were still taking surveys fours year later in 2020. The majority of the 2016 panelists (78%) remained active in 2020, while 22% had dropped out. Panelists who said they voted for Trump in 2016 were somewhat more likely to drop out of the panel than those who voted for another candidate (22% versus 19%, respectively). This result, while based on just one panel, lends some support to the notion that Trump supporters have become slightly less willing to participate in surveys in recent years.
Dropout rates varied across other dimensions as well. For example, panelists who in 2016 were younger and had lower levels of formal education were more likely to drop out of the panel than others. In fact, when controlling for a panelist’s age and education level, Trump voters were not significantly more likely to leave the panel than other voters. In other words, the higher dropout rate among Trump supporters is likely explained by their demographic characteristics.
Evaluating the composition of the panel
Another way researchers evaluated the ATP was to look at the overall shares of Republicans and Democrats and determine if those shares were correct. This simple question is extremely difficult to answer, for several reasons:
- No timely, definitive data exist to provide an answer. Polling data are timely but often limited by sampling as well as other potential errors. Gold-standard surveys like the General Social Survey (GSS) are quite accurate but less timely and exclude the 8% of adults who are not citizens. Presidential elections are authoritative but exclude the roughly 40% of adults who cannot or do not vote.
- Surveys require statistical adjustments called “weighting.” It is debatable whether investigators should focus only on the weighted (adjusted) partisan estimates or whether they should also consider a panel’s unweighted (raw) partisan estimates.
Keeping these limitations in mind, researchers analyzed the partisan composition of the ATP over time, by recruitment cohort. Since the ATP was created in 2014, the Center has usually, though not always, fielded an annual recruitment to add new panelists. The size and design of the recruitment has changed over time. Notably, starting in 2018, the recruitment switched to address-based sampling (ABS) instead telephone random digit dial (RDD).
The analysis found that the recruitment cohorts generally have been getting less Republican over time. The raw, unweighted share of new ATP recruits identifying as Republican or leaning Republican was 45% in 2015, 40% in 2018 and 38% in 2020. The forces behind that trend are not entirely clear, as there are at least three potential explanations.
The methodological change in 2018 from using RDD to ABS to recruit panelists may have played a role. The RDD-recruited cohorts both had proportionally more Republicans than the ABS-recruited cohorts. Another possible explanation for the trend is that the GOP has been losing adherents gradually over time. In other words, the unweighted ATP recruitments may reflect a real decline in the share of adults identifying as Republican nationally. While national demographic changes suggest that is plausible, this idea is not supported by the Center’s or other survey organizations’ research. For example, Pew Research Center, the General Social Survey and Gallup all show the share of U.S. adults identifying as Republican or leaning Republican being generally stable since 2016. Since there is no compelling evidence that there was a significant decline in Republican affiliation from 2014 to 2020, this explanation seems unlikely.
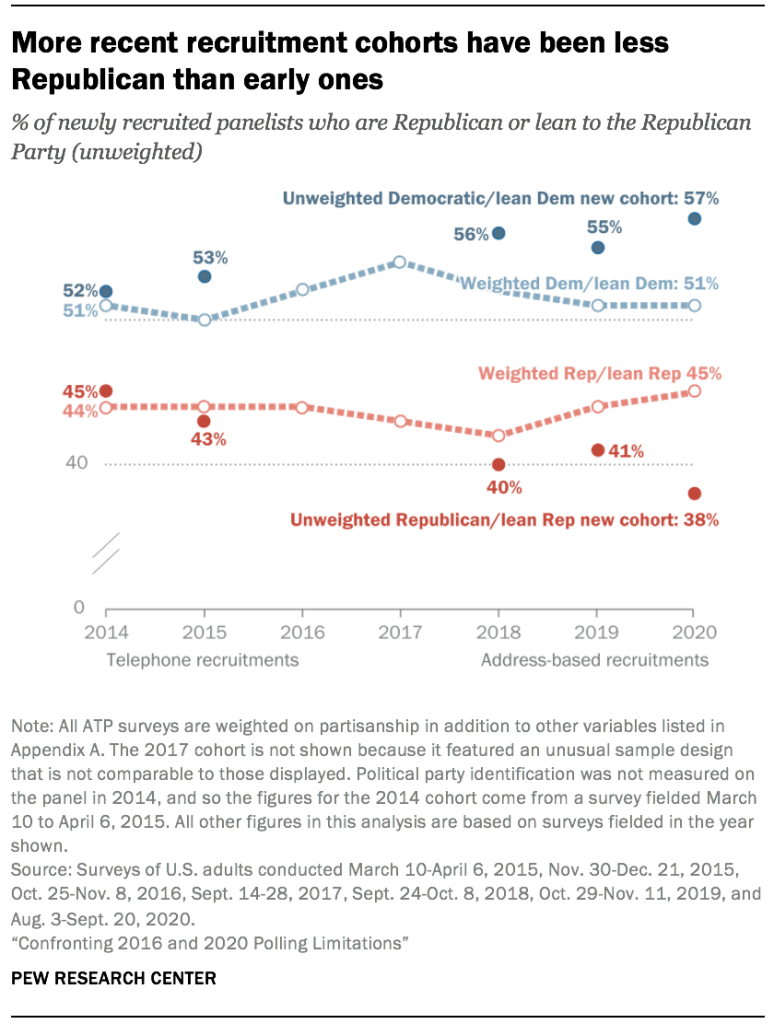
Another explanation could be that Republicans are increasingly unwilling to participate in surveys. This idea would suggest that the unweighted ATP recruitments reflect a real decline in the share of Republicans responding to surveys or joining survey panels. This idea is not supported by GSS or Gallup poll trends. However, it is consistent with one prominent interpretation of polling errors in the 2016 and 2020 elections: that they stem from certain types of Republicans not participating in polls.
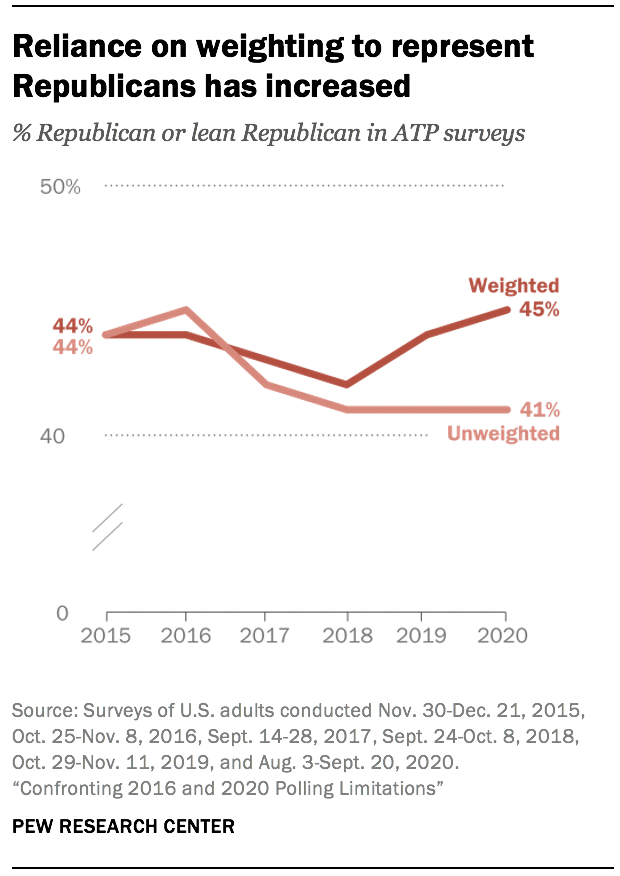
Whatever the cause, the newer cohorts are less Republican. This trend has not, however, had much effect on ATP survey estimates. This is because every ATP survey features a weighting adjustment for political affiliation. This means that the surveys are weighted to align with the share of U.S. adults who identify as a Democrat or Republican, based on an external source.7 The weighted partisan balance on the ATP has been rather stable. The weighted share of adults in ATP surveys who are Republican or lean to the Republican Party has stayed in the 42% to 45% range for six years.
While weighting helps to make ATP estimates nationally representative, the trend in the unweighted data is a concern. The recent increases in the size of the weighting correction on partisanship suggests that the panel would benefit from shoring up participation among harder to reach groups. If that is successful, then reliance on weighting will lessen.
As mentioned earlier, Pew Research Center is pursuing several measures. The first step is adjusting the composition of the existing panel. Researchers identified panelists belonging to overrepresented groups (e.g., panelists who get weighted down rather than up). A subset of this group of panelists, which skews highly educated and collectively leans Democratic, is being retired from the panel, meaning they will no longer be surveyed. Details of the retirement plan are in Appendix B. Researchers are also exploring new and potentially more effective ways to recruit adults who have historically been difficult to empanel (which includes lower socioeconomic status adults of all races and political views). This includes recruitment of adults who are resistant to taking surveys online, developing new ATP recruitment materials, and exploring an offline response mode.
The impact from these modifications on ATP estimates will generally be subtle because panel surveys have long been weighting on key dimensions like partisanship, education, and civic and political engagement. But even small improvements in accuracy are worth pursuing and relying less on weighting as a corrective will make estimates more precise.


