Pew Research Center

FOR RELEASE OCTOBER 9, 2018

Comparing Survey Sampling Strategies: Random-Digit Dial vs. Voter Files

Despite sparseness of telephone numbers, a national registration-based poll yielded estimates on par with a parallel random-digit-dial poll

FOR MEDIA OR OTHER INQUIRIES:

Communications Department
202.419.4372
www.pewresearch.org

RECOMMENDED CITATION

Pew Research Center, October 2018, "Comparing Survey Sampling Strategies: Random-Digit Dial vs. Voter Files"

About Pew Research Center

Pew Research Center is a nonpartisan, nonadvocacy fact tank that informs the public about the issues, attitudes and trends shaping the world. It does not take policy positions. The Center conducts public opinion polling, demographic research, computational social science research and other data-driven research. It studies politics and policy; news habits and media; the internet and technology; religion; race and ethnicity; international affairs; social, demographic and economic trends; science; research methodology and data science; and immigration and migration. Pew Research Center is a subsidiary of The Pew Charitable Trusts, its primary funder.

© Pew Research Center 2026

Table of contents

  • About Pew Research Center
  • Comparing Survey Sampling Strategies: Random-Digit Dial vs. Voter Files
  • 1. RBS and RDD polls yield broadly similar pictures of the public’s mood
  • 2. RBS and RDD surveys show similar levels of accuracy when compared with population benchmarks
  • 3. Performance of the samples
  • 4. The RBS poll comports well with data from the full voter file about the partisanship of registered voters
  • Acknowledgements
  • Appendix: Survey methodology

Comparing Survey Sampling Strategies: Random-Digit Dial vs. Voter Files

Despite sparseness of telephone numbers, a national registration-based poll yielded estimates on par with a parallel random-digit-dial poll

By Courtney Kennedy, Nick Hatley, Scott Keeter, Andrew Mercer, Ruth Igielnik and Frederic Traylor

A new telephone survey experiment finds that, despite major structural differences, an opinion poll drawn from a commercial voter file can produce results similar to those from a sample based on random-digit-dialing (RDD). The study intentionally pushed the boundaries of current polling practices by employing a voter file and a registration-based sampling (RBS) approach as the basis of a full national sample. While voter files are widely used for election surveys at the state and local level, relatively few pollsters have employed them for national surveys. As a result, there are few settled best practices for how to draw national samples from voter files and how to handle missing phone numbers.

The study also tackles the question of how successful voter files are in representing Americans as a whole, including those who are not registered to vote. This research was possible because voter file vendors are increasingly trying to provide coverage of all U.S. adults, including those who are not registered to vote, by combining state voter rolls with other commercially available databases.

On the large majority of survey questions compared (56 of 65), RBS and RDD polls produced estimates that were statistically indistinguishable.1 Where the polls differed, the RBS results tilted somewhat more Democratic than the RDD results.

An analysis of survey participation among registered voters in the RBS sample found that any partisan differences between RDD and RBS surveys are unlikely to be the result of too many Democrats responding. In fact, the set of confirmed registered voters who participated in the RBS survey were somewhat more Republican than the national voter file as a whole in terms of their modeled partisanship (38% vs. 33%, respectively).2 The routine demographic weighting applied to the sample corrected most of this overrepresentation.

Despite missing phone numbers on the RBS sampling frame, estimates were on par with RDD


Viewed comparatively, the study found several notable advantages to national sampling using the voter file. One such advantage of RBS is the ability to compare the partisan leanings of people who respond to a poll to those who do not – giving researchers some sense as to whether the nonresponders are significantly different from those who are answering. By comparison, little is known about those who do not respond to RDD surveys. RBS is also less expensive to conduct because the phone numbers that are available are more likely to be in service. Two-thirds (66%) of the numbers dialed in the RBS survey were working and residential, versus fewer than half (44%) of those dialed in the RDD survey.

onresponse tilted RBS sample more Republican; largely fixed by weighting

The major limitation of RBS for telephone polling is the absence of a phone number for wide swaths of the public. Unlike RDD samples, which are based on telephone numbers, RBS samples are based on lists of people who may or may not have an associated telephone number on the file. In the national voter file used in this study, a phone number was available for 60% of registered voter records and 54% of the nonregistered adult records. A key finding is that this low coverage rate did not translate into inferior estimates, relative to RDD. On 15 questions where benchmark data were available from government surveys, the RBS and RDD polls showed similar levels of accuracy on estimates for all U.S. adults and also in a companion analysis that examined five benchmark questions for registered voters. When the RBS and RDD estimates differed from the benchmarks, they both tended to overrepresent adults who are struggling financially. For example, the American Community Survey finds that about one-in-ten U.S. adults (10%) do not have health insurance, but this rate was 13% in the RDD survey and 14% in the RBS.

The RDD survey was conducted according to Pew Research Center’s standard protocol for telephone surveys. Interviewing occurred from April 25 to May 1, 2018, with 1,503 adults living in the U.S., including 376 respondents on a landline telephone (25% of the total) and 1,127 on a cellphone (75%). The parallel RBS survey interviewed 1,800 adults, with 884 interviewed on a landline (49%) and 916 interviewed on a cellphone (51%) using a seven-call protocol, which was also used for the RDD survey. Interviewing began April 25 and concluded on May 17, 2018. Both surveys included interviews in English and Spanish.

Other key findings:

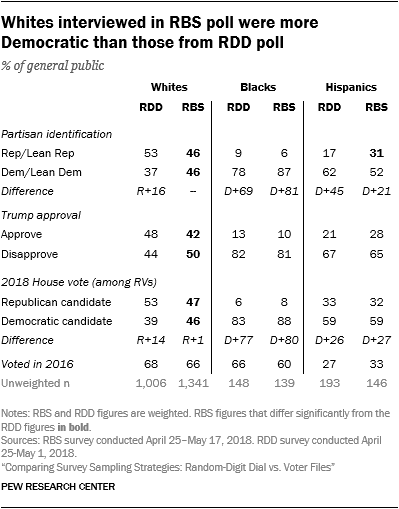
    • Whites reached by RBS were more Democratic than those reached by RDD. Among non-Hispanic whites, partisanship was evenly split in the RBS survey (46% identified with or leaned to the Republican Party, 46% identified with or leaned to the Democratic Party), while in the RDD there was a 16-point Republican advantage (53% Republican, 37% Democrat). The pattern was reversed for Hispanics.
    • Presence of phone numbers on the RBS frame varies substantially by state. In the national registered voter file used for this study, the share of records with a phone number ranged from a low of 30% in Alaska to a high of 84% in Indiana. This phenomenon has long been discussed by survey researchers and has greater implications for state and local surveys than national ones.3
    • Both RBS and RDD surveys recorded a low response rate. One of the purported advantages of RBS surveys is their efficiency. Unlike RDD surveys, which rely on lists of potentially working telephone numbers, RBS surveys leverage lists of actual Americans. In addition, RBS surveys typically focus on registered voters, a population that tends to be more cooperative with survey requests than those who are unregistered. The overall response rate was 8% for the RBS survey versus 6% for the RDD survey.
    • The RBS survey required more weighting than the RDD survey. While the pool of adults responding to both the RDD and RBS surveys contained proportionally too many college graduates, non-Hispanic whites and older adults, the severity of these imbalances was more acute for the RBS survey. For example, while 19% of U.S. adults are ages 65 and older, this rate was 42% in the RDD sample and 49% in the RBS sample, prior to weighting. Consequently, despite its larger sample size, the margin of error for the RBS survey was larger than that of the RDD survey (3.4 and 3.0 percentage points, respectively).

Overview of study methodology

As part of a multi-year examination of commercial voter files – lists of U.S. adults that combine state voter registries with other public and commercial databases – Pew Research Center conducted parallel national telephone surveys to compare voter files with random-digit-dialing as a sample source. A comparison of results from the two sources is the subject of this report. Among the goals of the study is to determine whether commercial voter files (RBS) could provide data of comparable or better quality than RDD at similar or lower cost. The parallel surveys employed nearly identical questionnaires and were conducted in roughly the same time period (April and May of 2018). The questionnaires included content typical of Pew Research Center political surveys, along with several measures of economic, demographic and lifestyle characteristics for which government statistics are available as a benchmark.

Despite their name, commercial voter files are not limited to registered voters. As research and targeting using these voter files has become more widespread, voter file vendors are increasingly trying to provide coverage of all U.S. adults, including those who are not registered to vote. Accordingly, assessing their suitability as a source for producing a representative sample of the entire U.S. adult population is a key objective of this study.

Icon for promotion number 1

Sign up for our Weekly newsletter

Fresh data delivered Saturday mornings

Processing...

To obtain the RBS samples for this study, Pew Research Center purchased samples consisting of 1% of the total number of records separately in the registered voter and nonregistered adult databases from L2, a nonpartisan commercial voter file vendor. From these two 1% files, smaller samples were drawn for survey administration. An effort was made to locate a telephone number for all records that did not already have one attached. Telephone numbers were ultimately available or located for 73% of individuals in the RBS registered voter sample and for 55% of those in the RBS nonregistered sample.

Linking named individuals in the voter files to the obtained survey respondent makes it possible to take advantage of important information on the files, most notably an individual’s history of turnout in previous elections. For those reached on a landline, the survey asked for the sampled person by name before proceeding with the interview. If the named person was not living in the household, the interview ended. Due to greater effort and expense involved in obtaining cellphone respondents, researchers took a different approach with the cellphone respondents. Respondents reached on a cellphone were administered the entire interview and asked to confirm their name at the end. More than six-in-ten cellphone respondents (62%) confirmed being the person named on the sampled record. Following the interview, an effort was made to locate those who did not confirm their name (N=351, or 38% of all cellphone respondents) in the L2 databases. In total, 36 of these 351 respondents were located under a different telephone number. Including the 884 landline respondents, a total of 1,485 of the 1,800 respondents have an associated record in either the registered voter or nonregistered database.

The RDD and RBS samples were weighted to match national population parameters for sex, age, race, Hispanic origin, region, population density, telephone usage and self-reported voter registration status. Voter registration is not typically used by Pew Research Center as a weighting variable for its RDD surveys but was employed here in order to ensure that the RDD and RBS samples were identical with respect to this important indicator of political engagement.4

Limitations and caveats

[5. A recent Center study explored differences between five voter file vendors in the accuracy of data they were able to match to a national sample of adults (specifically the 3,985 adults active in the American Trends Panel).]

While RBS samples are widely used for election polling in individual states and localities, there have been relatively few national RBS surveys like the one conducted here.5 As a consequence, there are few widely accepted best practices for national surveys among practitioners. Pew Research Center researchers made a number of choices in designing the RBS study that might differ from what other researchers would choose to do. For example, RBS pollsters typically sample only records that have a phone number on file, but this RBS sample was selected without regard to presence of a phone number. This enabled us to test whether there would be a material benefit from sampling records that could be matched to a phone number with greater effort. This RBS survey also sampled 21% of its respondents from the vendor’s national database of unregistered adults. We are not aware of any other RBS polls that have sampled nonregistered cases.

Despite efforts to ensure that the RBS and RDD survey efforts were identical in all respects other than the samples used, some differences occurred. The field period for the RBS study was 16 days longer than for the RDD survey, due mainly to limits on availability of interviewer labor. In addition, the ratio of cellphone to landline respondents was 75%-to-25% in the RDD survey and 50%-50% in the RBS survey, as the majority of telephone numbers available in voter files are landlines.
1. RBS and RDD polls yield broadly similar pictures of the public’s mood

CORRECTION: (May 6, 2019): In the third chart of chapter 1 of the report, the words “RBS” and “RDD” were reversed in the original title. The title has been corrected to read, “Registered voters from RDD were slightly more conservative than those from RBS.” Changes did not affect the report’s substantive findings.

Commercial voter files are used predominantly as sampling sources for surveys of registered voters, but most of the major vote file vendors say that their databases provide coverage of the nonregistered as well. The sample used in this study is drawn from both registered voter (RV) and nonregistered (non-RV) databases marketed by the vendor. This section of the report compares general public samples from random-digit-dial and registration-based sources.

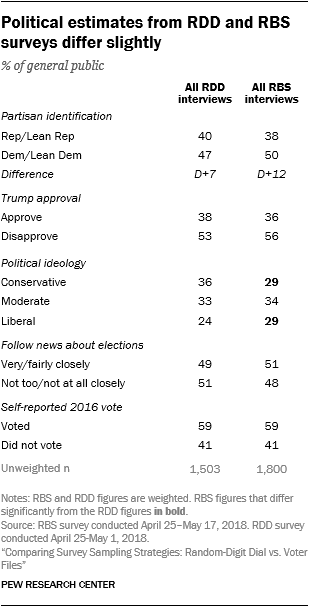
The RDD and RBS samples produce similar results across a wide range of topics. Reported party affiliation, approval of Donald Trump and two measures of electoral engagement – 2016 general election turnout and attention to news about the 2018 elections – are very similar in the two samples.7 On two other measures of attention to news about foreign affairs (the Iran nuclear agreement and negotiations with North Korea), respondents in the RBS sample were slightly more likely than those in the RDD sample to say they had heard “a lot” about these issues.

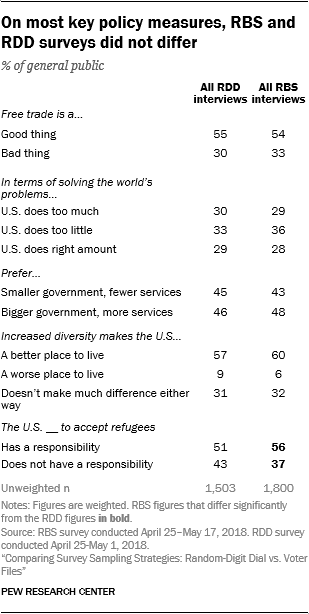
On a few items, there is a slight tendency for the RDD sample to produce more conservative attitudes and pro-Republican responses, but the differences tend to be quite small. For example, self-described conservatives make up 36% of the RDD sample, compared with 29% of the RBS sample.8 And more respondents in the RDD than the RBS sample say the Republican Party has good policy ideas and high ethical standards. The share saying the U.S. has a responsibility to accept refugees was also lower in the RDD sample (51%) than the RBS sample (56%).

But for the most part, partisan and policy differences between the samples are quite modest. Notably, there is no difference between the estimates produced in the two surveys in opinion about the proper size of government, a key political orientation that has defined the division between Republicans and Democrats for decades. Respondents in both samples are roughly evenly divided over whether we need a bigger or a smaller government.

On a range of specific issues, from support for free trade, to views about increased racial and ethnic diversity, to the U.S.’s proper role abroad, RBS and RDD samples produce equivalent estimates. For example, the share who said free trade is a good thing for the country is nearly identical in the RBS survey and the RDD survey (around 55% in each). Similarly, there is little difference between the surveys in views about whether the U.S. does too much, too little or about the right amount to solve the world’s problems. Views on the death penalty, tariffs and renewable energy hardly differ between the samples.

Even for the small number of items on which statistically significant sample differences are observed, the main conclusions one would draw about the shape of public opinion would be similar, regardless of which sample provided the data.

RBS figures for registered voters tended to tilt more Democratic than those from RDD

When the samples are narrowed to include only registered voters, somewhat larger political differences emerge. Given that this RBS survey interviewed a broader sample than is typical in practice (e.g., including 385 interviews from a database of nonregistered adults), two sets of weighted registered voter estimates are presented.

The “self-described” RV estimates are based on all RBS survey respondents (whether from the registered or nonregistered databases) who reported being registered to vote at their current address. These estimates provide the best apples-to-apples comparison with the RDD survey, which used the same criterion to define RVs. The “confirmed” RV estimates are not based on self-reporting, but on whether the respondent was identified in the voter file as being registered and confirmed that they were the person named on the file. The confirmed RV estimates presumably come closer to common practice among pollsters using RBS because the estimates are restricted to registered voter file sample.

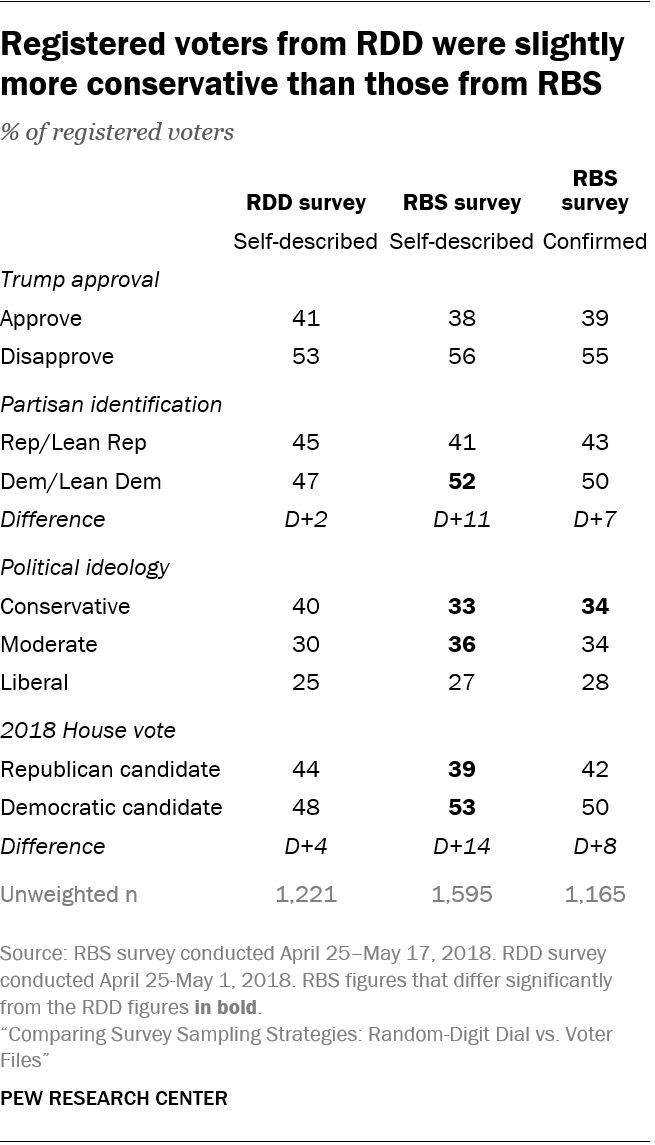
The RDD and RBS surveys paint somewhat different pictures of registered voter sentiment on the upcoming midterm election. Both surveys (conducted in the spring) show more support for Democratic congressional candidates than Republican ones, but the estimates from the RDD survey suggest a smaller Democratic advantage than estimates from the RBS survey. Among RVs from the RDD survey, 48% choose or lean toward the Democratic candidate, while 44% choose or lean Republican. Among self-described RVs from the RBS survey, 53% choose or lean toward the Democratic candidate, while 39% choose or lean Republican. Results for confirmed RVs in the RBS survey fell in between (50% favoring the Democrat; 42% favoring the Republican).

And while political ideology is a fraught measure,9 it showed a similar pattern. RVs from the RDD poll were more likely to describe their views as conservative (40%) than the confirmed RVs from the RBS poll (34%).

On most policy questions, there was no discernable gap between the RV figures coming from the two polls, as differences fell within the margin of error. The RDD and RBS samples produced highly similar registered voter figures for questions about free trade, unions, the death penalty, the proper size of government and more.

On the few policy items that were appreciably different across samples, the RBS estimates were more liberal than those from RDD. The share of registered voters expressing support for the U.S. developing alternative energy sources over expanding production of oil, coal and natural gas was 69% in the RBS poll versus 64% in the RDD poll. Confirmed RVs from RBS were also more likely to say that the U.S. has a responsibility to accept refugees (57%) than those from RDD (51%).

Why do the RBS estimates tilt slightly more Democratic than those from RDD?

On paper, structural aspects of registration-based sampling seem to make it more effective for reaching Republicans than Democrats. Generally speaking, people must be registered to vote in order to be interviewed in an RBS survey. Studies, including this one, have long found that Republicans and those who lean Republican are more likely to be registered to vote than Democrats and Democratic leaners (72% vs. 64%, respectively, in the RDD survey). Furthermore, phone numbers on the voter file can get out-of-date, especially when people move. A 2016 Center survey found that Republicans are less likely than Democrats to have moved within the last five years (34% vs. 40%, respectively). A person’s chance of getting selected for an RDD survey, by contrast, is not tied to their registration status or how long they’ve lived at their home.

The results from this study showing an RBS sample that tilts, if anything, slightly more Democratic than an RDD sample run counter to these structural considerations. So, what’s going on?

There is no clear answer. Much of that difference between the RDD and RBS results stems from white non-Hispanic adults. Among whites, partisanship is evenly split in the RBS survey (46% identify with or lean to the Republican Party, while 46% identify with or lean to the Democratic Party). The RDD survey shows a 16-point Republican advantage (53% Republican vs. 37% Democrat).

The pattern is reversed for Hispanics. While Hispanics in both surveys are more likely to identify with or lean Democratic than Republican, the RDD survey produces a larger Democratic advantage than the RBS survey. Among self-identified Hispanics, there is a 45-point partisan gap in favor of Democrats in the RDD survey (62% Democratic vs. 17% Republican), compared with a 21-point gap in the RBS survey (52% Democratic vs. 31% Republican). Put another way, Hispanics in the RBS survey are nearly twice as likely as Hispanics in the RDD survey to identify as Republicans (31% vs. 17%). But the Hispanic population is one-quarter the size of the white population in the U.S., so patterns among whites tend to outweigh patterns among Hispanics in estimates for the entire adult population. There was no clear explanation as to why whites reached by RBS differed from those reached by RDD. A look at the educational and regional distributions within the two samples of whites revealed no major differences.

2. RBS and RDD surveys show similar levels of accuracy when compared with population benchmarks

To gauge the accuracy of estimates from the RDD and RBS samples on nonpolitical topics, the surveys included a number of questions that are also measured in high-quality federal surveys with high response rates.10 This study measures accuracy by looking at how closely the weighted RDD and RBS telephone survey estimates match up with 15 benchmarks for the U.S. adult population from the federal surveys. The benchmarks cover a range of respondent characteristics, attitudes and behaviors such as health insurance coverage, smoking, use of food stamps, employment status and sleep habits.

Overall, estimates from the RBS survey were very similar to those from the RDD survey. The mean absolute difference from government benchmarks was 3.3 for the RBS and 3.9 percentage points for the RDD surveys.11 None of the RBS estimates was significantly different from the RDD estimates on the benchmark items.

When the RBS and RDD estimates departed from the benchmarks, they tended to overrepresent adults who are struggling financially. According to the American Community Survey, about one-in-ten U.S. adults (10%) do not have health insurance, but this rate was 13% in the RDD survey and 14% in the RBS. Similarly, 30% of RBS respondents and 32% of RDD respondents reported an annual family income less than $30,000. The benchmark from the American Community Survey, a high response rate survey conducted by the Census Bureau, is 23%. And compared with a government survey, many more telephone survey respondents (in both samples) said they were “very worried” about not having enough money for retirement.

There were also a few discernable departures from population benchmarks on a mix of lifestyle items. Both the RDD and RBS surveys overrepresented adults who live alone, average less than seven hours of sleep per night, and have practiced yoga at least once in the past 12 months.

But on about half (seven) of the 15 benchmarks, the RDD and RBS surveys both captured the benchmark value within the telephone surveys’ margin of error. For example, both surveys were highly accurate on the share of American receiving unemployment benefits, the share not employed and the share diagnosed with high blood pressure.

The study also found highly similar levels of accuracy from the RBS and RDD surveys for subgroup estimates. For example, RDD and RBS estimates for Hispanic adults diverged from Hispanic benchmarks by an average of 4.8 and 4.7 percentage points, respectively, across the measures examined. RDD and RBS estimates for non-Hispanic blacks diverged from benchmarks by 5.6 and 6.3 percentage points, respectively. Indeed, the clearest finding from this analysis is that the RDD and RBS surveys produced highly similar estimates on these 15 questions with reliable, known population values.

Registered voter estimates from RDD and RBS show similar levels of accuracy

The study also compared the accuracy from the RDD versus RBS surveys for estimates based on registered voters (RVs). There are fewer benchmark variables available for this analysis than for the analysis above looking at estimates for all adults. That’s because the source of benchmarks for RVs is the Current Population Survey (CPS) Voting and Registration Supplement, which does not ask about topics such as computer usage, concern about saving for retirement, or smoking.

On the five questions where RV benchmarks are available, the study finds very similar levels of accuracy for the RDD and RBS surveys. Both surveys come within 3 or 4 percentage points of the RV benchmark for employment but underrepresent those with children and overrepresent those living alone.

As with the benchmarks for the entire adult population, this RV analysis suggests that both the RBS and RDD surveys slightly overrepresent adults struggling financially. For example, the CPS benchmark shows that one-in-five RVs (21%) have annual family income under $30,000, but in both the RDD and RBS surveys that share was one-quarter (25%).

Caveats about benchmarks

Assessing bias in surveys requires an objective standard to which the findings can be compared. In election polling, this standard is the outcome of the election – at least for measures of voting intention. Administrative records, such as the number of licensed drivers, can provide others. But most benchmarks are taken from other surveys. Aside from the number of licensed drivers, the benchmarks used here are drawn from large government surveys conducted at considerable expense and with great attention to survey quality. But they are nevertheless surveys and are subject to some of the same problems that face surveys like the two telephone surveys examined here.

Government surveys tend to have very high response rates compared with surveys with opinion polls conducted by commercial vendors or nonprofit organizations like Pew Research Center. Accordingly, the risk of nonresponse bias is generally thought to be lower for these government surveys, though it still exists. More relevant is the fact that all surveys, no matter the response rate, are subject to measurement error. Questions asked on government surveys are carefully developed and tested, but they are not immune to some of the factors that create problems of reliability and validity in all surveys. The context in which a question is asked – and the questions that come before it – often affects responses to it. Given that this study selects benchmarks from more than a dozen different government surveys, it is impossible to re-create the exact context in which each of the questions was asked. Similarly, all survey items may be subject to some degree of response bias, most notably “social desirability bias.” Especially when an interviewer is present, respondents may sometimes modify their responses to present themselves in a more favorable light (e.g., by overstating their frequency of voting). All of these factors can affect the comparability of seemingly identical measures asked on different surveys, though government surveys may be affected by the same forces.

One other issue is that benchmarks are generally unavailable for questions about attitudes and behaviors that the government does not study. As a result, this analysis uses benchmarks for only a subset of the questions asked on the survey. Moreover, Pew Research Center’s work – and the work of other polling organizations conducting political and social research – tends to focus on subjects and questions other than the ones for which benchmarks are available.

CORRECTION (April 2021): A previous version of this report incorrectly stated the mean absolute difference between the RDD sample estimates and government benchmarks. None of the study’s findings or conclusions are affected.

3. Performance of the samples

One of the claimed advantages of RBS surveys is their efficiency. Unlike RDD surveys, which rely on lists of potentially working telephone numbers, RBS surveys use lists of actual Americans. Despite these structural differences, this study found little advantage for the RBS sample in terms of efficiency. The overall response rate was 8% for the RBS survey versus 6% for the RDD survey.

What’s more, at least one design decision led the RBS response rate in this study to be higher than what is typically seen in practice. When pollsters conduct RBS surveys, they often find it cost-prohibitive to require that the person they interview match the name of the voter file record sampled for the survey. We required that matching for this study, though only for landline cases. Discussions with the survey vendor and with other pollsters suggested that the match rate would be too low when calling cellphone numbers to attempt matching.

If there had been no matching requirement in this study, the response rate for RBS landline cases is projected to have been approximately 4% (rather than the observed 11%), pushing the overall RBS response rate down to a projected 5% (rather than the observed 8%).12

A look at the cellphones dialed in the RBS and RDD surveys provides a more apple-to-apples comparison. In both surveys, when calling a cellphone number, interviewers attempted to complete the survey with whomever answered the phone provided that the person was age 18 or older. The cellphone response rate was 6% in both surveys.

Stepping outside the RBS comparison for a moment, the response rate to the RDD survey is noteworthy on its own. The last Pew Research Center study to drill deep into RDD data quality found that, in 2016, the average response rate to the Center’s RDD surveys was 9%. The RDD response rate in this study was 6%. While the rate fluctuates from survey to survey, the 6% found here is indicative of a general decrease in RDD response rates over the last two years. Identifying the causes of that decline is beyond the scope of this study, though there have been multiple reports about the recent increase in telemarketing to cellphones and the effects of technology designed to combat it.

Characteristics of the raw, unweighted samples

When no statistical weighting is applied to the data, shortcomings of the RBS sample come into view. The RBS sample produced a larger share of non-Hispanic whites (75% vs. 67% for the RDD sample; Non-Hispanic whites are 64% of the population) and obtained substantially fewer Hispanics: 8% in the RBS sample vs. 13% in the RDD sample. The RBS sample was also significantly older, with a 38% share of those age 65 and older, compared with 28% among the RDD sample. Respondents under 30 years of age constituted only 10% of the RBS sample but were 15% of the RDD sample (the actual population share for this age group is 22%).

The samples differed little in terms of educational achievement. As with most surveys, college graduates were substantially overrepresented relative to their actual share of the adult population. The RBS sample did produce a better gender distribution than the RDD sample. There were roughly equal numbers of men and women in the RBS sample, while the RDD sample was 58% male, 42% female. Within the RBS sample, there were relatively modest differences in the demographic composition of the registered voter and nonregistered samples. Hispanics made up 7% of the registered sample and 13% of the nonregistered sample.

Among registered voters, the story was broadly the same. Both of the unweighted RV samples skew considerably older than the actual RV population. According to the CPS, about one quarter (23%) of registered voters in the U.S. are ages 65 and older, but among the confirmed RVs from the RBS sample in this study, the rate was 43%. By comparison, just 31% of the self-described RVs from the RDD survey were ages 65 and up.

The registered voter samples from the RBS survey also had disproportionately high shares of non-Hispanic whites (76% of the confirmed RVs sample compared to 72% based on the CPS). The racial and ethnic profile of the RDD RV sample, by comparison, aligned very closely with the CPS benchmarks. On education, all three RV samples over-represented college-educated RVs to a similar extent.

While the weighting applied to these RV samples eliminated nearly all of these demographic differences, the benchmark analysis suggests that the confirmed RV estimates remained a bit too influenced by older, retired adults.

RBS poll had larger design effects from weighting

The RBS and the RDD survey were weighted using the Center’s standard weighting protocol for RDD surveys,13 with an additional raking parameter of voter registration from the 2016 Current Population Survey Voting and Registration Supplement.14 One consequence of weighting is to increase the level of variability in survey estimates. The magnitude of this increase is captured by a measure known as the approximate design effect.15

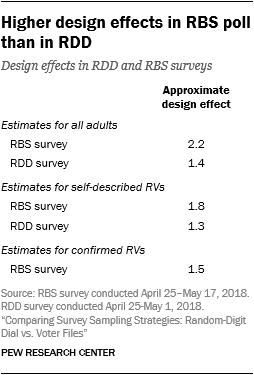
Using the weighting protocol employed for this study, the RBS survey had a higher design effect than the RDD survey. The approximate design effect for estimates of all U.S. adults based on the RBS survey was 2.2 compared with 1.4 from the RDD survey. In concrete terms, this means that after weighting, despite a nominal sample size of 1,800, the RBS sample was equivalent to a simple random sample of 818 adults. Although the RDD sample had a smaller nominal sample size of 1,503, the smaller design effect gives it an effective sample size of 1,071. Consequently, the margin of error after weighting is higher for the RBS poll than the RDD poll (3.4 and 3.0 percentage points, respectively).

The main contributing factor to the higher design effect was that the unweighted RBS sample (compared with the RDD sample) diverged more sharply from the population parameters on key weighting variables. Before weighting, the RBS survey had a higher share of non-Hispanic whites, adults with a bachelor’s degree or more and adults ages 65 or older. Sample design decisions for the RBS survey (e.g., sampling from both RV and non-RV databases and sampling records with no phone number) also impact the design effect. However, the effect of the demographic weighting adjustments was much larger.

Many people reached in the RBS survey were not the person on the voter record

In theory, one significant advantage of RBS surveys over RDD is that they provide the pollster with useful information about both the respondents interviewed and people who were selected but not interviewed. Using RBS, the pollsters can see the turnout history and modeled political partisan leaning for all of the sampled records before any interviewing is done. If the sample of people who take the survey looks different from those who do not, the pollster can statistically adjust the data to make it more representative.

But this idea rests on the assumption that the person interviewed is the same person whose registration record was selected. Anecdotally, several pollsters who use RBS have noted that the person who answers the phone is often not the person whose record was selected. Mismatches have several potential causes, such as the person on the sample record being deceased or just changing their phone number.

In fact, when designing this RBS study we heeded the vendor’s recommendation that it is impractical to require that the person interviewed match the person named on the sampled record when calling cellphones. As a result, this study implemented a two-track strategy. When interviewers called a cellphone, they interviewed whomever answered the phone, provided that they were age 18 or over. At the end of the survey, the interviewer asked if they were speaking to the person named on the sampled record. Roughly two-thirds of the time (62%) the respondent confirmed that was their name.

When interviewers called a landline in the RBS study, they started the interview by asking to speak with the person named on the sample records. Less than a third of the time (31%), the person answering confirmed that the name on the sample record belonged to them.

On the surface, these results might seem to suggest that it was easier to reach the person on the sample record when calling cellphone numbers than landlines. But that is not an accurate conclusion, because the landline confirmation was a screening question at the very beginning of the interview and the cellphone confirmation occurred at the end, making the two rates not directly comparable. It is well documented that screening questions tend to lead to motivated underreporting, such as declining to confirm in order to avoid an interview.[16. Tourangeau, Roger, Frauke Kreuter and Stephanie Eckman. 2012. “Motivated Underreporting in Screening Interviews.” Public Opinion Quarterly, 76: 453-469.]

Moreover, the cellphone rate is restricted to just the 916 cooperative people who completed the entire interview. The landline rate, by contrast, is based on a much larger pool of 3,292 people comprised mostly of people who simply gave some indication that the interviewer had reached the wrong number and were not interviewed. In other words, the denominator of the landline rate seems to contain cases that may have been eligible but were refusing the interview request. After consulting with the survey vendor, we determined that this was the cleanest way to compute the confirmation rate among the landline cases. In addition, the landline confirmation rate in this study may be lower than normal due to an oversight made by the sample vendor, in which the sample they initially provided did not include the most recent phone numbers available to them. The affected cases were updated during the field period, but this may have reduced the possibility of reaching the person on the sample record early in the field period.

While the exact name confirmation rates in this study may not generalize very well for a number of reasons, they do underscore the general difficulty in trying to interview the person corresponding to the sample record in an RBS survey.

CORRECTION (April 2021): A previous version of this report incorrectly stated the mean absolute difference between the RDD sample estimates and government benchmarks. None of the study’s findings or conclusions are affected.

4. The RBS poll comports well with data from the full voter file about the partisanship of registered voters

The finding that the registration-based poll tilted slightly less politically conservative than the random-digit-dial poll raises the possibility that the RBS poll suffered from differential partisan nonresponse, with the Republicans called in the RBS poll being less likely to participate than Democrats. That would yield an RBS poll that was too Democratic relative to the U.S. as a whole. But a comparison of those sampled with those responding shows that Republicans were actually more likely to respond than Democrats. Furthermore, routine weighting brought the RBS poll basically in line with registered voters on the full national voter file.

Nonresponse tilted RBS sample more Republican; largely fixed by weighting

Unlike with RDD, RBS polling makes it possible to examine the political partisanship of the survey respondents, the nonrespondents and the U.S. as a whole. For those individuals identified as registered to vote by state governments, the voter file has a score (ranging from 0 to 100) describing their likelihood of voting for Democrats or Republicans, with higher numbers indicating a preference for Democrats. These data are modeled estimates of political partisanship by the vendor, and they account for a person’s party registration, race, where they live and other characteristics appended from other publicly available databases. Analysis conducted as part of this study (and others) confirmed that the modeled partisanship data correspond closely with people’s own responses about their political leanings.

Normally, an RBS pollster would just have access to the modeled partisanship of the people sampled for the poll. For this study, Pew Research Center supplemented that with a file consisting of a representative 1% of the total registered voter records in the commercial voter file vendor’s database. In this section, “full voter file” is used as shorthand for estimates computed using the 1% sample of registered voters.17

[18. The sample drawn for the RBS poll was designed to be representative of the country. As expected, the modeled partisanship for all the registered voter records sampled for the poll, which includes respondents and nonrespondents, was 55% likely Democrat and 33% likely Republicans. This is exactly the same as the distribution for the entire national 1% file, which rules out sampling error as a potential reason for differences between the RBS poll estimates and the full voter file.]

Telephone coverage and nonresponse for registered voters

Analysis of how the RBS poll respondents compared with the full voter file provided many additional insights beyond just partisan nonresponse. To unpack this, it is useful to note that there are two main problems that can lead to unrepresentative samples: noncoverage and nonresponse. Noncoverage means that some individuals in the population are not listed in the frame used to select the sample. Nonresponse occurs when some portion of those who were sampled ultimately do not complete the survey, typically because they could not be reached or declined to participate. Both noncoverage and nonresponse mean that some portion of the population is not included in the final set of survey respondents. If that missing portion is sufficiently large and systematically different from the rest of the population, the result can be biased survey estimates. All surveys suffer from noncoverage and nonresponse to some extent, and pollsters use weighting adjustments to try to correct any imbalances and reduce bias.

Since most public opinion telephone surveys have response rates in the single digits, nonresponse receives the lion’s share of attention from pollsters and survey methodologists. What’s more, the landline and cellphone frames used for RDD telephone surveys together cover about 97% of the adult population in the U.S., making noncoverage much less of a concern.18

For RBS surveys based on voter files, the story is very different, at least with respect to coverage. While nearly all registered voters are listed in state voter files, many of those records do not have an associated telephone number. For this study, the sample of registered voters was drawn from a representative 1% sample of the vendor’s voter file. Only 60% of the records in that file had any kind of telephone number. Importantly, the coverage rate varied considerably across states, ranging from a low of 30% in Alaska to a high of 84% in Indiana. While technically listed on the sampling frame, there is no practical way for individuals without phone numbers to be included in a telephone survey, making them effectively uncovered. For this survey, records without telephone numbers were sent to Survey Sampling International, which performed an additional search. This brought the telephone coverage rate for registered voters up to 73%.

When it comes to nonresponse, RBS and RDD surveys likely have similar dynamics – after all, it is improbable that one’s decision to answer the phone and participate in a survey hinges on the pollster’s choice of database. That said, there may still be important differences from RDD. This could be the case if the kinds of people who have telephone numbers on the file are also easier to contact or more willing to participate, or if asking for respondents by name influences the decision to participate.19

Fortunately, commercial voter files also contain a great deal of information about everyone on the file, not just those who have a phone number or responded to the survey. This makes it possible to see how telephone coverage and nonresponse influence the composition of the survey respondents and how well weighting works to correct any imbalance.

Although the file has hundreds of variables, this analysis was limited to some basic demographics that are known to be accurate in the voter files (age, sex, and race), modeled partisanship, and voting in the 2012, 2014 and 2016 general elections. With the exception of age and vote history, which come directly from state records, these variables must be appended from other sources or estimated using statistical models.

Prior to weighting, there were substantial differences between the national file and the survey respondents confirmed to be registered voters. With few exceptions, these differences were driven by nonresponse rather than telephone coverage. Weighting adjustments were largely successful in correcting demographic and partisan differences, but only partially effective at reducing the overrepresentation of more engaged voters.

Unweighted, RBS respondents skew older than full voter file

In terms of demographics, the complete file and the portion with telephone numbers were virtually identical. For sex, age and race, none of the categories differed by more than a percentage point. Nonresponse, on the other hand, produced much larger shifts.

The largest differences occurred with age. Individuals ages 65 and older made up 25% of the complete file and 26% of those with telephone numbers. Among respondents, the share was nearly twice as large, at 46%. The shares in the 18-29 and 30-64 age groups were lower than for the complete file by 8 and 13 percentage points respectively.

The racial composition of the unweighted sample was also significantly biased due to nonresponse. Whites made up 75% of confirmed respondents – 11 points higher than the rate on the full voter file and the portion with telephone numbers (both 64% white). The balance of men to women was only minimally affected, with men making up 46% of the full file and 49% of confirmed respondents.

After weighting respondents to match the demographic profile of registered voters in the 2016 CPS Voting and Registration Supplement, the poll’s age and sex distributions both fell back in line with the figures for full national file. Weighting brought the share of white respondents down to 71%. While this is fully 7 points higher than for the complete file, it closely aligns with the CPS estimate (72%) used for weighting.

Missing phone numbers, nonresponse lead to overestimates of voting

Voter turnout is the one area where telephone coverage appears to be a meaningful source of error (after weighting) in RBS polling. Across the entire file, 70% of registered voters are recorded as voting in the 2016 presidential election, 41% in the 2014 midterm and 60% in 2012. The turnout rate for all three elections is 3 to 4 percentage points higher among records with a telephone number. After nonresponse, this relatively modest coverage bias increased by an additional 13 to 14 points for the 2012 and 2016 presidential elections and an even larger 21 points for the 2014 midterm.

The overrepresentation of more politically engaged voters was only partially corrected by weighting. At 82%, the weighted share of respondents who voted in 2016 was still 12 points higher than the full voter file. For 2014, weighting brought the share from 65% down to 54%. For 2012, weighting brought the share who voted from 78% to 69%, for a final error of 9 percentage points.

Acknowledgements

This report was made possible by The Pew Charitable Trusts. Pew Research Center is a subsidiary of The Pew Charitable Trusts, its primary funder.

This report is a collaborative effort based on the input and analysis of the following individuals:

Research team

Courtney Kennedy, Director, Survey Research Nick Hatley, Research Analyst Scott Keeter, Senior Survey Advisor Andrew Mercer, Senior Research Methodologist Ruth Igielnik, Senior Researcher Arnold Lau, Research Analyst Frederic Traylor, Intern, Summer 2018 Hannah Hartig, Research Analyst Jocelyn Kiley, Associate Director, Politics Claudia Deane, Vice President of Research

Communications and editorial

Rachel Weisel, Communications Manager Hannah Klein, Communications Associate Travis Mitchell, Copy Editor

Graphic design and web publishing

Bill Webster, Information Graphics Designer Travis Mitchell, Digital Producer

Appendix: Survey methodology

The random-digit-dial survey (RDD) was conducted according to Pew Research Center’s standard protocol for RDD surveys. Interviewing occurred April 25 through May 1, 2018, with 1,503 adults living in the U.S., including 376 respondents on a landline telephone (25% of the total) and 1,127 on a cellphone (75%). The parallel registration-based sampling survey interviewed 1,854 adults, with 916 interviewed on a landline (49%) and 938 interviewed on a cellphone (51%) using calling rules identical to those used for RDD surveys. Interviewing began April 25 and concluded on May 17, 2018. Both surveys included interviews in English and Spanish.

A total of 1,800 interviews were completed with a general population registration-based sample (RBS) and an additional 54 interviews were completed with respondents as part of an RBS Hispanic oversample. A decision was made during the fielding of the RBS survey to discontinue the Hispanic oversample due to exceedingly low productivity. None of the 54 interviews from the Hispanic oversample were included in analysis for this report. Abt Associates was the survey research firm.

Sampling

The sample for the RDD survey was drawn according to Pew Research Center’s protocol RDD surveys. A combination of landline and cellphone random-digit-dial samples were used. Both samples were provided by Survey Sampling International. Respondents in the landline sample were selected by randomly asking for the youngest adult male or female who is now at home. Interviews in the cell sample were conducted with the person who answered the phone if that person was an adult age 18 or older.

The sample vendor for the RBS survey was L2, a nonpartisan commercial voter file firm. The RBS survey featured a proactive strategy to deal with missing phone numbers. The sample was selected without regard for whether the record had a phone number available or not. First, the registered voter frame was sorted by vote frequency, political party affiliation, race and age. The frame for the unregistered was sorted by race and age. Samples stratified by state and presence of a telephone number were then selected from each frame. Sampled records without a phone were processed through Survey Sampling International’s telephone append service. The pre-append was able to match in a number for roughly a quarter (28%) of the records that had been missing a phone number. These numbers accounted for 46% of the RBS interviews.

After approximately 14,000 records were loaded for dialing, the RBS sample vendor determined that the sample it originally provided did not include the most recent phone numbers available. The sample was then sent back to L2 to provide updated telephone numbers. Some 6% of records had a new telephone number after the vendor corrected the issue.

Weighting

Both the RDD and RBS surveys were weighed in two stages. The first stage of weighting for the RDD survey accounts for the fact that respondents with both landline and cellphones have a greater probability of being included in the combined sample than adults with just one type of phone. It also adjusts for household size among respondents with a landline phone. For the RBS survey, the first stage weighting accounts for similar properties in the RDD survey as well as multiplicity in the registered and non-registered frame. The first-stage weighting in the RBS also adjusts for differential probabilities of selection in areas that are more or less likely to have listed respondents without a phone number.

For the second stage, both surveys were weighted using an iterative technique to match national population parameters for sex, age, race, Hispanic origin, region, population density, telephone usage and self-reported voter registration status. Voter registration is not typically used by Pew Research Center as a weighting variable for its RDD surveys but was employed here in order to assure that the RDD and RBS samples were identical with respect to this important indicator of political engagement.21

No additional weighting was done to self-reported registered voters for either the RDD and RBS surveys since both full samples were weighted to targets for the total adult population. Confirmed registered voters in the RBS sample (respondents that were reached through the registered-voter file and confirmed they were the person that was sampled) were weighted to match population parameters among registered voters for sex, age, race, Hispanic origin and region from the 2016 CPS Voting Supplement.

The margins of error reported and statistical tests of significance are adjusted to account for the survey’s design effect, a measure of how much efficiency is lost from the weighting procedures.

Dispositions by frame and sample

Why the projected response rate goes down when the matching requirement in the RBS survey is removed

When Center researchers projected what the response rate for the RBS landline sample would have been if the survey had interviewed any adult, rather than requiring that the person interviewed match the sampled record, the response rate for that study component dropped from 11% to 4%. It is not necessarily intuitive why that happens.

The explanation stems from a quirk in how response rate formulas deal with uncertainty. At the end of many surveys, there are some sampled records for which the respondent’s eligibility for the study is unknown. Landline RBS cases in this study where classified as uncertain if interviewers were never able to speak with someone and determine whether the person on file lived in the household (e.g., because they no one answered or they hung up immediately).

Pollsters deal with that uncertainty by using the eligibility rate of similar records to compute a data-driven estimate for what share of the uncertain cases were in fact eligible for the survey. The lower that data-driven estimate, the fewer uncertain cases are counted against the response rate (that is, fewer are considered to be refusals to participate). In this study, the data-driven estimate for the share of uncertain landline RBS cases that were likely to have been eligible was 33% (see “e2” in the third column of the above table), which was how often interviewers confirmed that the person on record lived at the household reached on the phone. Consequently, only one-in-three uncertain cases were counted against the response rate. Without the matching requirement, any adult would have been eligible, putting the data-driven estimate at basically 100% (which it is in landline RDD samples). When 100% of the cases with uncertain eligibility are assumed to have been eligible, all such cases are counted against the response rate, driving it down. In this study, the RBS response rate drops to 4% under this scenario.