How Americans Are Engaged With News, Politics, Religion and Civic Life
Mapping how Americans take part in society – or don't
BYElisa Shearer, Luxuan Wang, Katerina Eva Matsa, Michael Lipka, Benjamin Toff and Kirsten Eddy
About the Pew-Knight Initiative
The Pew-Knight Initiative supports new research on how Americans absorb civic information, form beliefs and identities, and engage in their communities. Pew Research Center is a nonpartisan, nonadvocacy fact tank that informs the public about the issues, attitudes and trends shaping the world. Knight Foundation is a social investor committed to supporting informed and engaged communities.
This report from the Pew-Knight Initiative examines how Americans engage in public life across a range of activities, including politics, civic and community involvement, news consumption and religious participation. It analyzes how patterns of engagement, when clustered together, can form distinct groups within the U.S. public. It also explores how these engagement groups differ in their demographics, attitudes and levels of civic knowledge.
The report draws from nationally representative surveys of U.S. adults (refer to “How we did this” below). Many questions in these surveys asked about behaviors in the past 12 months, which for most respondents included the 2024 presidential election. Responses reflect the activities Americans took part in during this specific period. Patterns around political activity in particular may look somewhat different at other points in the political cycle.
Why we did this
People participate in public life in different ways – from voting and volunteering to following the news and taking part in religious or community activities. But these behaviors are often studied separately, making it difficult to see how they come together in people’s day-to-day lives. We conducted this study to provide a more integrated picture of how the public engages across these different domains.
We also used a specially designed survey with the awareness that some surveys can struggle to reach Americans who are less likely to participate in public life – because these same people also may be less likely to participate in surveys.
How we did this
This analysis draws on two Pew Research Center surveys.
The main data source is the Cross‑Sectional Engagement Survey, fielded July 9 to Dec. 5, 2025, among 5,393 adults. People could respond online, on paper or by telephone, and we reached out multiple times to people who didn’t initially respond. Refer to the methodology for details.
We also used data from Wave 179 of the American Trends Panel (ATP), a nationally representative panel of randomly selected U.S. adults, conducted Sept. 8-14, 2025, among 5,195 respondents via web and phone.
To classify Americans into engagement groups, we did a cluster analysis of the Cross-Sectional Engagement Survey based on 19 measures of participation across the range of activities mentioned above. Respondents in the ATP survey were assigned to these groups based on how similar their patterns of behavior were to those identified in the cross‑sectional survey. We used the ATP survey to examine engagement groups’ levels of civic knowledge and views of politics and news. Refer to “How we measured Americans’ engagement in public life” for details on questionnaire design and data analysis approaches.
How Americans Are Engaged With News, Politics, Religion and Civic Life
Mapping how Americans take part in society – or don't
How many Americans show up in public life – and in what ways?
These questions have been on people’s minds since even before a global pandemic disrupted social activities for years and technologies like smartphones, social media and artificial intelligence began to change the way humans interact.
Americans’ engagement with others is not one-dimensional, according to a new Pew Research Center study from the Pew-Knight Initiative. We looked across a range of behaviors: political activity, civic involvement, religious attendance and attention to news. What we found was that rather than falling along a single spectrum, U.S. adults sort into four distinct groups that reflect different patterns of participation:
Mobilizers (9% of U.S. adults) are the most active across all the different areas. They volunteer, attend local government meetings, donate to political causes, follow the news closely and attend religious services at high rates. What sets them apart most clearly is their political action: They are by far the most likely to do things like volunteer for campaigns and contact elected officials.
Connectors (28%) are involved in many ways, centering on community life, charitable giving and religious attendance. They vote, participate in groups, attend religious services and donate to nonpolitical causes at high rates, similar to Mobilizers. But they are much less likely to take political action.
Spectators (31%) are much less likely than Mobilizers and Connectors to participate in civic or political activities, but they follow the news at similarly high rates. When they engage with news online, Spectators tend to do so by privately chatting about it or liking posts rather than publicly commenting or posting.
Outsiders (31%) participate at relatively low levels across the activities measured in this study, including following the news. Still, they are not universally disengaged: 41% say they voted in 2024, and 24% attend religious services at least monthly.
Refer to the appendix for the full list of 19 questions that were used to create these groups, as well as how each group answered all of the questions. Read “How we measured Americans’ engagement in public life” for a detailed look at how we conducted this study.
Although political polarization has been a defining fact of American life in the 21st century, none of the four groups is dominated by one political party.
The two most highly engaged groups lean modestly in different directions politically: Mobilizers are slightly more likely to be Democrats (or lean Democratic) and Connectors are a bit more likely to be Republicans or GOP leaners. But it is clear that members of both parties engage – or don’t – in a variety of ways.
Yet broad claims about whether Americans are “engaged” or “disengaged” – and how this is changing over time – are difficult to assess. Participation in public life takes many forms, from attending a school board meeting in person to sharing a news article online, and it is not easily captured by any single measure. The way people engage also is evolving along with technological changes.
To better capture the full range of how Americans participate, this study looked at several ways Americans engage (or don’t) with the world around them, using a large, one-time national survey. The survey was conducted in late 2025 and was designed to capture the opinions of Americans who engage at different levels, offering respondents the chance to complete the survey on paper, by phone, or online, and making multiple efforts to contact people who didn’t initially respond.
Below, we take a closer look at each of the four groups.
About one-in-ten U.S. adults (9%) are highly engaged across politics, civic life, news and religion.
Mobilizers stand out for the breadth and frequency of their participation. A large majority (77%) have volunteered in the past 12 months, and 73% have been members of a group, organization or association during this time. Among U.S. adults overall, roughly three-in-ten participate in these activities.
What sets the Mobilizers apart most clearly is their political activity over the past year – especially behaviors that are relatively rare among the broader public. About three-quarters of Mobilizers (74%) say they have displayed a sign, bumper sticker or clothing item for a political cause or candidate. Roughly two‑thirds (65%) say they have contacted an elected representative. And about one-in-five (21%) have volunteered for a political campaign.
Who are Mobilizers?
Demographically, Mobilizers are much more likely than Americans overall to have high levels of education and income. And as mentioned above, Mobilizers are more likely to identify with or lean toward the Democratic Party (57%) than the Republican Party (41%).
Mobilizers also include higher shares of both conservative Republicans and liberal Democrats than U.S. adults as a whole. And they stand out in their ideological intensity: Republicans in this group are more likely than Republicans in other groups to describe themselves as very conservative, while Democrats are more likely to describe themselves as very liberal.
Refer to the detailed tables for demographic breakdowns of all four engagement groups.
Connectors
As a group, Connectors are about triple the size of the Mobilizers, making up 28% of U.S. adults. They are active in many areas of public life but are less politically involved – and less interested in politics – than Mobilizers.
About two-thirds of Connectors (65%) were members of a group, association or organization in the past year, though they are less likely than Mobilizers to hold leadership roles within those groups. They tend to follow the news (national and local) and reported voting in 2024 at high rates, similar to Mobilizers. But they are less likely to contact elected officials, volunteer for campaigns or display public support for political causes (whether online or not).
Their engagement centers on community life rather than politics. Nine‑in‑ten say they have donated to nonpolitical organizations like charities. Connectors also attend religious services at a similar rate to Mobilizers.
Who are Connectors?
The Connectors resemble the Mobilizers in some ways: They tend to have higher levels of education and income than the general public. They are also older and somewhat more likely to be White. They are made up of slightly more Republicans than Democrats.
Refer to the detailed tables for demographic breakdowns of all four engagement groups.
Spectators
About three-in-ten Americans are Spectators (31%). These are people who follow the news at high rates but largely stay on the sidelines of other civic and political activities.
For example, 84% say they follow national news at least somewhat closely, and three-quarters say they liked or saved an online post about news in the past week. But they are much less likely than Mobilizers or Connectors to vote, volunteer or belong to a group or organization.
Even when Spectators engage with news online, they are much more likely to like a post or privately chat about it than to publicly comment. Many also say they discuss news with others at least a few times a week. But most do not describe themselves as highly interested in politics.
Who are Spectators?
Spectators are by far the youngest group: 28% are under 30 and 64% are under 50. They stand out for their internet use – 56% say they use the internet “almost constantly.” They are also less likely to be White, and more likely to identify as politically moderate compared with Mobilizers and Connectors.
Refer to the detailed tables for demographic breakdowns of all four engagement groups.
Outsiders
About three-in-ten Americans (31%) participate at low levels across the activities measured in this study. Outsiders are less engaged than Americans overall on every kind of measure – from more demanding activities like volunteering and attending meetings to lower-threshold behaviors like voting or following the news. They are also less likely to attend religious services, even though they are no less likely to say they believe in God.
Some Outsiders do participate in these activities – 41% say they voted in 2024, and 24% say they attend religious services in person at least monthly – but this group is clearly the least engaged. Very few take part in political activities like volunteering or advocacy.
While Outsiders are similar to Spectators in their rates of voting and volunteering, they stand out for their much lower level of attention to the news. For example, 41% of Outsiders say they follow national news at least somewhat closely, compared with 84% of Spectators. And just 7% of Outsiders say they have liked or saved a post about the news online in the past week – versus 75% of Spectators.
Who are Outsiders?
Outsiders are similar to the U.S. population as a whole in terms of age and gender. They are fairly evenly split by political party, and about half (48%) describe their political views as moderate. They are distinguished primarily by lower levels of education and income: About half have a high school diploma or less education, and 31% are in lower-income households.
Refer to the detailed tables for demographic breakdowns of all four engagement groups.
CORRECTION (July 17, 2026): In the chart titled “How 4 groups vary by key measures of social and civic engagement,” some y-axes have been rescaled for consistency across the graphic. The figures and findings in this report were not affected.
Younger and older Americans engage in public life in different ways
Age is closely linked with how Americans take part in public life, with older and younger Americans often taking different paths to participation.
Older adults are more likely to participate in long-standing civic activities like voting, donating money or attending religious services. Younger adults, meanwhile, are more likely to engage online, including by liking or privately sharing news content.
In a new study, we sorted Americans into four groups based on their answers to questions about engagement in public life. Older Americans are more likely than younger adults to be Connectors, who tend to participate in civic and community life. About four-in-ten people ages 65 and older (43%) are in this group – almost three times the share of adults ages 18 to 29 (15%).
In contrast, younger Americans are more likely to be Spectators – those who follow the news and interact with it online but are less engaged in other aspects of public life. Nearly half of adults under 30 are Spectators (46%), compared with 19% of adults 65 and older.
Similar shares of younger and older adults fall into the most and least engaged groups. About one-in-ten Americans regardless of age are Mobilizers, while roughly three-in-ten are Outsiders.
About the engagement groups
This study sorts Americans into four groups based on their answers to 19 questions about how they engage (or don’t engage) in society through political activity, civic involvement, religious service attendance and attention to news. The four groups are:
Mobilizers: Doing it all. This group is the smallest and the most active across politics, civics, news and religion.
Connectors: Involved, but less political. This group is larger than the Mobilizers and also highly engaged in many ways – including joining groups and making donations – but much less likely than the Mobilizers to be heavily involved in political activities.
Spectators: Keeping an eye on things. They follow the news at high rates but are much less likely than the more engaged groups to participate directly in other ways.
Outsiders: Less involved in most ways. This group is less likely than others to report taking part in most of the activities we asked about – including voting, volunteering and following the news.
About three-quarters of Americans ages 65 and older (77%) say they voted in the 2024 presidential election between Kamala Harris and Donald Trump. Each of the younger age groups was less likely to say they voted, and fewer than half of U.S. adults under 30 say they voted (45%).
Older Americans – who tend to have more financial resources – are also more likely than younger people to donate money or goods. About six-in-ten adults in the oldest age group (59%) say they gave more than $25 to a nonpolitical organization in the past 12 months, nearly double the share of the youngest age group (31%). And 18% of those 65 and older gave money to a political organization or campaign, versus just 6% of adults under 30.
When it comes to engagement in news and religion, older adults again are involved at higher levels than younger Americans:
News consumption: 83% of those in the oldest age group say they follow national news very or somewhat closely, compared with 64% among adults under 30.
Religious participation: 39% of Americans 65 and older say they attend religious services in person at least monthly, higher than all other age groups. The oldest group is also more likely than younger Americans to watch or participate in religious services online or on TV.
Younger Americans are more engaged online
Despite their lower levels of engagement in many political and civic activities, younger Americans are not entirely checked out. Instead, they tend to engage in more observational ways – especially when it comes to news in digital spaces.
About six-in-ten U.S. adults ages 18 to 29 say they have liked or saved posts about news online in the past week (59%), much higher than the share of those 65 and older who say this (32%).
Younger Americans are also more likely than older people to privately chat about or share news on social media or a messaging app. However, the same pattern doesn’t apply to publicly posting or commenting about news online: Roughly a quarter of Americans across age groups say they do so.
Aside from digital engagement, younger Americans are also modestly more likely than older people to volunteer. About a third of U.S. adults under 30 (32%) and a similar share of those ages 30 to 49 (31%) say they volunteered for an organization or association in the past 12 months. Smaller shares of people ages 50 to 64 (26%) and 65 and older (25%) say the same.
Democrats and Republicans engage in public life in similar ways
Democrats and Republicans differ on many issues. But when it comes to how partisans show up in public life, they look strikingly similar.
Each of the two major U.S. political parties includes people who are deeply involved in public life – across politics, community, religion and news – and those who do almost none of these things, including many who are not especially interested in politics.
But some patterns around partisanship and politics did emerge in our new study, which sorted Americans into four engagement groups by how they answered questions about participating in public life. For example, Democrats are slightly more likely to be Spectators, while Republicans are a bit more likely to be Connectors. And Mobilizers are the least likely to define their views as moderate.
One thing to keep in mind: This survey was conducted in fall 2025, with many questions asking whether people participated in certain ways in the past 12 months. Some political activities – like attending marches, contacting officials or volunteering for campaigns – are sensitive to the political environment of the moment.
For most respondents, the year in question included the 2024 presidential election. But in later months, Republicans controlled the White House and both houses of Congress – which may mean that Democrats were more likely to take action than they would have been during a Democratic administration.
Democrats and Republicans have similar patterns of engagement
There are only modest differences between Republicans and Democrats in terms of who falls into each of the four engagement groups.
For example, Connectors make up a slightly larger share of the Republican Party than the Democratic Party, while the reverse is true for Spectators.
Independents who lean toward either party are more likely than those who identify as Democrats or Republicans to be Outsiders. And independents who don’t lean toward either party are much more likely to be categorized as Outsiders, and only 2% are Mobilizers.
Refer to the key findings of this report for an analysis that looks at the political makeup of each engagement group.
About the engagement groups
This study sorts Americans into four groups based on their answers to 19 questions about how they engage (or don’t engage) in society through political activity, civic involvement, religious service attendance and attention to news. The four groups are:
Mobilizers: Doing it all. This group is the smallest and the most active across politics, civics, news and religion.
Connectors: Involved, but less political. This group is larger than the Mobilizers and also highly engaged in many ways – including joining groups and making donations – but much less likely than the Mobilizers to be heavily involved in political activities.
Spectators: Keeping an eye on things. They follow the news at high rates but are much less likely than the more engaged groups to participate directly in other ways.
Outsiders: Less involved in most ways. This group is less likely than others to report taking part in most of the activities we asked about – including voting, volunteering and following the news.
Outsiders and Spectators are more likely to identify as politically moderate
How do members of each engagement group vary in terms of how they describe their political ideology?
Outsiders (48%) and Spectators (43%) are more likely than Connectors (35%) or Mobilizers (26%) to describe their views as moderate.
But Mobilizers and Connectors differ from one another in their ideological balance. While identical shares of Mobilizers describe themselves as conservative (37%) and liberal (37%), Connectors include twice as many conservatives (42%) as liberals (21%).
Outsiders also lean conservative (27% conservative vs. 16% liberal), while Spectators include roughly equal shares of conservatives (27%) and liberals (26%).
How those in each engagement group say they voted in 2024
Voting patterns in the 2024 U.S. presidential election differed within each engagement group.
About half of Mobilizers (51%) say they voted for Kamala Harris, while 34% say they voted for Donald Trump. Connectors leaned modestly toward Trump over Harris (44% vs. 38%), as did Outsiders (22% vs. 15%).
Both Spectators and Outsiders were much less likely than Mobilizers or Connectors to report voting at all – about half of Spectators (49%) and a majority of Outsiders (56%) say they did not vote. (Whether or not someone reported voting in 2024 was also a factor in how they were sorted into these groups.)
Engagement in public life is linked with Americans’ views of politics, news
Americans who participate more in public life are more interested in politics – and more likely to have positive feelings about the state of their local communities.
In a new study, we sorted U.S. adults into four groups based on their answers to questions about how they engage in public life. The least active group, Outsiders, are less likely than other groups to say they have negative feelings about the state of the country.
Outsiders are also less likely to trust news organizations. But trust in the federal government is similarly low across all four groups – and engagement makes little difference.
Highly engaged Americans are more interested in politics
Americans who are more engaged in public life are consistently more likely to say they are interested in politics. This pattern aligns with decades of research noting political interest as a driving force behind civic engagement.
A majority of Mobilizers (58%) say they are extremely or very interested in politics. Fewer than half of Connectors (43%) say the same, as do an even smaller share of Spectators (28%).
Only 9% of Outsiders say they’re highly interested in politics. Among this least engaged group, a majority say they are either not too interested (35%) or not at all interested (23%) in politics.
This pattern holds across party lines:Within each engagement group, Democrats and Republicans (including independents who lean toward each party) report similar levels of interest in politics.
About the engagement groups
This study sorts Americans into four groups based on their answers to 19 questions about how they engage (or don’t engage) in society through political activity, civic involvement, religious service attendance and attention to news. The four groups are:
Mobilizers: Doing it all. This group is the smallest and the most active across politics, civics, news and religion.
Connectors: Involved, but less political. This group is larger than the Mobilizers and also highly engaged in many ways – including joining groups and making donations – but much less likely than the Mobilizers to be heavily involved in political activities.
Spectators: Keeping an eye on things. They follow the news at high rates but are much less likely than the more engaged groups to participate directly in other ways.
Outsiders: Less involved in most ways. This group is less likely than others to report taking part in most of the activities we asked about – including voting, volunteering and following the news.
How engagement relates to feelings about America and local communities
No matter how engaged they are, Americans are more likely to report feeling angry and fearful than hopeful or proud when thinking about the state of the country. But negative emotions about the state of local communities are much less common.
There are a few noticeable patterns in these questions based on how engaged people are:
The most engaged adults are the most likely to have negative feelings about the state of the country. Six-in-ten Mobilizers say they feel angry extremely often or often when thinking about the state of the country, compared with about half or fewer within all other groups. A similar pattern appears on the question of feeling fearful.
More engaged groups are also more inclined to say they have positive feelings about the state of their local community. For instance, 37% of Mobilizers and 36% of Connectors say they often or extremely often feel hopeful about their community, compared with 25% of Spectators and 22% of Outsiders. There is a similar pattern when it comes to feelings of pride.
Connectors – who are highly involved in civic and community life but less involved in politics – are less likely than Mobilizers to say they often feel angry or fearful about the state of their community and their country.
Americans have low trust in federal government regardless of engagement level
Trust in the federal government is low no matter how engaged people are. But trust in news and information sources differs by group, especially among Outsiders.
Trust in the federal government
Roughly one-in-five adults in each group say they think they can trust the federal government to do what is right just about always or most of the time.
Overall, Republicans are more likely than Democrats to express trust in the federal government – consistent with Republicans controlling the White House and Congress when the survey was conducted.
Trust in information sources
Unlike trust in the federal government, trust in the news media differs more clearly by level of engagement.
Majorities of Mobilizers (62%), Connectors (64%) and Spectators (57%) say they have at least some trust in the information they get from national news organizations. By comparison, fewer Outsiders (45%) say the same. About one‑in‑five Outsiders (18%) say they have no trust at all in national news organizations.
Trust in local news organizations is higher overall than trust in national news. But there is a similar pattern by engagement: Outsiders are less likely than other groups to say they have at least some trust in the information they get from local news organizations.
About half of Mobilizers (51%) and Spectators (48%) say they have at least some trust in the information they get from social media. Smaller shares of Connectors (32%) and Outsiders (28%) say the same.
As with other sources, Outsiders are most likely to say they have no trust at all in information from social media, with three-in-ten expressing this view.
However, Mobilizers and Outsiders – the two groups with the starkest differences in trust – have similar age compositions. This suggests that engagement, not just age, is associated with Outsiders’ lower trust.
Doubts about fairness of news media exist across all engagement groups
Levels of engagement do not always translate into major differences in how Americans view the news media. Across all engagement groups, for instance, many U.S. adults are skeptical that news organizations are fair.
Most Americans, regardless of how much they take part in civic life, say news organizations tend to favor one side when covering political and social issues. Connectors (82%) are modestly more likely than other groups to say this.
Across all engagement groups, Republicans are more likely than Democrats to say news organizations favor one side politically. Still, majorities of Democrats in every group also hold this view.
The four engagement groups also express similar views on the news media’s “watchdog” role. Across these groups, most Americans say that media criticism keeps political leaders from doing things that shouldn’t be done, although Outsiders are slightly less likely to express this view. The view that criticism keeps political leaders from doing their jobs is much less common in all four groups.
Highly engaged Americans know more about politics
Americans who are highly engaged in public life are more likely than those who are less engaged to correctly answer several factual questions about politics.
Meanwhile, those who are less engaged are the most likely across the board to say they are unsure about the answers to these questions, including which political parties and leaders are currently in office.
To examine what U.S. adults know about American politics, we asked four factual questions about current issues, figures and institutions:
Which political party has majority control in the U.S. Senate? (Republican Party)
Which political party has majority control in the U.S. House of Representatives? (Republican Party)
What position is held by [the name of the governor in your state]? (Governor; D.C. residents were asked about their mayor)
What term describes a U.S. government tax on imported goods? (Tariff)
These quiz-like questions are not designed to capture the entirety of what people know about politics, but these types of questions have been shown in studies to serve as a good proxy for broader political knowledge.
How engagement relates to knowledge about politics
On each of the four questions, most Americans answer correctly. Almost three-quarters know that the Republican Party currently has majority control of both the House and the Senate (73% each). And even larger shares recognize the name of their state’s governor (80%) or know that a U.S. government tax on imported goods is called a tariff (86%).
Our new study also sorted Americans into four groups based on their answers to questions about engagement in public life.
The least engaged groupis significantly less likely to answer each question correctly – although majorities still get these answers correct. For example, 59% of Outsiders know that Republicans currently have majority control of the U.S. Senate, and 58% know the same about the U.S. House of Representatives. About seven-in-ten adults in this group (71%) recognize the name of their state’s governor, while 78% know the definition of a tariff.
Gaps between groups are largely due to differences in the percentages of people who say they are not sure about the answer – and not differences in people selecting the wrong answer. On all four questions, no more than 10% in each of the four groups selected an incorrect response.
The differences across engagement groups are even more evident when looking at all four questions together. Half of Outsiders (50%) said they are not sure on at least one question, compared with 15% of Mobilizers and 16% of Connectors. Likewise, only 41% of Outsiders were able to correctly answer all four questions, versus majorities of Connectors (72%) and Mobilizers (68%).
Age, education and political involvement are also important factors intertwined with both engagement and knowledge about politics. But our analysis shows that engagement is linked with knowledge even when controlling for these other factors.
About the engagement groups
This study sorts Americans into four groups based on their answers to 19 questions about how they engage (or don’t engage) in society through political activity, civic involvement, religious service attendance and attention to news. The four groups are:
Mobilizers: Doing it all. This group is the smallest and the most active across politics, civics, news and religion.
Connectors: Involved, but less political. This group is larger than the Mobilizers and also highly engaged in many ways – including joining groups and making donations – but much less likely than the Mobilizers to be heavily involved in political activities.
Spectators: Keeping an eye on things. They follow the news at high rates but are much less likely than the more engaged groups to participate directly in other ways.
Outsiders: Less involved in most ways. This group is less likely than others to report taking part in most of the activities we asked about – including voting, volunteering and following the news.
Education is closely related to levels of knowledge about politics. Across all four engagement groups, Americans with college degrees tend to be more likely to correctly answer all four factual questions.
For example, 67% of Spectators with a college degree got all four questions correct. That compares with 46% of Spectators with only a high school diploma.
Political knowledge gaps by age
Older adults in each engagement group are the most likely to answer all four questions correctly, with similar patterns by age apparent across the four groups.
For example, 83% of Mobilizers ages 50 and older answered all four questions correctly, compared with 49% of Mobilizers under 30.
The gender gap in responses to political knowledge questions
Women were generally more likely than men to say they were unsure about the answers to the factual political questions we asked. This pattern matches long-standing research showing that men are more likely to guess the answer to these kinds of factual questions rather than respond that they don’t know.
But there is no significant gap among the most engaged group: Roughly the same share of women and men who are Mobilizers responded “not sure” to one or more knowledge question (15% and 13%, respectively).
By contrast, among Outsiders, 59% of women said they were not sure on one or more of the four questions, versus 38% of men.
Elisa Shearer, Senior Researcher Luxuan Wang, Research Associate Katerina Eva Matsa, Director, News and Information Research Michael Lipka, Associate Director, News and Information Research Benjamin Toff, Visiting Principal Researcher Kirsten Eddy, Senior Researcher
Research Team
Emily Tomasik, Research Analyst Naomi Forman-Katz, Research Analyst Christopher St. Aubin, Research Analyst Sawyer Reed, Research Assistant Joanne Haner, Research Assistant Jacob Liedke, Former Research Analyst
Editorial and Graphic Design
Peter Bell, Associate Director, Design and Production Sharon McGill, Information Graphics Designer David Kent, Senior Editorial Specialist Beshay Sakla, Associate Digital Producer Janakee Chavda, Associate Digital Producer
Communications and Web Publishing
David Maas, Communications Manager Julia O’Hanlon, Communications Manager Ashley Loprete, Communications Associate Sogand Afkari, Communications Manager Justine Coleman, Content Strategy Analyst Talia Price, Former Interim Communications Manager
In addition, the project benefited greatly from the administrative work of Meera Ramshankar and the guidance of members of the Pew Research Center Survey Methods, Internet & Technology, Politics and Religion teams, including Ashley Amaya, Scott Keeter, Andrew Mercer, Colleen McClain, Eugenie Park, Monica Anderson, Andrew Daniller, Gabe Borelli, Jocelyn Kiley, Chip Rotolo, Greg Smith, Courtney Kennedy and Neha Sahgal.
SSRS conducted the Cross-Sectional Engagement Survey for Pew Research Center using address-based sampling and a multimode protocol. The survey was fielded from July 9 to Dec. 5, 2025. Participants were first mailed an invitation to complete an online survey. A paper survey was later mailed to those who did not respond. Additionally, the mailings provided participants a toll-free number to call if they preferred to take the survey over the phone with a live interviewer. In total, 2,705 respondents completed the survey online, 2,500 respondents completed the paper survey, and 188 respondents completed the survey over the phone (total n=5,393). The survey was administered in English and Spanish. The AAPOR Response Rate 1 was 28%.
Sample definition
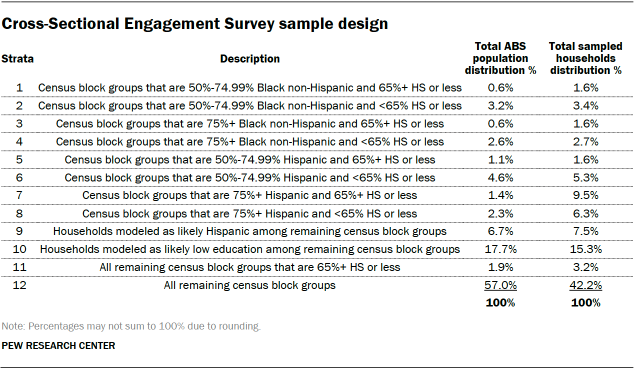
The sample was drawn from the U.S. Postal Service Computerized Delivery Sequence File and was provided by MSG (Marketing Systems Group). Occupied residential addresses (including “drop points”) in all U.S. states (including Alaska and Hawaii) and the District of Columbia had a nonzero chance of selection. The draw was a national, stratified random sample, with differential probabilities of selection across the mutually exclusive strata. SSRS designed the sample plan as shown in the table above.
Mailing protocol
SSRS sent initial mailings in a 9-by-12-inch window envelope via first-class mail to the 20,751 sampled addresses. These packets included $1 bills (visible from the outside of the envelope) and a letter that asked a member of the household to complete the survey. The letter provided a URL for the online survey; a toll-free call-in number; a password to enter on the online survey’s landing page, or tell the telephone interviewers if they chose to call in; and a FAQ section printed on the reverse side. If two or more adults were in the household, the letter asked the adult with the next birthday to complete the survey. Two experiments were also embedded in this mailing. The first experiment was to test the effect of QR codes on response rates. As such, 65% of the letters included a QR code and instructions on how to use it. The second experiment was to test the effect of the cash incentive on response rates. As such, 65% of the letters included two $1 bills, and the remaining 35% included one $1 bill. The two experiments were fully and randomly crossed across all sampled addresses. Nonresponding households, regardless of experimental condition, were later sent a reminder postcard and then a reminder letter via first-class mail.
After the web portion of the data collection period had ended, SSRS sent nonresponding households with a deliverable address a 9-by-12-inch Priority Mail window envelope. The Priority envelope contained a letter with a FAQ section printed on the reverse side, a visible $5 bill, a paper version of the survey and a postage-paid return envelope. The paper survey was one 11-by-17-inch page folded booklet-style. The within-household selection instructions were identical to those used in the earlier online survey request. The same households were later sent a second envelope containing another copy of the paper questionnaire by first-class mail.
The initial mailing was sent out in two separate launches: soft launch and full launch. The soft launch made up 5% of the sample and was sent out several days earlier than the full launch. The full launch consisted of the remaining sample.
Households in Hispanic strata, and additional sample records predicted to likely be Hispanic, received all materials in English and Spanish. All other households received materials in English only. Those who completed the survey were sent a $10 post-paid incentive.
Questionnaire development and testing
Pew Research Center developed the questionnaire in consultation with SSRS. The online questionnaire was tested on both desktop and mobile devices. The test data was analyzed to ensure the logic and randomizations were working as intended before the survey was launched.
Weighting
The survey was weighted to support reliable inference from the sample to the target population of U.S. adults. The weight was created using a multistep process that includes a base weight adjusting for differential probabilities of selection and a raking calibration that aligns the survey with the population benchmarks. The process starts with the base weight, which accounted for the probability of selection of the address from the U.S. Postal Service Computerized Delivery Sequence File frame, as well as the number of adults living in the household, and incorporated an adaptive mode adjustment for cases that responded in an offline mode.
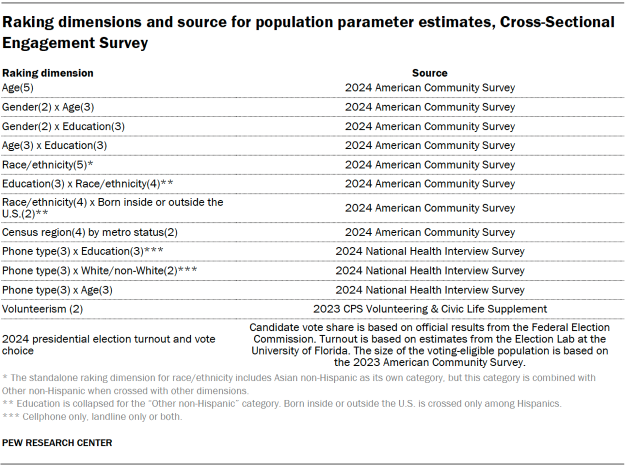
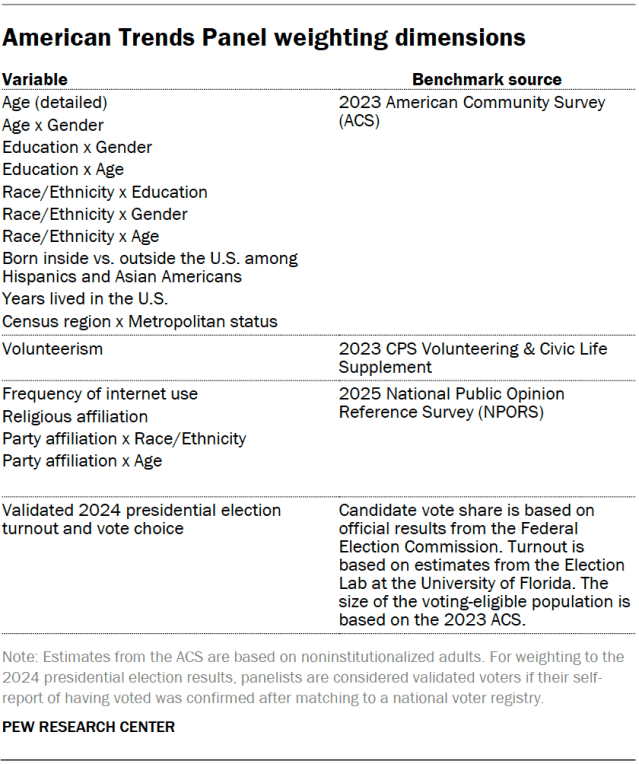
Then the base weights are calibrated to population benchmarks using raking, or iterative proportional fitting. The raking dimensions and the source for the population parameter estimates are reported in the table below. All raking targets are based on the noninstitutionalized U.S. adult population (ages 18 and older). These weights are trimmed at the 1st and 99th percentiles to reduce the loss in precision stemming from variance in the weights.
Design effect and margin of error
Weighting and survey design features that depart from simple random sampling tend to result in an increase in the variance of survey estimates. This increase, known as the design effect, or “deff,” should be incorporated into the margin of error, standard errors and tests of statistical significance. The overall design effect for a survey is commonly approximated as 1 plus the squared coefficient of variation of the weights.
For this survey, the margin of error (half-width of the 95% confidence interval) incorporating the design effect for full sample estimates at 50% is plus or minus 1.9 percentage points. Estimates based on subgroups will have larger margins of error. It is important to remember that random sampling error is only one possible source of error in a survey estimate. Other sources, such as question wording and reporting inaccuracy, may contribute additional error. A summary of the weights and their associated design effect is reported in the table below.
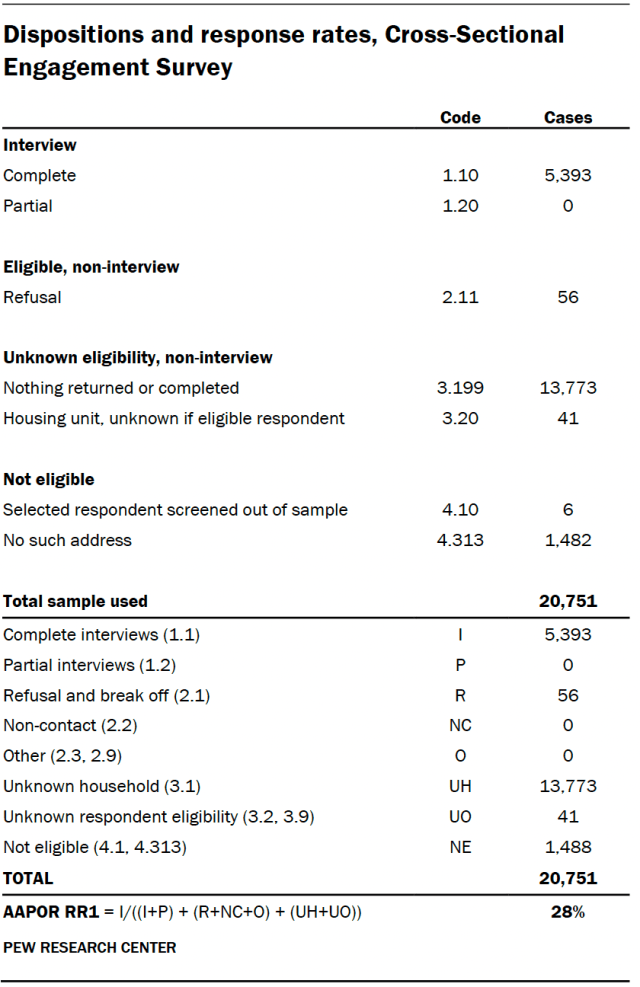
Dispositions
The table below reports the disposition of all sampled households for the survey.
The American Trends Panel survey methodology
Overview
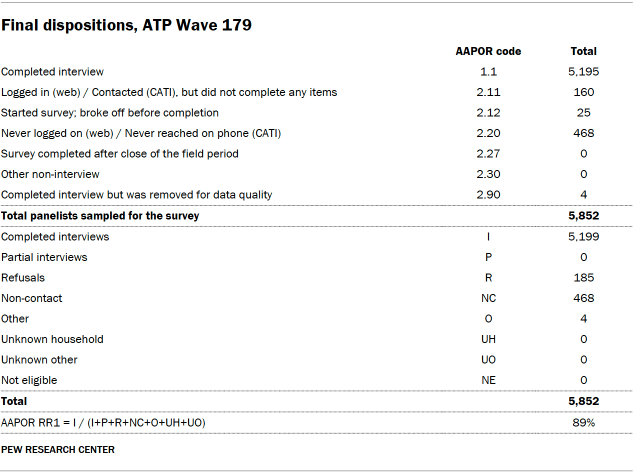
Data in “How engagement is linked with Americans’ views of politics and news” and “How engagement relates to knowledge about politics” comes from Wave 179 of the American Trends Panel (ATP), Pew Research Center’s nationally representative panel of randomly selected U.S. adults. The survey was conducted from Sept. 8 to Sept. 14, 2025. A total of 5,195 panelists responded out of 5,852 who were sampled, for a survey-level response rate of 89%.
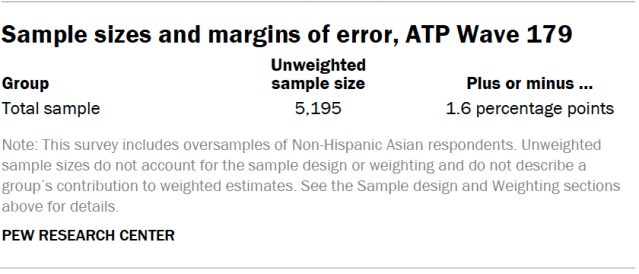
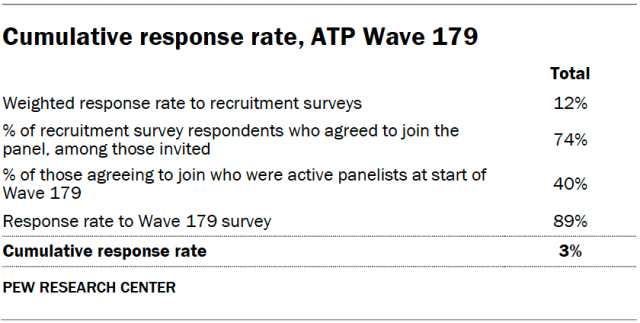
The cumulative response rate accounting for nonresponse to the recruitment surveys and attrition is 3%. The break-off rate among panelists who logged on to the survey and completed at least one item is less than 1%. The margin of sampling error for the full sample of 5,195 respondents is plus or minus 1.6 percentage points.
The survey includes an oversample of non-Hispanic Asian adults in order to provide more precise estimates of the opinions and experiences of this smaller demographic subgroup. These oversampled groups are weighted back to reflect their correct proportions in the population.
SSRS conducted the survey for Pew Research Center via online (n=4,986) and live telephone (n=209) interviewing. Interviews were conducted in both English and Spanish.
Since 2018, the ATP has used address-based sampling (ABS) for recruitment. A study cover letter and a pre-incentive are mailed to a stratified, random sample of households selected from the U.S. Postal Service’s Computerized Delivery Sequence File. This Postal Service file has been estimated to cover 90% to 98% of the population.1 Within each sampled household, the adult with the next birthday is selected to participate. Other details of the ABS recruitment protocol have changed over time but are available upon request.2 Prior to 2018, the ATP was recruited using landline and cellphone random-digit-dial surveys administered in English and Spanish.
A national sample of U.S. adults has been recruited to the ATP approximately once per year since 2014. In some years, the recruitment has included additional efforts (known as an “oversample”) to improve the accuracy of data for underrepresented groups. For example, Hispanic adults, Black adults and Asian adults were oversampled in 2019, 2022 and 2023, respectively.
Sample design
The overall target population for this survey was noninstitutionalized persons ages 18 and older living in the United States. It featured a stratified random sample from the ATP in which non-Hispanic Asian adults were selected with certainty. The remaining panelists were sampled at rates designed to ensure that the share of respondents in each stratum is proportional to its share of the U.S. adult population to the greatest extent possible. Respondent weights are adjusted to account for differential probabilities of selection as described in the Weighting section below.
Questionnaire development and testing
The questionnaire was developed by Pew Research Center in consultation with SSRS. The web program used for online respondents was rigorously tested on both PC and mobile devices by the SSRS project team and Pew Research Center researchers. The SSRS project team also populated test data that was analyzed in SPSS to ensure the logic and randomizations were working as intended before launching the survey.
Incentives
All respondents were offered a post-paid incentive for their participation. Respondents could choose to receive the post-paid incentive in the form of a check or gift code to Amazon.com, Target.com or Walmart.com. Incentive amounts ranged from $5 to $15 depending on whether the respondent belongs to a part of the population that is harder or easier to reach. Differential incentive amounts were designed to increase panel survey participation among groups that traditionally have low survey response propensities.
Data collection protocol
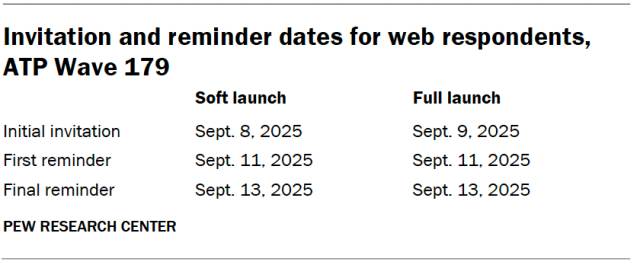
The data collection field period for this survey was Sept. 8 to Sept. 14, 2025. Surveys were conducted via self-administered web survey or by live telephone interviewing. For panelists who take surveys online:3 Postcard notifications were mailed to a subset on Sept. 8.4 Survey invitations were sent out in two separate launches: soft launch and full launch. Sixty panelists were included in the soft launch, which began with an initial invitation sent on Sept. 8. All remaining English- and Spanish-speaking sampled online panelists were included in the full launch and were sent an invitation on Sept. 9.
Panelists participating online were sent an email invitation and up to two email reminders if they did not respond to the survey. ATP panelists who consented to SMS messages were sent an SMS invitation with a link to the survey and up to two SMS reminders.
For panelists who take surveys over the phone with a live interviewer: Prenotification postcards were mailed on Sept. 5. Soft launch took place on Sept. 8 and involved dialing until a total of seven interviews had been completed. All remaining English- and Spanish-speaking sampled phone panelists’ numbers were dialed throughout the remaining field period. Panelists who take surveys via phone can receive up to six calls from trained SSRS interviewers.
Data quality checks
To ensure high-quality data, Center researchers performed data quality checks to identify any respondents showing patterns of satisficing. This includes checking for whether respondents left questions blank at very high rates or always selected the first or last answer presented. As a result of this checking, four ATP respondents were removed from the survey dataset prior to weighting and analysis.
Weighting
The ATP data is weighted in a process that accounts for multiple stages of sampling and nonresponse that occur at different points in the panel survey process. First, each panelist begins with a base weight that reflects their probability of recruitment into the panel. These weights are then calibrated to align with the population benchmarks in the accompanying table to correct for nonresponse to recruitment surveys and panel attrition. If only a subsample of panelists was invited to participate in the wave, this weight is adjusted to account for any differential probabilities of selection.
Among the panelists who completed the survey, this weight is then calibrated again to align with the population benchmarks identified in the accompanying table and trimmed at the 1st and 99th percentiles to reduce the loss in precision stemming from variance in the weights. Sampling errors and tests of statistical significance take into account the effect of weighting.
The following table shows the unweighted sample sizes and the error attributable to sampling that would be expected at the 95% level of confidence for different groups in the survey.
Sample sizes and sampling errors for other subgroups are available upon request. In addition to sampling error, one should bear in mind that question wording and practical difficulties in conducting surveys can introduce error or bias into the findings of opinion polls.
Dispositions and response rates
Engagement group creation and analysis
Drawing on data from the 2025 Cross-Sectional Engagement Survey, we used cluster analysis to sort Americans into four engagement groups based on the ways they take part in public life. This approach identifies people who share similar engagement patterns across politics, religion, news consumption and other civic activities.
Group assignment was based on respondents’ answers to 19 questions about their participation in these areas. The survey also includes questions on attitudes, demographics and identities, but the engagement cluster analysis only used items measuring behaviors. The items selected for inclusion in the clustering were chosen based on extensive testing to find the model that fit the data best and produced groups that were substantively meaningful. The table below lists the items used to create the engagement groups. The analysis considers all 19 behaviors together and treats each item as equally important.
Questions used in the engagement cluster analysis
Question
Response options
VOL12_CPS: In the past 12 months, did you spend any time volunteering for any organization or association? (This includes activities you may do infrequently or for children’s schools or youth organizations.)
1 Yes 2 No
GROUPS_CPS: In the past 12 months, did you belong to any groups, organizations, or associations?
1 Yes 2 No
LOCAL_MTG: In the past 12 months, have you attended a local government meeting such as a city council or school board meeting, either in person or online?
1 Yes 2 No
NEWS_LEVEL_NAT: How closely do you follow national news?
1 Very closely 2 Somewhat closely 3 Not very closely 4 Not at all closely
NEWS_LEVEL_LOC: How closely do you follow local news?
1 Very closely 2 Somewhat closely 3 Not very closely 4 Not at all closely
TALKNEWS: How often do you discuss news and current events with others, whether in person, online, or over the phone?
1 Nearly every day 2 A few times a week 3 A few times a month 4 Less often
NEWSONLINE: In the past 7 days, have you done any of the following activities online (on a website, social media, or a messaging app)?
LIKE: Liked or saved posts about news PUB: Publicly posted, shared, or commented about news PRIV: Privately chatted about or shared news
1 Yes 2 No
DON1_CPS: In the past 12 months, did you give money or possessions with a combined value of more than $25 to a political organization, party, or campaign?
1 Yes 2 No
DON2_CPS: In the past 12 months, did you give money or possessions with a combined value of more than $25 to a non-political group or organization, such as a charity, school, or religious organization?
1 Yes 2 No
CIVENG_POST: Here’s a list of activities some people do and others do not. Please indicate if you have done each of the following activities over the past 12 months.
VOLUNT: Worked or volunteered for a political party, candidate, or campaign DISPL: Displayed a sign or bumper-sticker or wore something to show your support for a political cause, campaign, or issue SMMOD: Used your social media bio or profile picture to show support for a cause, issue, or political candidate LETTER: Contacted any elected official MARCH: Participated in any demonstrations, protests, marches, or political rallies
1 Yes 2 No
ATTENDPER: Aside from weddings and funerals, how often do you attend religious services in person?
1 More than once a week 2 Once a week 3 Once or twice a month 4 A few times a year 5 Seldom 6 Never
ATTENDONLINE2: In general, how often do you watch or participate in religious services online or on TV?
1 More than once a week 2 Once a week 3 Once or twice a month 4 A few times a year 5 Seldom 6 Never
VOTED2024B: In the 2024 presidential election between Kamala Harris and Donald Trump, did things come up that kept you from voting, or did you happen to vote?
1 Voted 2 Did not vote
Source: Survey of U.S. adults conducted July 9-Dec. 5, 2025.
PEW RESEARCH CENTER
The specific statistical technique used to calculate group membership is weighted clustering around medoids (using the WeightedCluster package version 1.8-1 in R version 4.5.2). The k-medoids algorithm assigns respondents in the survey to groups characterized by differing patterns of responses. Prior Pew Research Center typologies used the same method or a closely related method, such as cluster analysis via the k-means algorithm, to identify groups.
Decisions made at different points in the analysis can have a dramatic impact on the ultimate results of any data partitioning exercise. Different solutions are possible using the same data depending on the algorithm used for partitioning, the ways in which the variables are coded, the number of clusters, and even the order in which respondents are sorted. Refer to “How we measured Americans’ engagement in public life” for more details.
Coding of input variables
Input variables used for constructing the clusters were coded using their original response formats. Binary items were treated as binary, and scaled items were kept on their original scales. We did not standardize variables, as the clustering relied on Gower’s distance, which is designed to accommodate mixed data types when computing distances between respondents.
Data cleaning
Prior to clustering, we conducted data quality checks to assess item nonresponse across input variables. We excluded 13 respondents from the cluster analysis who did not offer answers to nine or more of the 19 items used to create the engagement groups, as their limited data did not allow for reliable classification. Among the remaining respondents (n=5,380, unweighted), there was a small amount (ranging from nine to 96 cases) of item nonresponse in the measures used. We did not impute missing values for these cases, as Gower’s distance calculates distances based on the available responses for each pair of respondents. This approach allowed us to retain respondents with partial item nonresponse while minimizing the influence of missing data on the clustering results.
Selecting the number of groups
Solutions with different numbers of groups were examined. The results presented in this report were chosen for their effectiveness in producing cohesive groups that were sufficiently distinct from one another and large enough in size to be analytically practical and substantively meaningful.
Other methodological decisions
To address the potential sensitivity of cluster analysis to the order in which cases are entered, each model was run several times. The k-medoids algorithm was robust to different initial conditions and consistently returned the same results even with different random starts.
While each model differed somewhat from the others, all of them shared certain key features. The final model selected to produce the engagement groups was judged to be strong from a statistical point of view, most persuasive from a substantive point of view, and representative of the general patterns seen across the various models run.
Projecting engagement clusters to ATP Wave 179
We also looked at how engagement groups differ in attitudes (e.g., feelings about the country, trust in news organizations) and civic knowledge. Those questions were not asked in the 2025 Cross-Sectional Engagement Survey due to limited space. However, they were included in American Trends Panel (ATP) Wave 179, which also asked the same questions about engagement behaviors.
To connect the two surveys for further analysis, we assigned ATP respondents to the derived engagement groups based on how similar their behavior patterns were to those of the most typical respondents in each engagement group from the cross‑sectional survey. We coded the behavioral variables in ATP Wave 179 in the same way and again used Gower’s distance. This approach lets us analyze attitudes and knowledge using ATP data while keeping the engagement groups rooted in the cross-sectional survey. The ATP results were broadly similar to the cross-sectional survey results in both engagement patterns and demographics.



 Mobilizers


 Connectors

 Spectators

 Outsiders