Pew-Knight Initiative

FOR RELEASE AUGUST 29, 2024

Americans’ Experiences With Local Crime News

Most say they are interested in several types of local crime coverage, but far fewer say it’s easy to find

BY Kirsten Eddy, Michael Lipka, Katerina Eva Matsa, Naomi Forman-Katz, Sarah Naseer, Christopher St. Aubin and Elisa Shearer

FOR MEDIA OR OTHER INQUIRIES:

Communications Department
202.419.4372
www.pewresearch.org

RECOMMENDED CITATION

Pew Research Center, August 2024, "Americans’ Experiences With Local Crime News"

About the Pew-Knight Initiative

The Pew-Knight Initiative supports new research on how Americans absorb civic information, form beliefs and identities, and engage in their communities. Pew Research Center is a nonpartisan, nonadvocacy fact tank that informs the public about the issues, attitudes and trends shaping the world. Knight Foundation is a social investor committed to supporting informed and engaged communities.

© Pew Research Center 2026

Table of contents

  • About the Pew-Knight Initiative
  • Americans’ Experiences With Local Crime News
  • 1. Sources of local crime news
  • 2. Types of local crime news
  • 3. Quality of local crime news
  • 4. How Americans respond to local crime news
  • Acknowledgments
  • Methodology

Americans’ Experiences With Local Crime News

Most say they are interested in several types of local crime coverage, but far fewer say it’s easy to find

How we did this

Pew Research Center conducted this study to better understand how U.S. adults get local crime news and information. It is the third report in a series focused on local news.

The survey of 5,146 U.S. adults was conducted from Jan. 22 to 28, 2024. Everyone who completed the survey is a member of the Center’s American Trends Panel (ATP), an online survey panel that is recruited through national, random sampling of residential addresses. This way nearly all U.S. adults have a chance of selection. The survey is weighted to be representative of the U.S. adult population by gender, race, ethnicity, partisan affiliation, education and other categories. Read more about the ATP’s methodology.

Refer to the topline for the questions used for this survey, along with responses, and to the methodology for more details.

This is a Pew Research Center report from the Pew-Knight Initiative, a research program funded jointly by The Pew Charitable Trusts and the John S. and James L. Knight Foundation. Find related reports online at https://alpha.pewresearch.org/pewresearch-org/pew-knight/.

This is the third report in a series focused on local news. Read our first report, “Americans’ Changing Relationship With Local News,” and our second report, “How Americans Get Local Political News.”

Crime has long been a major area of focus in local news coverage. In fact, more Americans get news and information about crime than any other local topic except the weather. But how they get that news – and how they react to it – varies widely, according to a new Pew Research Center survey.

Among the key findings:

Around three-quarters of U.S. adults (77%) at least sometimes get news and information about local crime. This includes 34% who do so often.
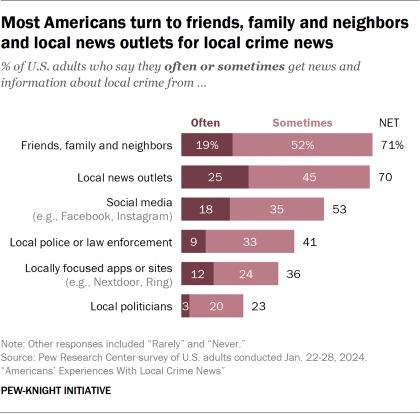
Bar charts showing Most Americans turn to friends, family and neighbors and local news outlets for local crime news

Americans are about as likely to get information about crime from people they know as they are to get it from local news outlets. About seven-in-ten U.S. adults (71%) often or sometimes get news and information about local crime from friends, family and neighbors. A nearly identical share (70%) get this kind of news and information from local news outlets.

Like we find with several local news topics, relatively few Americans are highly satisfied with the local crime news they get. Among those who get local crime news, one-third say they are extremely or very satisfied with the quality of this news. About half (48%) say they are somewhat satisfied, and 18% say they are not too or not at all satisfied.

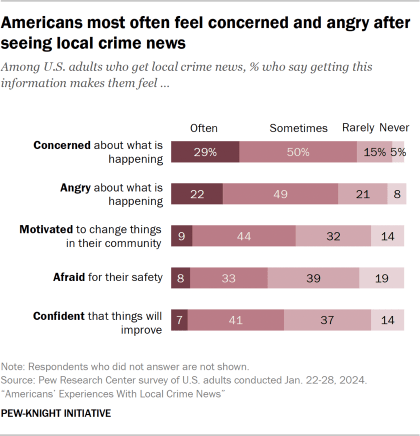
Many people experience negative emotions after consuming local crime news. Most Americans who get news about local crime say they at least sometimes feel concerned or angry about what is happening after seeing or hearing about it.

Jump to more information on how Americans respond to local crime news.

There is a clear link between the amount of local crime news people take in and their own sense of security. Americans who consume local crime news most often (regardless of the source) also are the most likely to say they are concerned about crime in their community affecting them or their family.
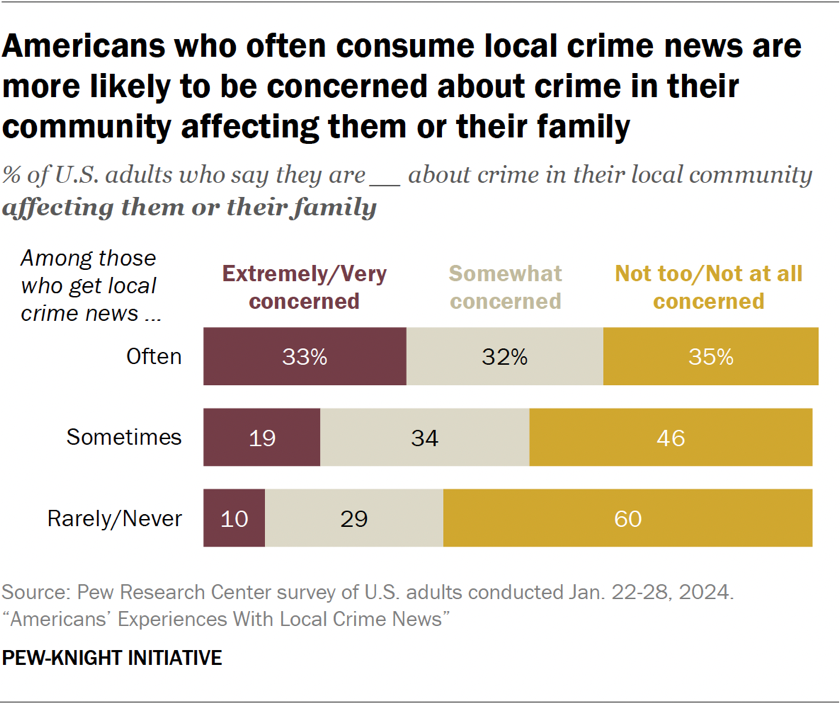
Bar chart showing Americans who often consume local crime news are more likely to be concerned about crime in their community affecting them or their family

Among U.S. adults who say they often get news about local crime, 33% say they are extremely or very concerned in this way. Smaller shares among those who sometimes (19%) or rarely or never (10%) consume local crime news say they are highly concerned about crime’s impact on them or their family.

This does not necessarily mean that local crime news is always making people worried. It could also be that people who were already concerned about local crime are more likely to follow news about the topic more often.

People’s perceptions of crime also do not always align with actual crime statistics. For instance, Americans tend to believe crime has increased in the United States, even when official data shows it is down.

Perceptions of crime also vary by political party: Republicans are more likely than Democrats to view violent crime as a very big problem in the country as a whole. But there is little difference between the parties’ supporters in how they consume information about local crime and how concerned they are about it.

Democrats (including independents who lean Democratic) are more likely than Republicans and GOP leaners to say various news sources exaggerate the amount of crime in their area and are unfair to some people based on their race or ethnicity. But people aligned with both parties get local crime news at about the same frequency and turn to many of the same types of sources. And virtually identical shares in each party say they are concerned about local crime affecting them or their family.

These findings are based on a recent Pew Research Center survey designed to take a detailed look at Americans’ experiences with and views toward local crime news. This report, the third in a series focused on local news, is part of the Pew-Knight Initiative, a research program funded jointly by The Pew Charitable Trusts and the John S. and James L. Knight Foundation. The first report looked at local news consumption in general, and the second examined news about local government and politics.

The remainder of this overview discusses more key findings from the survey. Four additional sections include greater detail about four aspects of local crime news:

  • Sources of crime news
  • Types of crime news
  • How Americans view the quality of information on the topic
  • How Americans respond to the local crime news they consume

What Americans see – and want to see – in local crime news

About a third or more of Americans see news about property crime (37%), drug-related crime (33%) and violent crime (32%) at least weekly. People report seeing news about these different types of crimes at similar rates even though violent crime is far less common than property crime. Fewer people (11%) see news about white-collar crime (e.g., corporate fraud or political corruption) at least weekly.

Pie chart and bar chart showing most Americans are interested in various aspects of local crime news; fewer find it easy to stay informed

The survey also asked whether Americans are interested in a variety of types of crime news, including details of crimes, tips about how to stay safe, and broader patterns in local crime. About three-quarters or more of U.S. adults say they are at least somewhat interested in each of the five topics we asked about. But relatively few of those who are interested say it is easy to find news and information about each topic.

For instance, most Americans (85%) say they are at least somewhat interested in what local officials are doing to address crime. But among those who are interested in this element of crime coverage, only 22% say it is at least somewhat easy to find this information, while almost twice as many (41%) say it’s very or somewhat hard to find.

Jump to more information on types of local crime news.

Sources of local crime news, and how local TV news consumers stand out

Americans get local crime news from a variety of different sources. The most common are friends, family and neighbors and local news outlets: About seven-in-ten U.S. adults often or sometimes get information about local crime from each source (71% and 70%, respectively).
Bar chart showing Americans have no single go-to source for information about a local crime

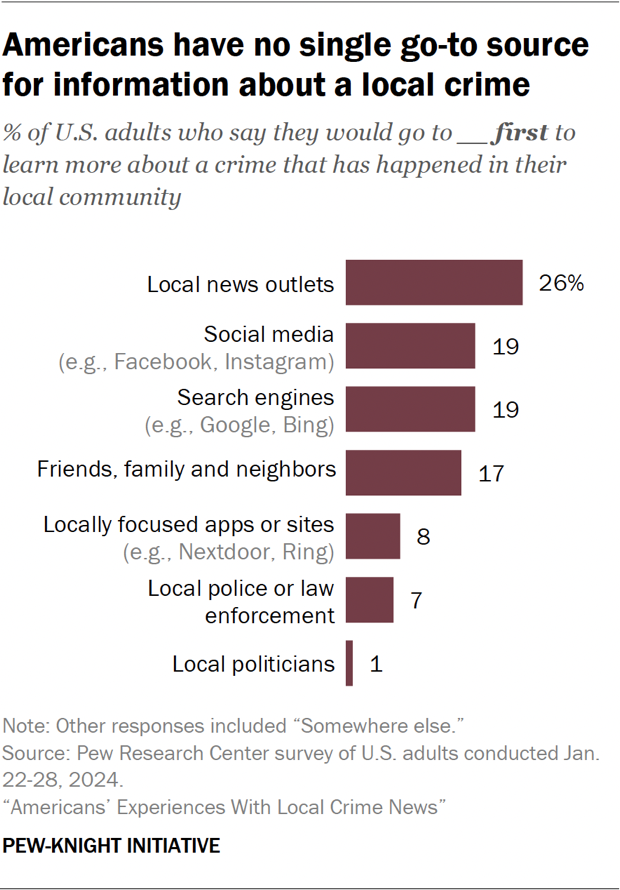
But when asked where they would go first for more information if a crime happened in their community, Americans do not coalesce around a single dominant source.

About a quarter (26%) say they would first go to local news outlets. Slightly smaller shares would go to social media (19%), search engines (19%), or friends, family and neighbors (17%). Others turn to local apps like Nextdoor or Ring (8%) or local police or law enforcement (7%).

Jump to more information on sources of local crime news.

Our survey did not measure what types of local news outlets people turn to for local crime news specifically. But the survey did ask what platform Americans prefer for getting local news and information in general.

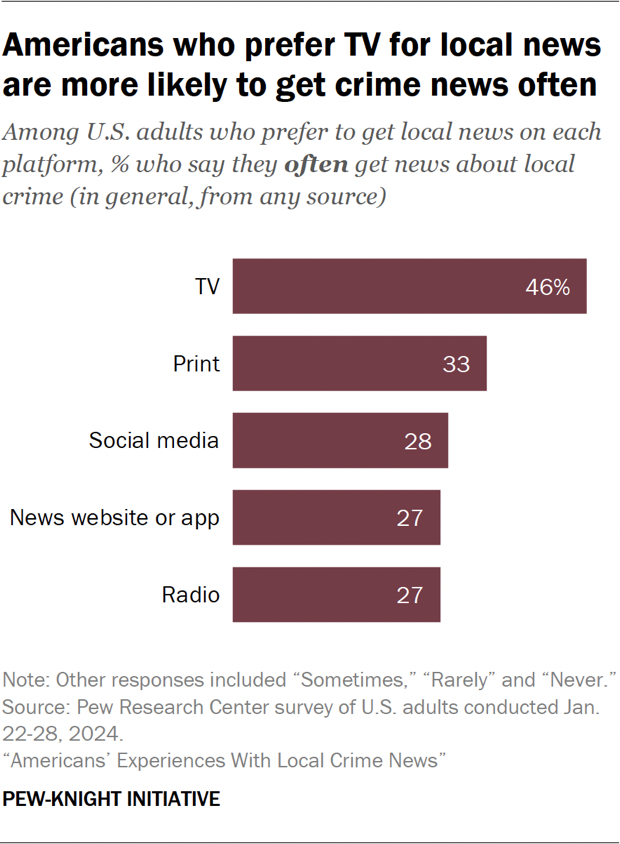
Americans who say they prefer to get local news on TV stand out in some ways when it comes to crime news. These local TV news consumers report getting local crime news more often than those who prefer other platforms, but they are generally less likely to say that local news outlets exaggerate the amount of crime in their community. They also are more likely to say they are satisfied with the quality of local crime news they get.
Bar chart showing Americans who prefer TV for local news are more likely to get crime news often

Nearly half of those who prefer TV for local news (46%) say they often get news and information about local crime from any source, higher than those who prefer any other platform. This group also is more likely than those who prefer any other platform to report seeing news about local violent crime about daily.

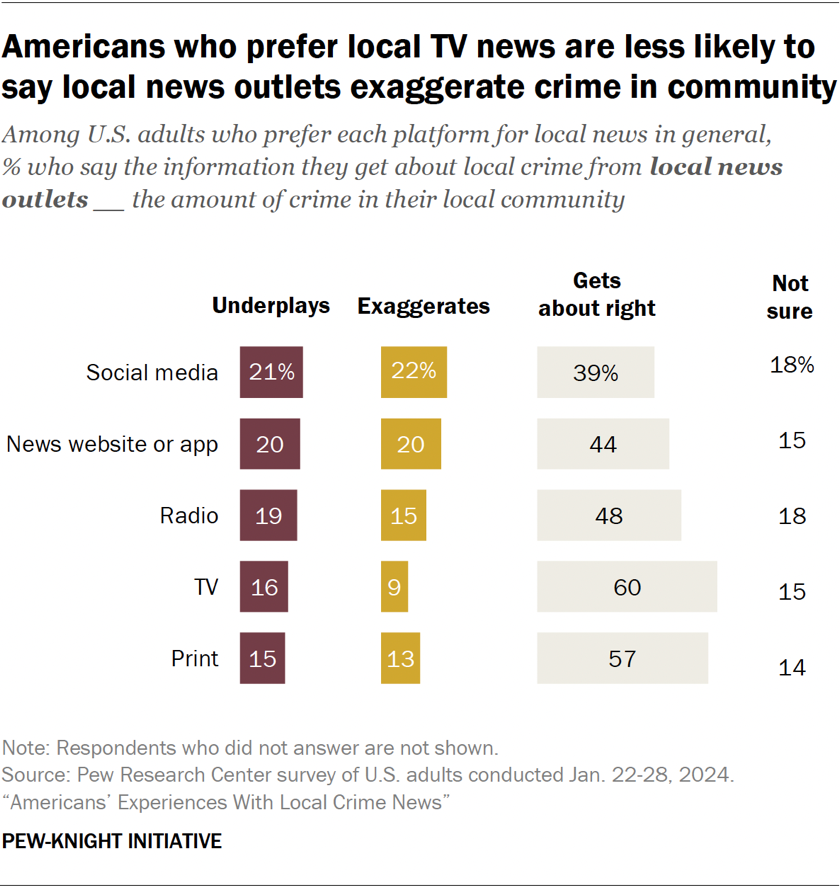
That said, Americans who prefer TV for local news are not especially likely to say that local news outlets exaggerate the amount of crime in their local community. In fact, just 9% of these adults take this view, while a slightly larger share (16%) say local news outlets underplay the amount of crime in their area and 60% say they get it about right.

Those who prefer social media (22%) or news websites or apps (20%) for local news are more likely to say that local news outlets exaggerate the amount of crime in their community.

Americans’ varying perceptions of local crime news

Among Americans who get news about local crime, just a third are extremely or very satisfied with its quality.

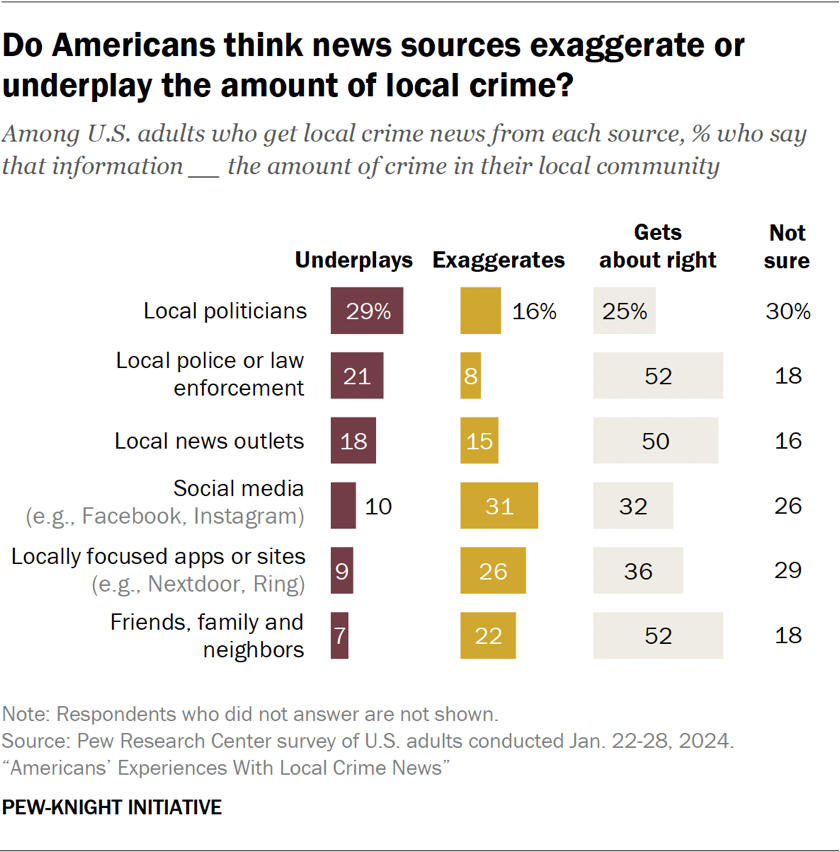
However, views of crime news vary depending on where people are getting it. Americans differentiate between sources of crime news – such as local news outlets, social media, and family, friends and neighbors – when it comes to how accurate, exaggerated or fair they believe the information is:
Bar chart chart showing whether Americans think news sources exaggerate or underplay the amount of local crime
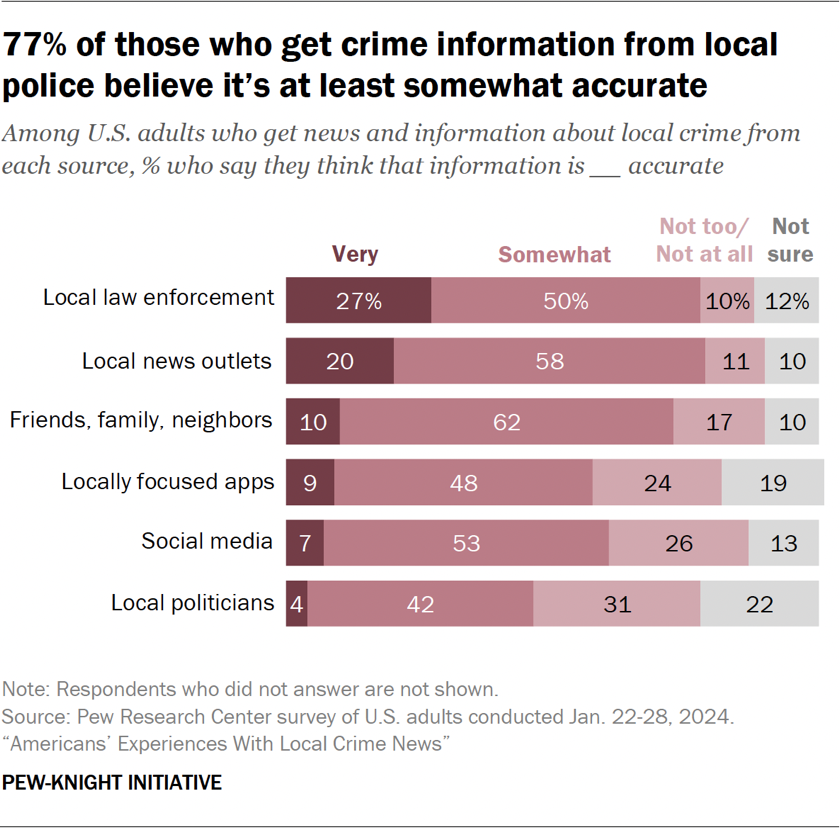
  • U.S. adults who get crime news from local news outlets (79%), local law enforcement (77%), and friends, family and neighbors (72%) are more likely than those who get it from other sources to say the information is at least somewhat accurate. The higher level of confidence in information from local law enforcement than local politicians mirrors a broader pattern of higher trust in police officers than elected officials.
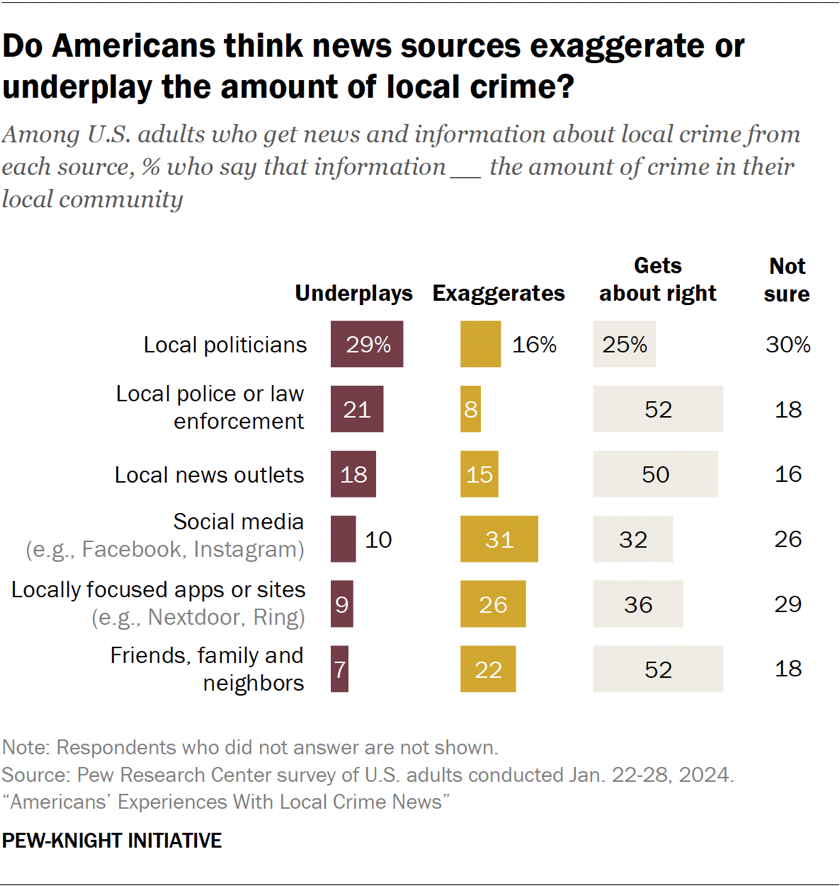
  • Those who get local crime news from more social sources (social media, locally focused apps, or friends, family and neighbors) are more likely to say such news exaggerates rather than underplays the amount of crime in their community.
  • Those who get local crime information from official sources (local law enforcement and local politicians), meanwhile, are more likely to say it underplays rather than exaggerates the amount of crime in their area.
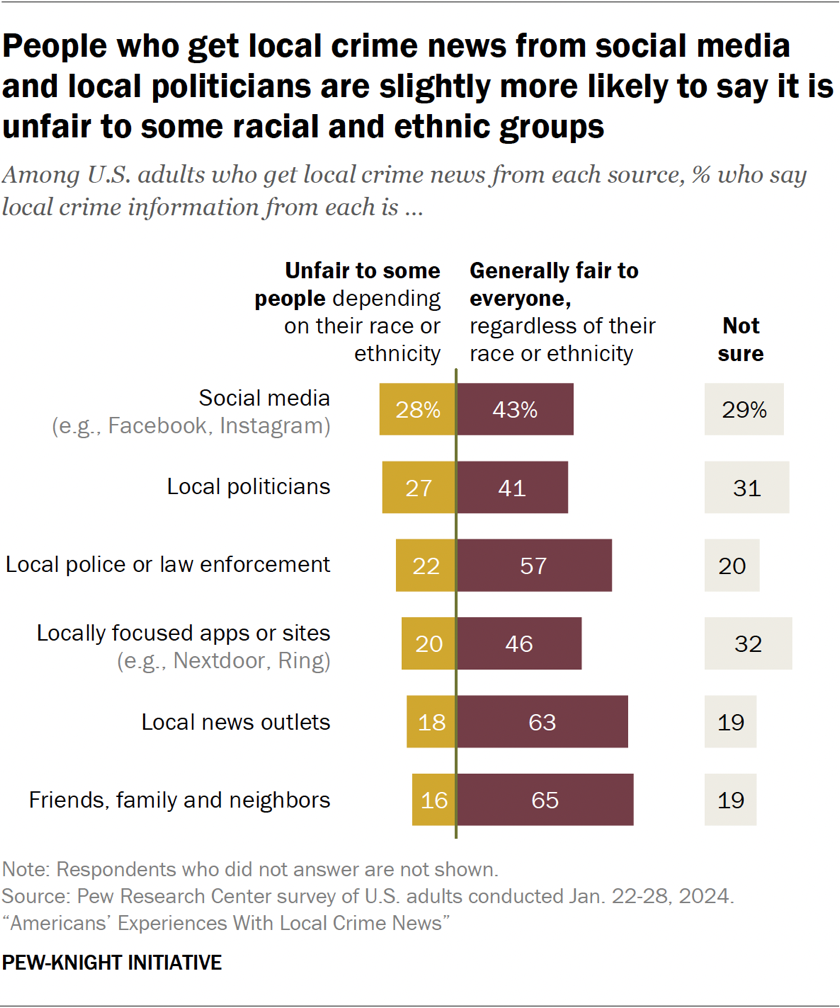
  • More than half of U.S. adults who get local crime news from friends, family and neighbors (65%), local news outlets (63%) and local law enforcement (57%) say these sources are generally fair to everyone regardless of their race or ethnicity. Black Americans and Democrats are less likely than others to say this about local police.
  • In general, smaller shares of those who get local crime news from locally focused apps (46%), social media (43%) or local politicians (41%) say these sources are fair to people across racial and ethnic groups, although many say they are not sure whether these sources are fair.

Jump to more information on the public’s attitudes toward local crime news.

How different demographic groups experience local crime news
Barbell chart showing Democrats are more likely to say local crime news sources exaggerate the amount of crime in their community

By political party: Virtually identical shares of Republicans and Democrats, including independents who lean toward either party, say the news they get about local crime often makes them feel concerned about what is happening. People in both partisan coalitions also express similar levels of satisfaction with most sources of local crime news.

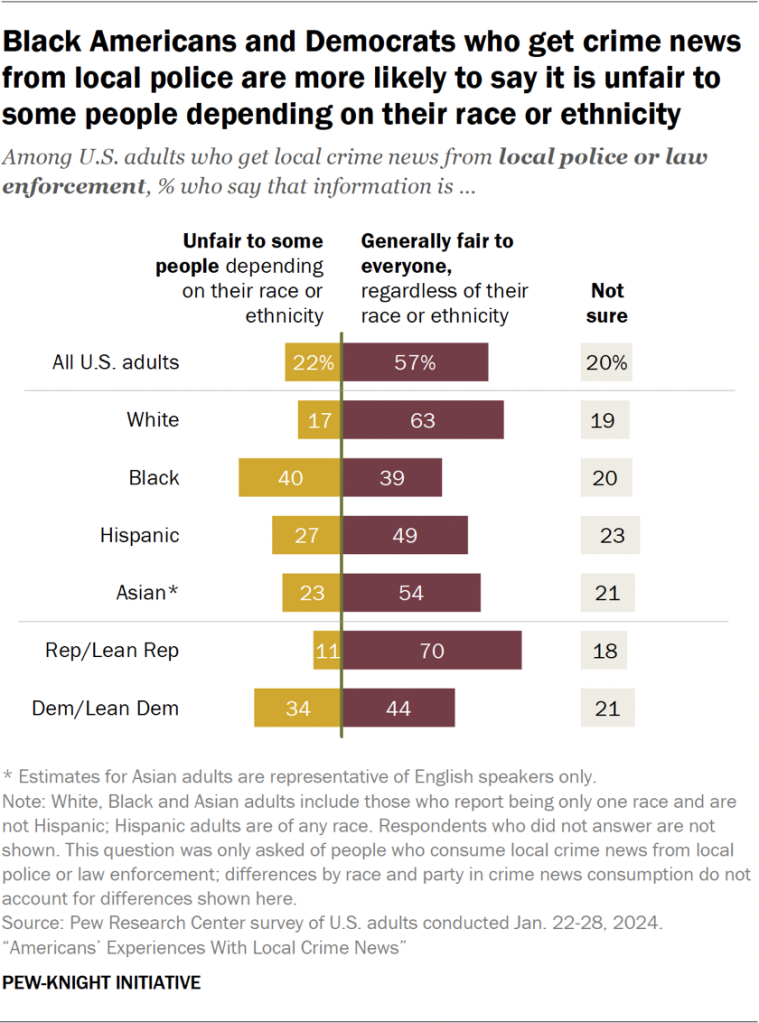
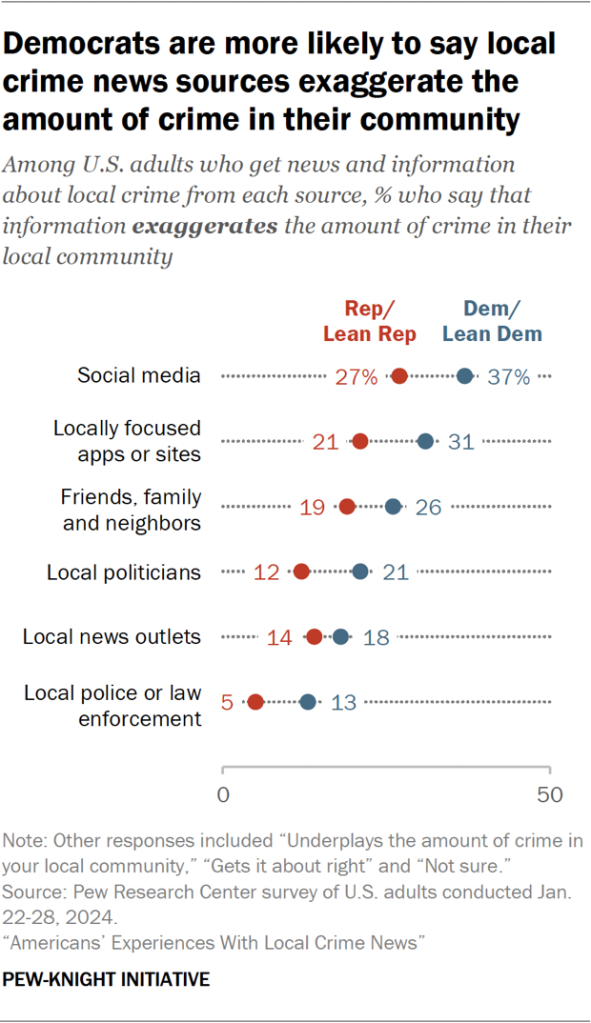
However, Democrats who get local crime news from each source we asked about are more likely than Republicans to say the information they get exaggerates the amount of crime in their community. And Democrats who get crime information from local law enforcement are about three times as likely as Republicans to say the information is unfair to some people depending on their race and ethnicity (34% vs. 11%).
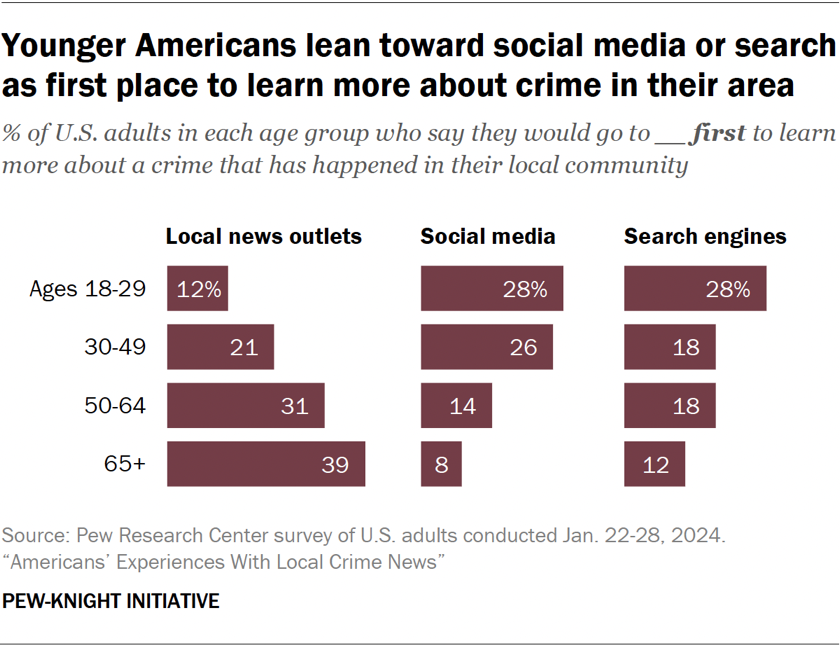
Bar chart showing younger Americans lean toward social media or search as first place to learn more about crime in their area

By age: When it comes to which sources people turn to first for information about a crime in their community, most adults ages 18 to 29 say they turn first to social media or search engines (28% each). Those 65 and older most commonly turn to local news outlets (39%).

Younger and older Americans also respond differently to news about local crime. Adults under 30 are more likely than those 50 and older to say they have posted on social media or somewhere else online about crime in their community. Meanwhile, those ages 50 and older are more likely to have expressed concerns about crime in their community to local officials or the police.
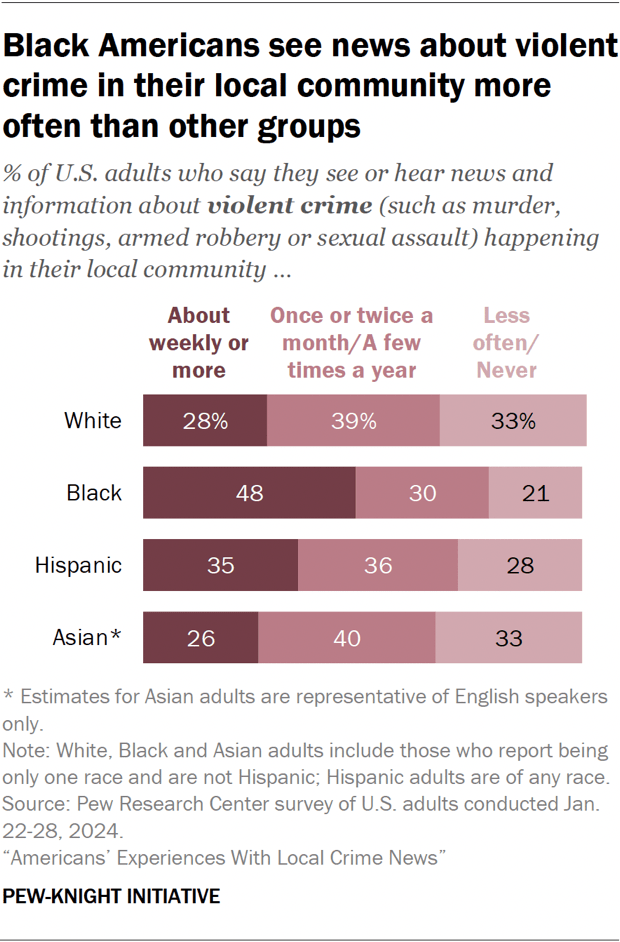
Bar chart showing Black Americans see news about violent crime in their local community more often than other groups

By race: Black Americans have distinctly different experiences with and perceptions of crime news than other racial and ethnic groups. For instance, Black Americans see or hear more local crime news – and specifically news about violent crime – than other racial and ethnic groups.

This aligns with our finding that Black Americans more closely follow local and neighborhood news in general, too. Black Americans are also more likely to express concerns about violent crime, and they are more likely than White and Asian Americans to say reducing crime should be a top issue for the president and Congress to address.

Black Americans are more likely than other groups to see crime information coming from local law enforcement and local news outlets as unfair to some people depending on their race or ethnicity.

Previous Pew Research Center studies have found that Black Americans are more likely to perceive racial bias in policing as well as in news coverage of Black people in general.
1. Sources of local crime news

Aside from weather, more Americans get news about local crime than any other local news topic we asked about in our survey.

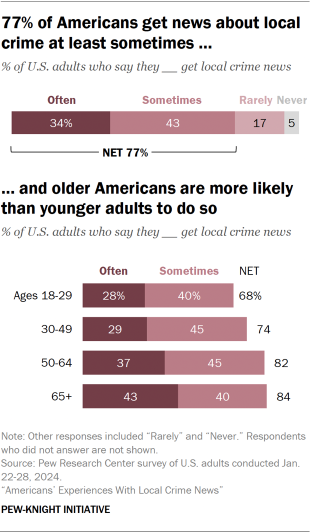
Bar chart showing 77% of Americans get news about local crime at least sometimes, and older Americans are more likely than younger adults to do so

Roughly three-quarters of U.S. adults (77%) say they often or sometimes get news and information about local crime, including 34% who say they often do. Far fewer report rarely (17%) or never (5%) getting news about local crime.

Although majorities of adults in all age groups get local crime news at least sometimes, older Americans are more likely to say they do this than younger people.

This pattern by age aligns with broader local news consumption habits. For instance, older Americans are more inclined to closely follow local news in general and to get news about all of the local news topics we asked about.

Black Americans also stand out for higher rates of crime news consumption: 45% of Black Americans report getting news about local crime often, compared with smaller shares of Hispanic (34%), White (32%) and Asian (30%) adults. Black Americans also are more likely than other racial and ethnic groups to follow local news in general very closely.

Americans who get news about local crime more often are more concerned about crime affecting them or their family:

  • Among those who say they often get news about local crime, 65% say they are at least somewhat concerned about crime in their community affecting them personally, including 33% who are extremely or very concerned.
  • By comparison, among those who rarely or never consume local crime news, about four-in-ten (39%) are at least somewhat concerned about crime affecting them or their family (10% are extremely or very concerned).

The survey cannot confirm which is more likely: that news about local crime leads people to become more concerned, or that people who are already concerned about local crime consume more news about it.

Where Americans get news about local crime

Americans report getting news and information about local crime from a variety of sources:

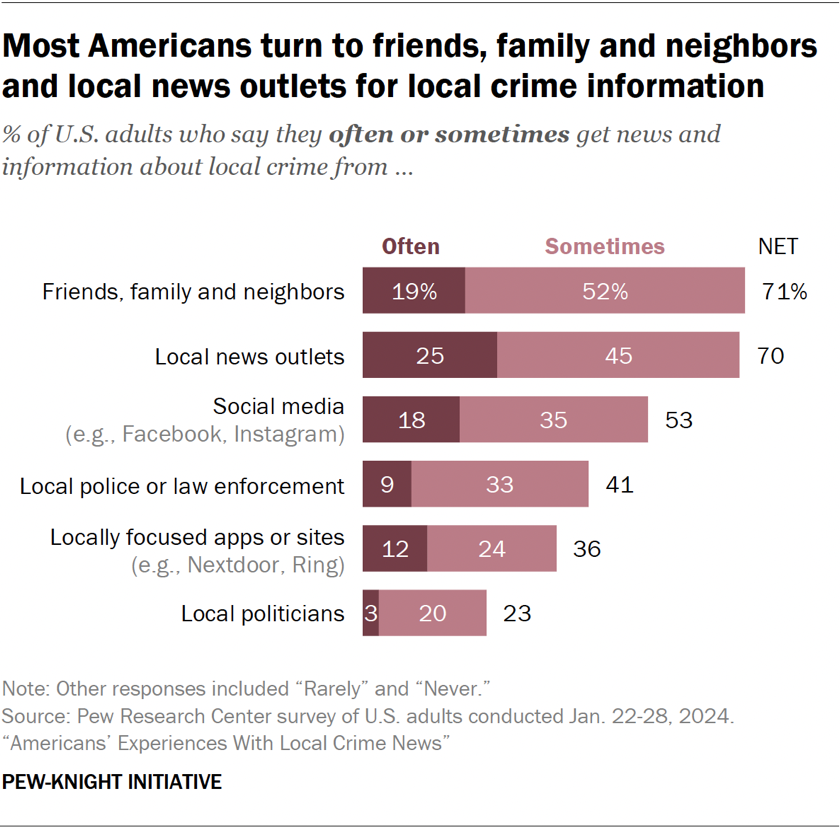
Bar chart showing most Americans turn to friends, family and neighbors and local news outlets for local crime information
  • About seven-in-ten (71%) say they often or sometimes get local crime news from friends, family and neighbors. A similar share (70%) at least sometimes get local crime news from local news outlets.
  • About half of U.S. adults get local crime news from social media (53%).
  • Fewer turn to local police or law enforcement (41%), locally focused apps or sites (36%) or local politicians (23%) for this information.

We find little difference in where people get crime information by political party. Republicans and Democrats (including independents who lean toward each party) get crime news from most types of sources mentioned in the survey at similar rates. For example, 72% of Republicans and 69% of Democrats at least sometimes get crime news from local news outlets. Republicans are slightly more likely than Democrats to turn to friends, family and neighbors (75% vs. 69%) and local law enforcement (44% vs. 39%) for crime news.

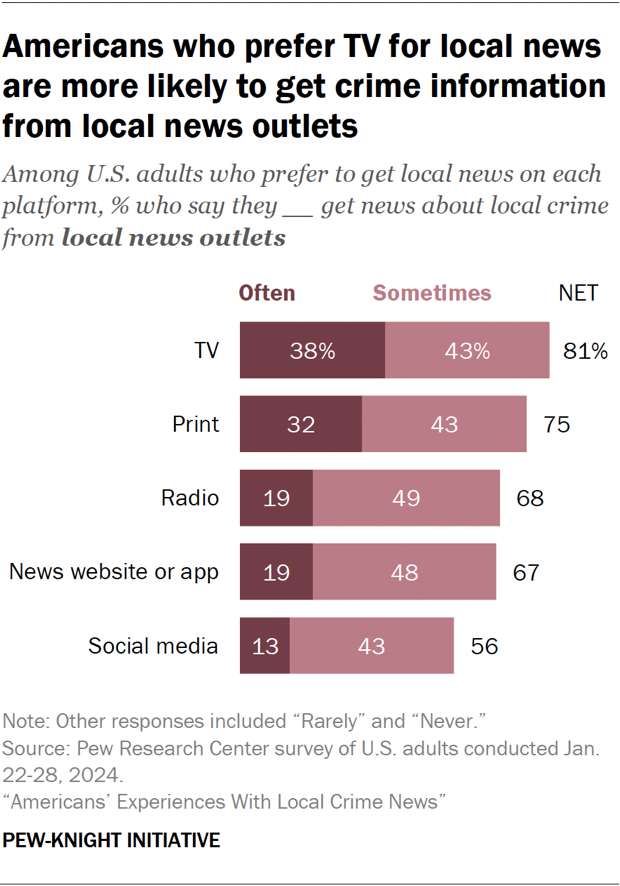
Bar chart showing Americans who prefer TV for local news are more likely to get crime information from local news outlets

Our survey did not explore how each of these sources are accessed – for instance, if people get crime information from local news outlets via print, TV or online. However, Americans who prefer television for getting local news in general are more likely than those who prefer all other pathways (such as websites or social media) to say they get crime information from local news outlets.

For instance, 81% of U.S. adults who prefer to get local news from TV say they often or sometimes get crime news from local outlets, compared with 67% of those who prefer to get local news from news websites or apps.

Local crime news sources by age

Younger Americans are more likely than older adults to get information about local crime from social media, while older Americans are more likely to get it from news outlets. This matches the pattern seen for news about local government and politics.

Differences across age groups include:

  • Adults under 30 are roughly twice as likely as those ages 65 and older to say they often or sometimes get local crime news from social media (69% vs. 34%).
  • Just over three-quarters of adults 65 and older (78%) and 50 to 64 (77%) say they at least sometimes get crime information from local news outlets, compared with smaller majorities of those ages 30 to 49 (65%) and 18 to 29 (58%).
  • Adults 65 and older are the most likely age group to get crime news from local politicians (29%, vs. 19% of those 18 to 29).

Younger Americans are just as likely as older ones to get information about local crime from their personal networks. Americans also turn to local police or law enforcement for crime information at similar rates across age groups.

Table showing older Americans are more likely to turn to local news outlets for local crime information, less likely to turn to social media

Where Americans go first for information about a local crime

While many people get news and information about local crime from multiple sources, the survey also asked respondents where they would go first to learn more about a crime in their community. No single source dominates: Americans turn to several different sources as their first choice for news about a local crime.

Bar chart showing Americans have no single go-to source for information about a local crime

About a quarter of Americans (26%) say they would first go to local news outlets to learn more about a crime in their local community. But many others look explicitly to digital sources, including social media (19%), search engines (19%), and locally focused apps or sites such as Nextdoor or Ring (8%).

Meanwhile, 17% would first ask friends, family and neighbors about what happened, and 7% would turn to local police or law enforcement. Just 1% of Americans say they would look first to local politicians for information about a crime in their community.

The type of community Americans live in plays a role in which sources they use first for information about a crime. For instance, Americans who live in rural areas (26%) are more likely than those living in suburban (15%) or urban (13%) areas to turn to friends, family and neighbors first for more information about a crime in their community.

2. Types of local crime news

To better understand the news about local crime that Americans see, we asked people what types of crime they get news about.

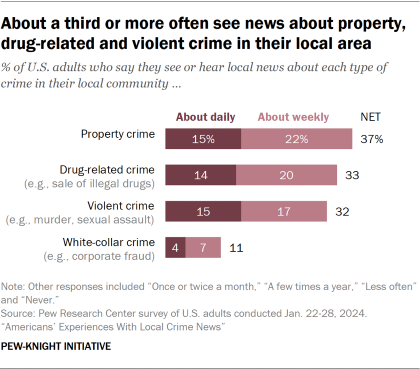
Bar chart showing about a third or more often see news about property, drug-related and violent crime in their local area

About a third or more of Americans say they see or hear local news about property crime (37%), drug-related crime (33%) and violent crime (32%) weekly or more often. Only 11% say they see local news about white-collar crime (such as corporate fraud or political corruption) at least weekly.

According to statistics from the FBI, property crime in the United States is much more common than violent crime. In 2022, the FBI reported a total of 1,954.4 property crimes and 380.7 violent crimes per 100,000 people. However, the public reports seeing news about these two types of crime at similar rates. (The FBI’s annual data only includes crimes that have been reported to law enforcement, not those that went unreported.)

Some groups are more likely to report seeing news about violent crime in their local community:

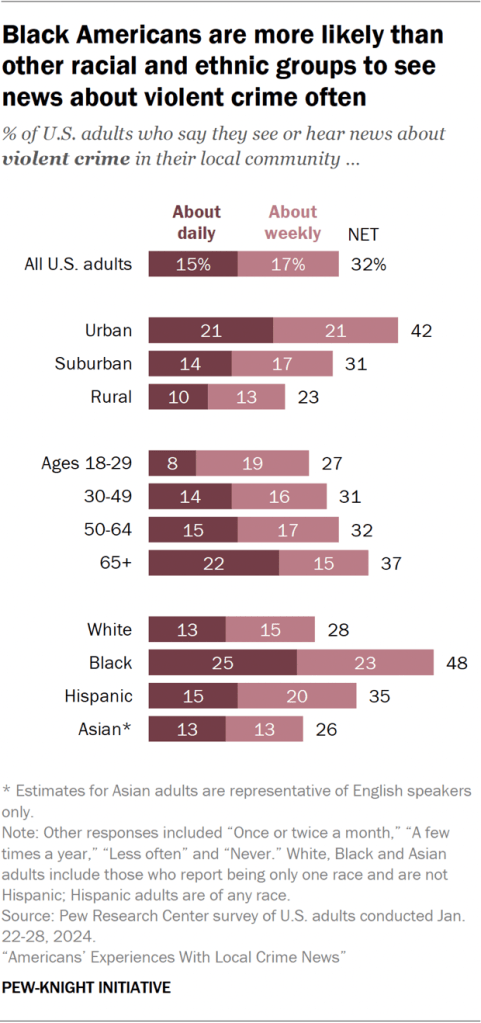
Bar chart showing Black Americans are more likely than other racial and ethnic groups to see news about violent crime often
  • City dwellers: Americans who live in urban areas (42%) are far more likely than those who live in suburban (31%) or rural (23%) areas to see violent crime news at least weekly.
  • Black Americans: A quarter say they see news about violent crime daily, and about half (48%) see it at least weekly – higher than all other racial or ethnic groups.
  • Older adults: 37% of those 65 and older see news about violent crime about weekly (including 22% who see it daily), compared with 27% of those ages 18 to 29 who see this kind of news weekly (8% daily).

These patterns are in line with our findings that both Black Americans and older Americans are also more likely to closely follow local news in general.
Black Americans also are more likely than White or Asian Americans to say reducing crime should be a top political priority for the president and Congress in 2024.

Lower-income Americans (36%) are slightly more likely than middle-income (30%) or upper-income (27%) adults to see news about violent crime at least weekly. Republicans and Democrats, including independents who lean toward either party, see violent crime news in their local community at similar rates (31% and 33%, respectively).

Americans’ interest in different aspects of crime news

Americans express interest in several aspects of local crime, although they are more interested in some than others.

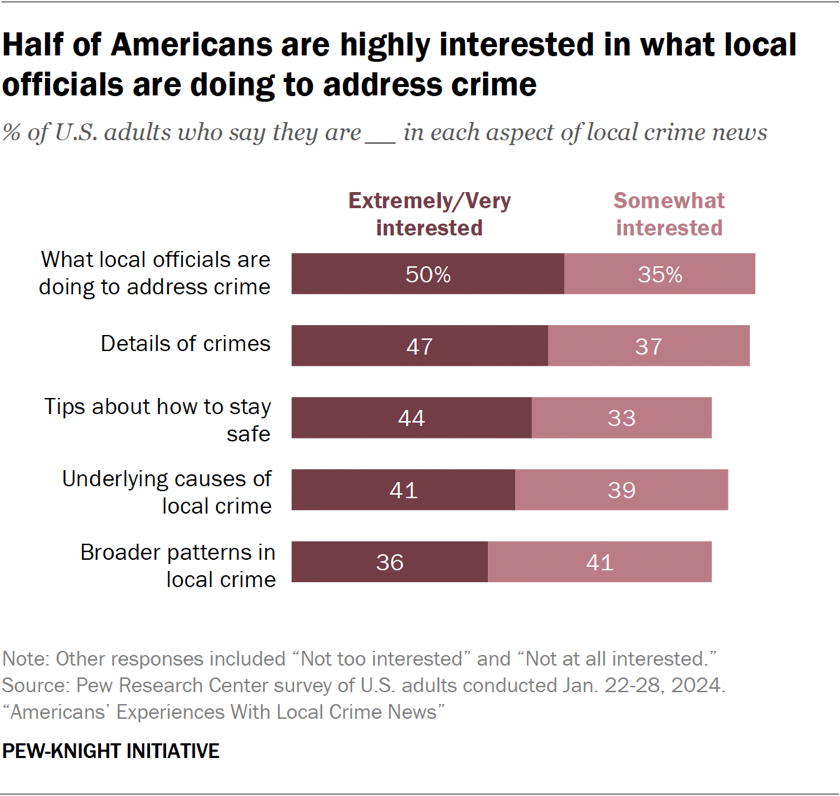
Bar chart showing half of Americans are highly interested in what local officials are doing to address crime

For example, half of U.S. adults say they are extremely or very interested in what local officials are doing to address crime (50%). Smaller shares are as interested in underlying causes of local crime (41%) and broader patterns in local crime (36%). Many also express high levels of interest in details about crimes, such as what happened and why (47%), and tips about how to stay safe (44%).

Across the board, Black Americans express higher interest than other racial and ethnic groups in all aspects of local crime news. For example, six-in-ten Black Americans are extremely or very interested in what local officials are doing to address crime and tips about how to stay safe.

Republicans (including independents who lean Republican) are somewhat more interested in the details of local crimes than are Democrats and Democratic leaners. About half of Republicans (51%) say they are extremely or very interested in such details, while 44% of Democrats say the same. Meanwhile, Democrats are more interested than Republicans in the underlying causes of local crime (46% vs. 39%).

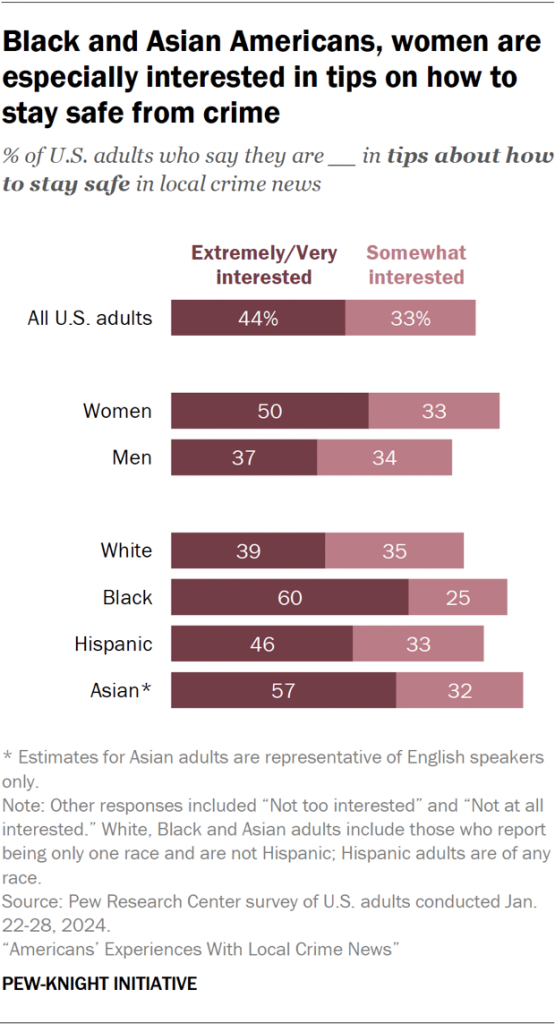
Bar chart showing Black and Asian Americans, women are especially interested in tips on how to stay safe from crime

Some demographic groups are particularly likely to say they are interested in tips about how to stay safe from local crime:

  • Women: Half of U.S. women are extremely or very interested in this information, versus 37% of men.
  • Black and Asian adults: Majorities of Black (60%) and Asian (57%) Americans say they are highly interested in tips about how to stay safe from crime, compared with fewer than half of Hispanic (46%) and White (39%) Americans.
  • Americans with lower incomes: Those with lower incomes are more likely to be highly interested in tips about how to stay safe than those with higher incomes (47% vs. 38%).

Ease of finding local crime news

Not all of the information Americans want from their local crime news is easy for them to find.

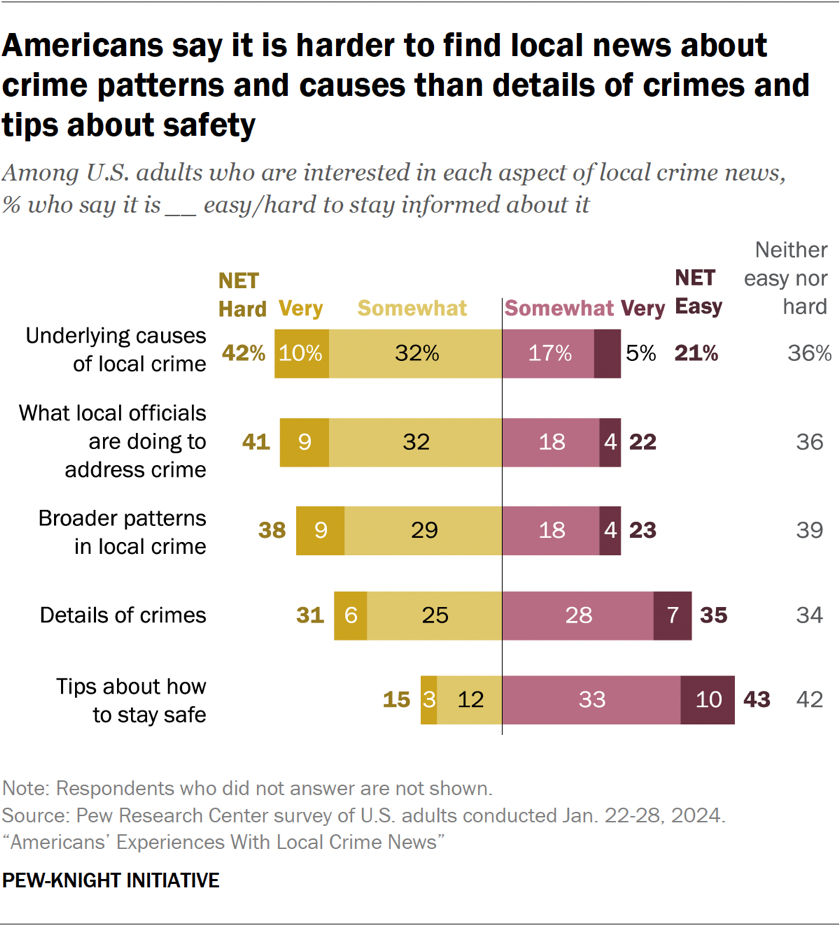
Bar chart showing Americans say it is harder to find local news about crime patterns and causes than details of crimes and tips about safety

For instance, 85% of Americans are at least somewhat interested in news about what local officials are doing to address crime, but just 22% of this group says it’s very or somewhat easy to stay informed about it. Nearly twice as many (41%) say they find it very or somewhat hard to stay informed about what local officials are doing to address crime.

Similarly, among those who are interested in the underlying causes or broader patterns in local crime, more people say it is hard than easy to stay informed about these aspects of crime coverage.

Americans who are interested in details about crimes, meanwhile, are slightly more likely to say this information is easy to find (35% easy vs. 31% hard). And those who want tips about how to stay safe are far more likely to say this is easy (43%) rather than difficult (15%) to find.

3. Quality of local crime news

Although local crime news is one of Americans’ most-followed local news topics, only a third of U.S. adults who get this type of news say they are extremely or very satisfied with its quality.

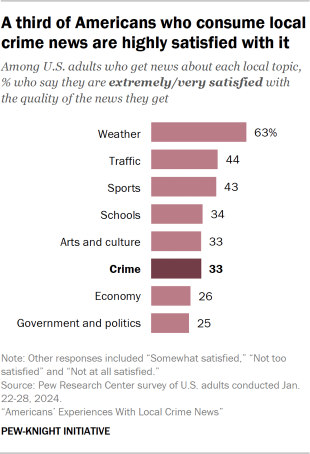
Bar chart showing a third of Americans who consume local crime news are highly satisfied with it

This is similar to the level of satisfaction among those who get news about local schools or arts and culture, and slightly higher than the share who are satisfied with the news they get about the local economy (26%) and local politics (25%). Larger shares of Americans who get news about local weather, traffic and sports are highly satisfied in these areas.

Among Americans who get local crime news, about half (48%) say they are somewhat satisfied with the quality of this news, and 18% say they are not too or not at all satisfied.

Similar to local political news, those who get local crime news more often are more likely to say they’re satisfied with its quality.

There are few major differences in satisfaction with local crime news across demographic groups, including political party. Among those who get news about local crime, roughly a third of Democrats and independents who lean toward the Democratic Party (34%) as well as Republicans and Republican leaners (33%) say they are extremely or very satisfied with its quality. Similar shares across both parties also express that they are not very or not at all satisfied (19% and 18%, respectively).

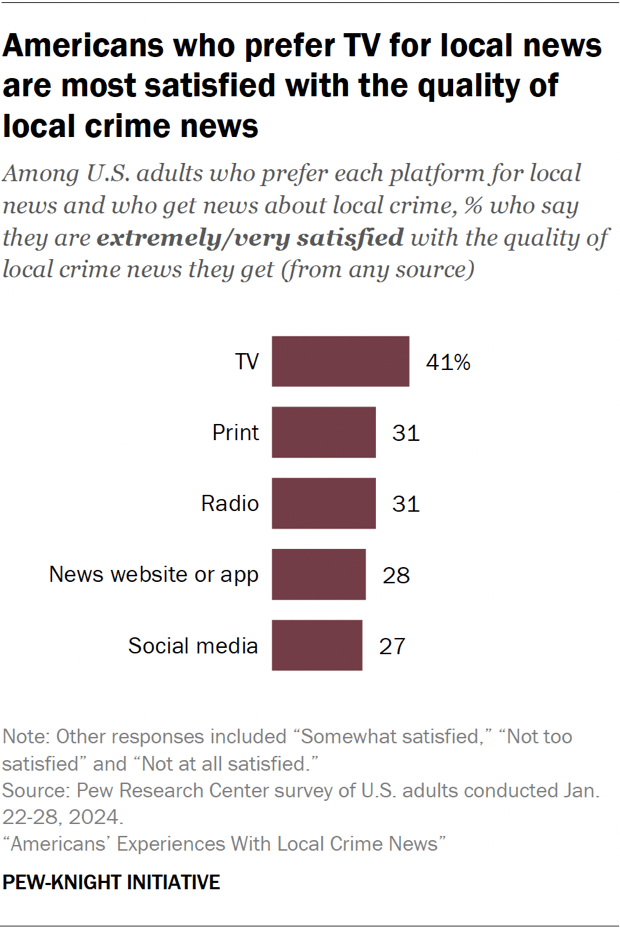
Bar chart showing Americans who prefer TV for local news are most satisfied with the quality of local crime news

Americans who prefer to get local news in general from television are somewhat more likely than those who prefer other platforms to say they are highly satisfied with the quality of news they get about local crime, regardless of which source it comes from.

About four-in-ten of these local TV news consumers (41%) say they are extremely or very satisfied with the quality of local crime news they get, compared with roughly three-in-ten of those who prefer print newspapers, radio, news websites or apps, or social media.

Perceptions of accuracy of local crime news

Majorities of Americans who get local crime news from most sources perceive that information as at least somewhat accurate – although relatively few say the information is very accurate.

Bar chart showing 77% of those who get crime information from local police believe it’s at least somewhat accurate
  • U.S. adults who get crime news from local news outlets (79%), local law enforcement (77%), and friends, family and neighbors (72%) are most likely to say that the information they get from these sources is very or somewhat accurate. No more than about a quarter say the information from any of these sources is very accurate, although Americans are more likely to say this about local law enforcement (27%) than any other source.
  • Slightly smaller shares who get local crime news from digital platforms such as social media (60%) and locally focused apps like Nextdoor or Ring (56%) say the information from these sources is at least somewhat accurate.
  • Fewer than half of Americans who get crime news from local politicians (46%) say this information is very or somewhat accurate. Nearly a third (31%) say it is not too or not at all accurate, and 22% say they are not sure. Similar shares of Democrats (47%) and Republicans (46%) say the crime information they get from local politicians is very or somewhat accurate.

Americans have more confidence in the accuracy of crime information from local law enforcement than from local politicians. This is in line with previous surveys, which have found that Americans also have much more confidence in police officers than elected officials to act in the best interests of the public.

While older consumers of crime news from each source generally are more likely than younger groups to say the local crime information they get is at least somewhat accurate, the opposite is true for social media. Roughly two-thirds of Americans under 50 (64%) see the crime information they get on social media as accurate, compared with 54% of those over 50. Younger Americans also are more likely to trust information from social media in general.

Are sources viewed as exaggerating or underplaying local crime?

Given the old journalism cliché that “if it bleeds, it leads,” the survey also asked people who get local crime news from each source whether they think that information exaggerates or underplays the amount of crime in their local community – or gets it about right.

Bar chart showing whether Americans think news sources exaggerate or underplay the amount of local crime

Fewer than half of Americans who get crime news from each source say that the information from that source exaggerates or underplays the crime in their area.

Those who get local crime news from social sources of crime information– including social media, locally focused apps or sites, and family, friends and neighbors – are more likely to say these sources exaggerate the amount of crime in their community than underplay it.

On the other hand, Americans who get local crime news from official sources (i.e., local politicians and local law enforcement) are more inclined to say these sources underplay the amount of crime in their community rather than exaggerate it.

Similar shares of those who get crime information from local news outlets say the information they get underplays (18%) and exaggerates (15%) the amount of crime in their local community.

About half of U.S. adults who get crime news from friends, family and neighbors (52%), local law enforcement (52%) and local news outlets (50%) say these sources get the amount of crime about right. For the other three sources (local politicians, social media and locally focused apps), a quarter or more of consumers of local crime content say they are not sure if those sources exaggerate or underplay the amount of crime in their area.

Some groups are more likely than others to perceive crime information as exaggerated:

  • Across all sources, younger Americans who consume local crime news are far more likely than older adults to think the amount of crime in their community is exaggerated by each source.
  • Similarly, Democrats who get local crime news from each source are more likely than Republicans to say the information they get exaggerates the amount of crime in their community.
  • Those who prefer social media or news websites or apps for local news are more likely than those who prefer other platforms to say that the information about crime they see from local news outlets exaggerates the amount of crime in their community (22% and 20%, respectively).

On the other hand, just 9% of Americans who prefer getting local news via TV say the crime information they see from local news outlets exaggerates the amount of crime in their local community. A slightly larger share (16%) say local news outlets underplay the amount of crime in their area, and 60% say they get it about right.

Perceptions of fairness of local crime news depending on race

We also asked whether Americans who get information about local crime from each source generally see it as fair to everyone regardless of their race or ethnicity. Some local crime coverage has been criticized as racially biased, and our 2023 study of Black Americans’ experiences with news found that some Black Americans view crime coverage as one way in which news outlets’ treatment of Black people has been lacking. In general, Black Americans are more likely than other racial and ethnic groups to say they often see racist or racially insensitive news coverage of Black people.

Bar chart showing people who get local crime news from social media and local politicians are slightly more likely to say it is unfair to some racial and ethnic groups

Majorities of U.S. adults who get local crime news from friends, family and neighbors (65%), local news outlets (63%) and local law enforcement (57%) say these sources are generally fair to everyone. Smaller shares say crime information coming from locally focused apps (46%), social media (43%) or local politicians (41%) is generally fair.

About a quarter of those who get crime news from social media (28%) or local politicians (27%) say the information there is unfair to some people depending on their race or ethnicity. Roughly three-in-ten also say they are not sure whether each source is fair to people depending on their race or ethnicity.

These perceptions differ consistently by political party, with Republicans more likely than Democrats to perceive all sources they get local crime news from as generally fair to everyone. In most cases, White Americans also are more likely than other racial and ethnic groups to perceive sources they consume crime information from as fair. These differences are most stark when it comes to perceptions of crime information from local law enforcement.

How Americans assess fairness of crime information from local law enforcement

The murder of George Floyd by police in 2020 raised questions about how the police themselves report a variety of incidents.

Bar chart showing Black Americans and Democrats who get crime news from local police are more likely to say it is unfair to some people depending on their race or ethnicity

About four-in-ten Americans (41%) at least sometimes get crime news directly from local law enforcement, whether through social media feeds, police reports or in other ways. A majority of people in this category (57%) say this information is generally fair to everyone, regardless of their race or ethnicity. Meanwhile, 22% believe crime information from local police is unfair to some people depending on their race or ethnicity, and 20% are not sure.

These perceptions vary across demographic groups:

  • Four-in-ten Black Americans say the crime information they get from local law enforcement is unfair to some people depending on their race or ethnicity. This is higher than the share among Hispanic (27%), Asian (23%) and White (17%) Americans.
  • Democrats (34%) who get crime news from local law enforcement are about three times as likely as Republicans (11%) to say the information is skewed based on race. There remains a substantial gap between the parties even when looking only at White Democrats and White Republicans (30% vs. 9%). Overall, seven-in-ten Republicans say the crime information they get from local police is generally fair to everyone.

4. How Americans respond to local crime news

To better understand the ways that Americans respond to local crime news, we asked how often respondents feel certain emotions after seeing or hearing this type of news.

Bar chart showing Americans most often feel concerned and angry after seeing local crime news
  • Americans who get news about crime in their community are most likely to say this coverage at least sometimes makes them feel concerned (79%) or angry (71%) about what is happening. Around three-in-ten Americans (29%) say they often feel concerned when getting this type of news.
  • People are less likely to say they at least sometimes feel motivated to change things in their community (52%), confident that things will improve (48%) or afraid for their safety (41%) after getting news about crime in their local area. This includes no more than about 10% who say they often feel each of these reactions to news about crime in their community.

About one-in-five U.S. adults (19%) say they never feel afraid for their safety when receiving local crime news – with this response more likely among men (24%) than women (14%). Indeed, women are more likely than men to say they experience most of these feelings in response to crime news, with the exception of feeling confident that things will improve.

Bar charts showing Americans who get local crime news more often are more likely to feel an emotional response to it
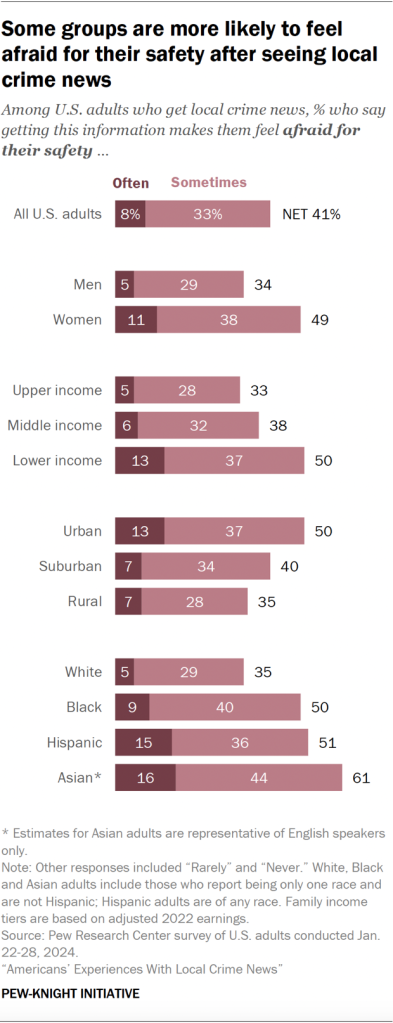
Bar chart showing some groups are more likely to feel afraid for their safety after seeing local crime news

Americans who often get local crime news are more likely than those who get it less often to at least sometimes experience most of these feelings in response to crime news.

These frequent crime news consumers are not only most likely to experience concern, anger and fear, but also are far more inclined to say they often or sometimes feel motivated to change things in their community than those who rarely or never consume crime news (63% vs. 37%).

Which Americans are more likely to feel afraid after seeing crime news?

Americans who often get news about local crime are more likely than others to report feeling afraid for their safety after seeing or hearing crime news. Other groups that are particularly inclined to experience fear include:

  • Nearly half of U.S. women (49%) report that they often or sometimes feel afraid in response to news about crime in their area, while about a third of men (34%) say the same.
  • Half of Americans who have lower incomes say this, compared with 38% of middle-income adults and a third of higher-income adults.
  • Americans who live in urban areas (50%) are more likely than those who live in suburban (40%) or rural (35%) areas to say crime news at least sometimes makes them feel afraid for their safety.
  • Racial and ethnic minority groups are more likely than White Americans to feel afraid. While 35% of White Americans report at least sometimes feeling afraid for their safety after getting crime news, at least half of Asian (61%), Hispanic (51%) and Black (50%) Americans say the same.

Americans’ responses to hearing news about local crime

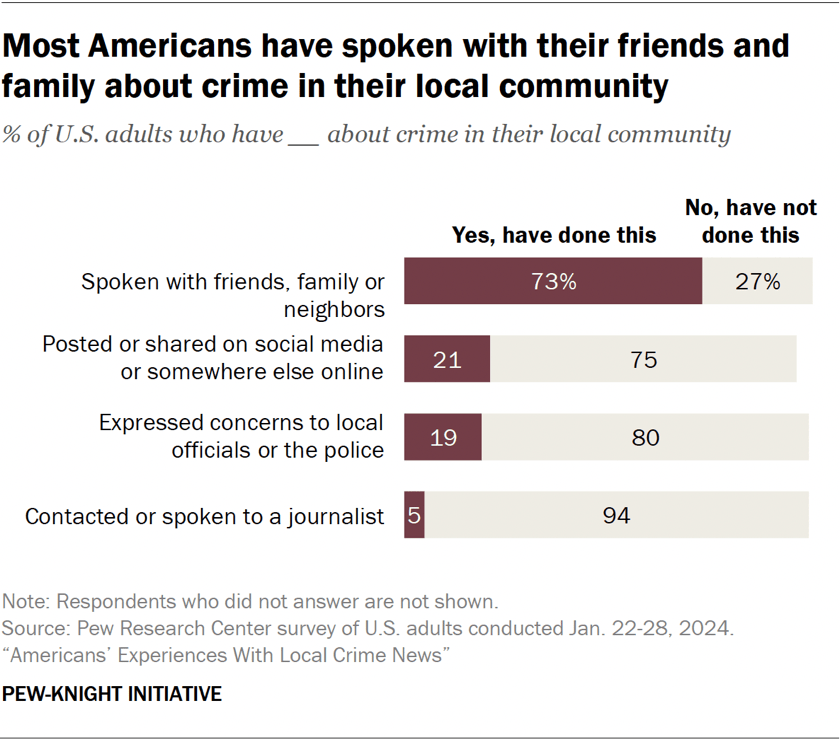
This survey explored four specific ways in which Americans may have acted upon hearing about crime in their community, apart from their emotional responses. These actions include whether they have spoken with friends and family, posted on social media, expressed concerns to local officials, or spoken to a journalist.

Bar chart showing most Americans have spoken with their friends and family about crime in their local community

Overall, Americans are far more likely to have spoken with friends, family or neighbors about crime in their local community than to have taken any of the other actions. About three-quarters of Americans (73%) say they have spoken with other people about crime in their community. Friends, family and neighbors are also a key source for people to get news about local crime.

Around one-in-five Americans say they have posted or shared about crime online (21%) or expressed concerns to local officials or to the police (19%). And only 5% say they have contacted or spoken to a journalist about crime in their local community.

Overall, those who get local crime news more often are more likely to act upon this news. For instance, 81% of U.S. adults who often get crime news say they have spoken with family, friends or neighbors about local crime, compared with 57% of those who rarely or never get this news. This group is also more likely to have posted about local crime online and to have expressed concerns about it to local officials.

Responses to local crime news by age and income

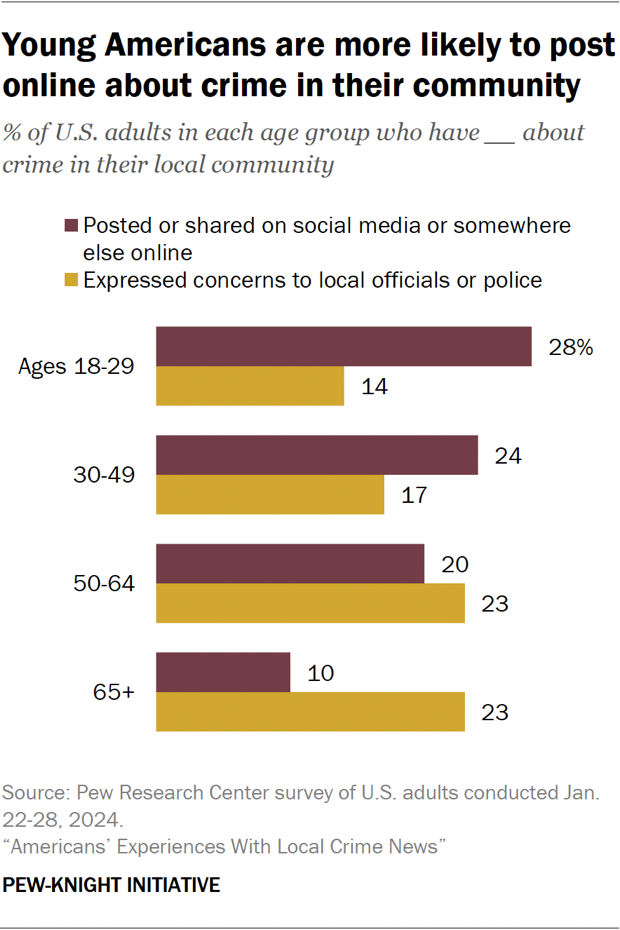
Younger Americans are more likely than older adults to have posted on social media or somewhere else online about crime in their local community. Nearly three-in-ten Americans ages 18 to 29 (28%) say they have done this, compared with 10% of Americans ages 65 and older.

Bar chart showing young Americans are more likely to post online about crime in their community

On the other hand, older Americans are more likely to have spoken to local officials to express their concerns about crime. About a quarter of adults ages 50 and older (23%) say they have expressed concerns about crime to local officials, while 14% of those ages 18 to 29 say the same.

Americans with lower incomes are more likely than those with middle and higher incomes to have posted or shared online about crime in their community. About a quarter of lower-income Americans (26%) say they have posted on social media about local crime, compared with 19% of middle-income Americans and 14% of upper-income Americans.

Acknowledgments

This is a Pew Research Center report from the Pew-Knight Initiative, a research program funded jointly by The Pew Charitable Trusts and the John S. and James L. Knight Foundation. Find related reports online at https://alpha.pewresearch.org/pewresearch-org/pew-knight/.

Research

Kirsten Eddy, Senior Researcher
Michael Lipka, Associate Director, News and Information Research
Katerina Eva Matsa, Director, News and Information Research
Naomi Forman-Katz, Research Analyst
Sarah Naseer, Research Analyst
Christopher St. Aubin, Research Assistant
Elisa Shearer, Senior Researcher
Luxuan Wang, Research Associate
Jacob Liedke, Research Analyst      

Editorial and Graphic Design

John Gramlich, Associate Director, Short Reads
David Kent, Senior Copy Editor
Kaitlyn Radde, Associate Information Graphics Designer
Peter Bell, Associate Director, Design and Production
Andrea Caumont, Associate Director, Digital Outreach

Communications and Web Publishing

Sogand Afkari, Communications Manager
Mithila Samak, Communications Associate
Justine Coleman, Associate Digital Producer

In addition, the project benefited greatly from the guidance of the Pew Research Center methodology team: Courtney Kennedy, Andrew Mercer, Ashley Amaya, Dorene Asare-Marfo, Dana Popky, Anna Brown and Arnold Lau. Kim Parker, director of social trends research, Jocelyn Kiley, senior associate director of research, and Mark Hugo Lopez, director of race and ethnicity research, also provided valuable input.

Methodology

The American Trends Panel survey methodology

Overview

The American Trends Panel (ATP), created by Pew Research Center, is a nationally representative panel of randomly selected U.S. adults. Panelists participate via self-administered web surveys. Panelists who do not have internet access at home are provided with a tablet and wireless internet connection. Interviews are conducted in both English and Spanish. The panel is being managed by Ipsos.

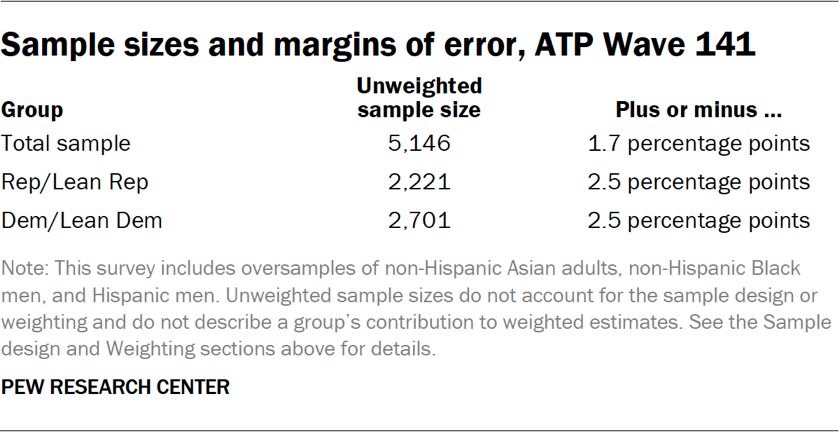
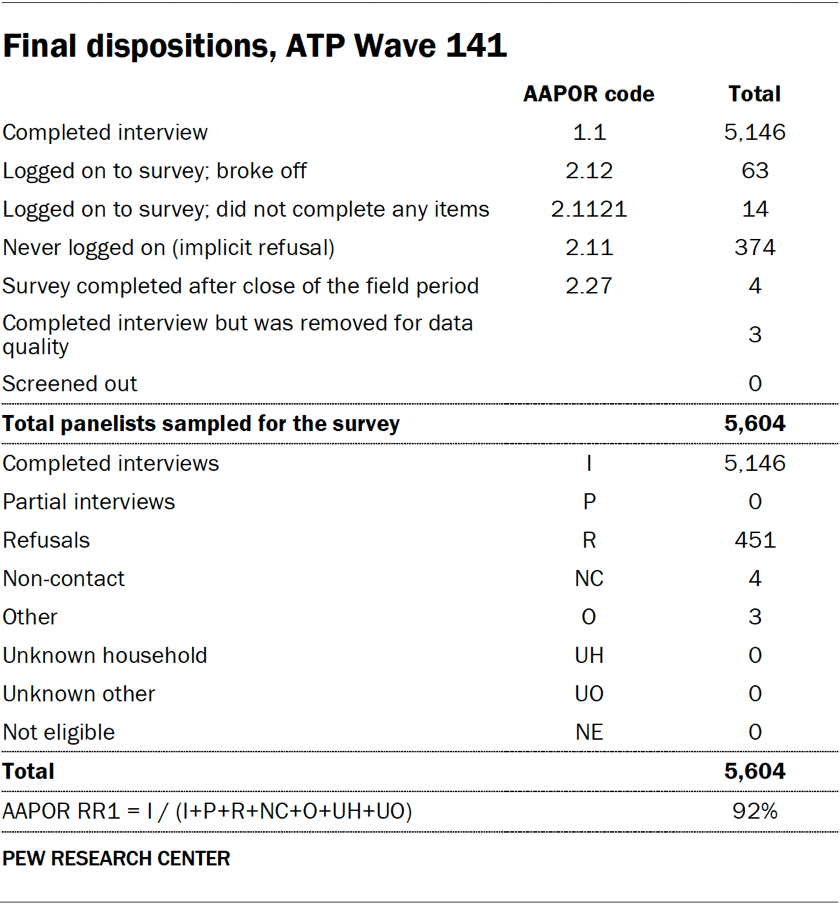
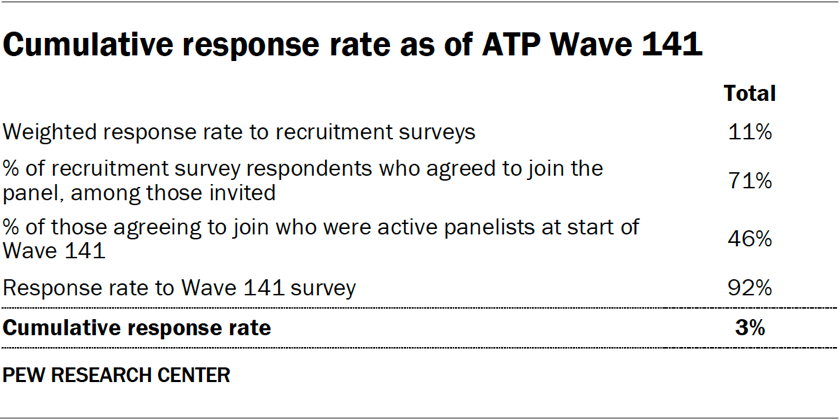
Data in this report is drawn from ATP Wave 141, conducted from Jan. 22 to 28, 2024, and includes an oversample of non-Hispanic Asian adults, non-Hispanic Black men and Hispanic men in order to provide more precise estimates of the opinions and experiences of these smaller demographic subgroups. These oversampled groups are weighted back to reflect their correct proportions in the population. A total of 5,146 panelists responded out of 5,604 who were sampled, for a response rate of 92%. The cumulative response rate accounting for nonresponse to the recruitment surveys and attrition is 3%. The break-off rate among panelists who logged on to the survey and completed at least one item is 1%. The margin of sampling error for the full sample of 5,146 respondents is plus or minus 1.7 percentage points.

This is a Pew Research Center report from the Pew-Knight Initiative, a research program funded jointly by The Pew Charitable Trusts and the John S. and James L. Knight Foundation. Find related reports online at https://alpha.pewresearch.org/pewresearch-org/pew-knight/.

Panel recruitment

The ATP was created in 2014, with the first cohort of panelists invited to join the panel at the end of a large, national, landline and cellphone random-digit-dial survey that was conducted in both English and Spanish. Two additional recruitments were conducted using the same method in 2015 and 2017, respectively. Across these three surveys, a total of 19,718 adults were invited to join the ATP, of whom 9,942 (50%) agreed to participate.

In August 2018, the ATP switched from telephone to address-based sampling (ABS) recruitment. A study cover letter and a pre-incentive are mailed to a stratified, random sample of households selected from the U.S. Postal Service’s Delivery Sequence File. This Postal Service file has been estimated to cover as much as 98% of the population, although some studies suggest that the coverage could be in the low 90% range.1

Within each sampled household, the adult with the next birthday is asked to participate. Other details of the ABS recruitment protocol have changed over time but are available upon request.2

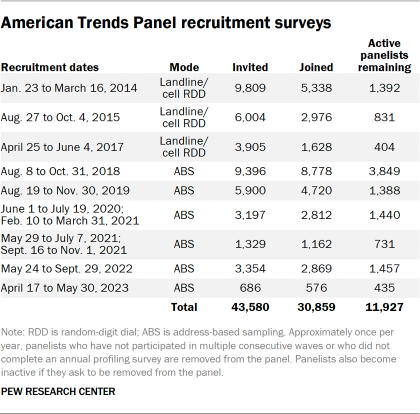
Table showing the American Trends Panel recruitment surveys

We have recruited a national sample of U.S. adults to the ATP approximately once per year since 2014. In some years, the recruitment has included additional efforts (known as an “oversample”) to boost sample size with underrepresented groups. For example, Hispanic adults, Black adults and Asian adults were oversampled in 2019, 2022 and 2023, respectively.

Across the six address-based recruitments, a total of 23,862 adults were invited to join the ATP, of whom 20,917 agreed to join the panel and completed an initial profile survey. Of the 30,859 individuals who have ever joined the ATP, 11,927 remained active panelists and continued to receive survey invitations at the time this survey was conducted.

The American Trends Panel never uses breakout routers or chains that direct respondents to additional surveys.

Sample design

The overall target population for this survey was noninstitutionalized persons ages 18 and older living in the U.S., including Alaska and Hawaii. It featured a stratified random sample from the ATP in which Hispanic men, non-Hispanic Black men and non-Hispanic Asian adults were selected with certainty. The remaining panelists were sampled at rates designed to ensure that the share of respondents in each stratum is proportional to its share of the U.S. adult population to the greatest extent possible. Respondent weights are adjusted to account for differential probabilities of selection as described in the Weighting section below.

Questionnaire development and testing

The questionnaire was developed by Pew Research Center in consultation with Ipsos. The web program was rigorously tested on both PC and mobile devices by the Ipsos project management team and Pew Research Center researchers. The Ipsos project management team also populated test data that was analyzed in SPSS to ensure the logic and randomizations were working as intended before launching the survey.

Incentives

All respondents were offered a post-paid incentive for their participation. Respondents could choose to receive the post-paid incentive in the form of a check or a gift code to Amazon.com or could choose to decline the incentive. Incentive amounts ranged from $5 to $20 depending on whether the respondent belongs to a part of the population that is harder or easier to reach. Differential incentive amounts were designed to increase panel survey participation among groups that traditionally have low survey response propensities.

Data collection protocol

The data collection field period for this survey was Jan. 22 to Jan. 28, 2024. Postcard notifications were mailed to a subset of ATP panelists with a known residential address on Jan. 22.3

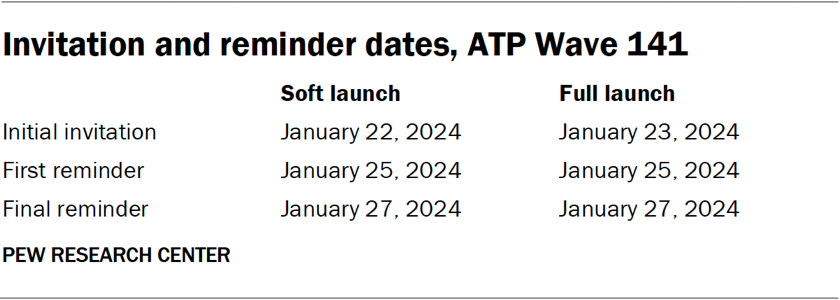
Invitations were sent out in two separate launches: soft launch and full launch. Sixty panelists were included in the soft launch, which began with an initial invitation sent on Jan. 22. The ATP panelists chosen for the initial soft launch were known responders who had completed previous ATP surveys within one day of receiving their invitation. All remaining English- and Spanish-speaking sampled panelists were included in the full launch and were sent an invitation on Jan. 23.

All panelists with an email address received an email invitation and up to two email reminders if they did not respond to the survey. All ATP panelists who consented to SMS messages received an SMS invitation and up to two SMS reminders.

Table showing the invitation and reminder dates, ATP Wave 141

Data quality checks

To ensure high-quality data, the Center’s researchers performed data quality checks to identify any respondents showing clear patterns of satisficing. This includes checking for whether respondents left questions blank at very high rates or always selected the first or last answer presented. As a result of this checking, three ATP respondents were removed from the survey dataset prior to weighting and analysis.

Weighting

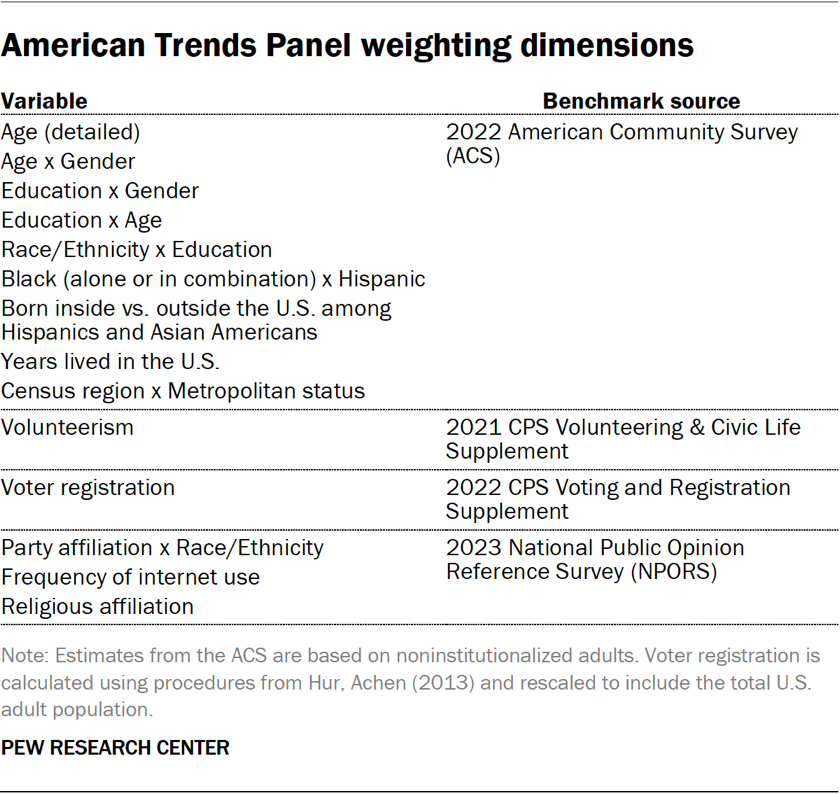
The ATP data is weighted in a multistep process that accounts for multiple stages of sampling and nonresponse that occur at different points in the survey process. First, each panelist begins with a base weight that reflects their probability of selection for their initial recruitment survey. These weights are then rescaled and adjusted to account for changes in the design of ATP recruitment surveys from year to year. Finally, the weights are calibrated to align with the population benchmarks in the accompanying table to correct for nonresponse to recruitment surveys and panel attrition. If only a subsample of panelists was invited to participate in the wave, this weight is adjusted to account for any differential probabilities of selection.

Table showing the American Trends Panel weighting dimensions

Among the panelists who completed the survey, this weight is then calibrated again to align with the population benchmarks identified in the accompanying table and trimmed at the 2nd and 98th percentiles to reduce the loss in precision stemming from variance in the weights. This trimming is performed separately among non-Hispanic Black, non-Hispanic Asian, Hispanic and all other respondents. Sampling errors and tests of statistical significance take into account the effect of weighting.

The following table shows the unweighted sample sizes and the error attributable to sampling that would be expected at the 95% level of confidence for different groups in the survey.

Table showing the sample sizes and margins of error, ATP Wave 141

Sample sizes and sampling errors for other subgroups are available upon request. In addition to sampling error, one should bear in mind that question wording and practical difficulties in conducting surveys can introduce error or bias into the findings of opinion polls.

Dispositions and response rates

Table showing the final dispositions, ATP Wave 141
Table showing the cumulative response rate as of ATP Wave 141