Pew-Knight Initiative

FOR RELEASE MAY 7, 2024

Americans’ Changing Relationship With Local News

As news consumption habits become more digital, U.S. adults continue to see value in local outlets

BY Elisa Shearer, Katerina Eva Matsa, Michael Lipka, Kirsten Eddy and Naomi Forman-Katz

FOR MEDIA OR OTHER INQUIRIES:

Communications Department
202.419.4372
www.pewresearch.org

RECOMMENDED CITATION

Pew Research Center, May 2024, "Americans’ Changing Relationship With Local News"

About the Pew-Knight Initiative

The Pew-Knight Initiative supports new research on how Americans absorb civic information, form beliefs and identities, and engage in their communities. Pew Research Center is a nonpartisan, nonadvocacy fact tank that informs the public about the issues, attitudes and trends shaping the world. Knight Foundation is a social investor committed to supporting informed and engaged communities.

© Pew Research Center 2026

Table of contents

  • About the Pew-Knight Initiative
  • Americans’ Changing Relationship With Local News
  • 1. Attention to local news
  • 2. Local news topics
  • 3. Sources of local news
  • 4. Views of local news
  • 5. Americans’ views on the financial health of local news
  • Acknowledgments
  • Methodology

Americans’ Changing Relationship With Local News

As news consumption habits become more digital, U.S. adults continue to see value in local outlets

How we did this

Pew Research Center conducted this study to better understand the local news habits and attitudes of U.S. adults. It is a follow-up to a similar study conducted in 2018.

The survey of 5,146 U.S. adults was conducted from Jan. 22 to 28, 2024. Everyone who completed the survey is a member of the Center’s American Trends Panel (ATP), an online survey panel that is recruited through national, random sampling of residential addresses. This way nearly all U.S. adults have a chance of selection. The survey is weighted to be representative of the U.S. adult population by gender, race, ethnicity, partisan affiliation, education and other categories. Read more about the ATP’s methodology.

Refer to the topline for the questions used for this survey, along with responses, and to the methodology for more details.

This is a Pew Research Center report from the Pew-Knight Initiative, a research program funded jointly by The Pew Charitable Trusts and the John S. and James L. Knight Foundation. Find related reports online at https://alpha.pewresearch.org/pewresearch-org/pew-knight/.

Find more updated survey data about local news in our “Local News Fact Sheet” here. 

This is the first report in a series focused on local news. Read our second report, “How Americans Get Local Political News,” and our third report, “Americans’ Experiences With Local Crime News.” 

The local news landscape in America is going through profound changes as both news consumers and producers continue to adapt to a more digital news environment. We recently asked U.S. adults about the ways they access local news, as well as their attitudes toward local journalism, finding that:
A bar chart showing Americans increasingly prefer digital pathways to local news
A bar chart showing most Americans say local media are at least somewhat important to their community
  • A growing share of Americans prefer to get local news online, while fewer are getting news on TV or in print. And newspapers are no longer primarily consumed as a print product – the majority of readers of local daily newspapers now access them digitally.
  • The share of U.S. adults who say they are paying close attention to local news has dropped since our last major survey of attitudes toward local news in 2018, mirroring declining attention to national news.
  • Americans still see value in local news and local journalists. A large majority say local news outlets are at least somewhat important to the well-being of their local community. Most people also say local journalists are in touch with their communities and that their local news media perform well at several aspects of their jobs, such as reporting the news accurately.
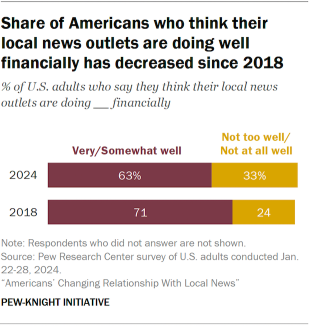
  • At the same time, a relatively small share of Americans (15%) say they have paid for local news in the last year. And many seem unaware of the major financial challenges facing local news: A 63% majority (albeit a smaller majority than in 2018) say they think their local news outlets are doing very or somewhat well financially.
  • Majorities of both major parties say local media in their area are doing their jobs well. While Republicans and GOP-leaning independents are slightly less positive than Democrats and Democratic leaners in their opinions of local media, views of local news don’t have the same stark political divides that exist within Americans’ opinions about national media.
  • Most Americans say local journalists should remain neutral on issues in their community, but a substantial minority say local journalists should take a more active role. About three-in-ten say local journalists should advocate for change in their communities, a view that’s especially common among Democrats and younger adults.

These are some of the key findings from a new Pew Research Center survey of about 5,000 U.S. adults conducted in January 2024. This is the first in a series of Pew Research Center reports on local news from the Pew-Knight Initiative, a research program funded jointly by The Pew Charitable Trusts and the John S. and James L. Knight Foundation.

Americans largely hold positive views of local news organizations

At a time when many local news outlets are struggling and Americans’ trust in the news media has waned, the vast majority of U.S. adults (85%) say local news outlets are at least somewhat important to the well-being of their local community. This includes 44% who say local journalism is extremely or very important to their community

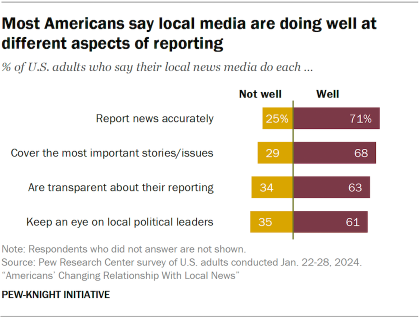
About seven-in-ten U.S. adults (69%) say that local journalists in their area are mostly in touch with their community, up from 63% who said this in 2018. And most Americans also say their local news organizations are doing well at four key roles:
A bar chart showing most Americans say local media are doing well at different aspects of reporting
  • Reporting news accurately (71%)
  • Covering the most important stories (68%)
  • Being transparent (63%)
  • Keeping an eye on local political leaders (61%).

These are relatively positive views compared with how Americans see news organizations more broadly. For instance, a 2022 Pew Research Center survey found that fewer than half of U.S. adults say that news organizations in general do a very or somewhat good job of covering the most important stories, reporting the news accurately and serving as a watchdog over elected leaders.

A bar chart showing majorities of both political parties believe their local news media do various aspects of their jobs well

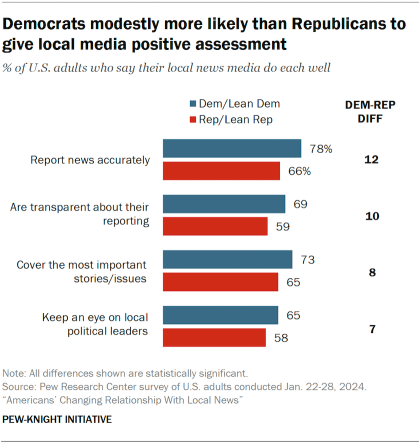
What’s more, views toward local news are not as politically polarized as Americans’ opinions about the news media overall. While Republicans and GOP-leaning independents are not quite as positive as Democrats and Democratic leaners in some of their assessments of local journalists, most Republicans still say the local media in their area are doing their jobs well.

For example, roughly three-quarters of Democrats (78%) say their local media do well at reporting news accurately, compared with about two-thirds of Republicans (66%).

By comparison, the 2022 survey found that 51% of Democrats and just 17% of Republicans say that news organizations in general do a very or somewhat good job of reporting the news accurately.

Jump to more information on views toward local news organizations.

A bar chart showing declines in attention to both local and national news

Fewer Americans are closely following local news – and other types of news

Despite these positive views toward local news organizations, there are signs that Americans are engaging less with local journalism than they used to.

The share of Americans who say they follow local news very closely has fallen by 15 percentage points since 2016 (from 37% to 22%). Most U.S. adults still say they follow local news at least somewhat closely (66%), but this figure also has dropped in recent years.

A line chart showing Americans’ preferred path to local news is moving online

This trend is not unique to local news – Americans’ attention to national and international news also has declined.

The local news landscape is becoming more digital

The ways in which Americans access local news are changing, reflecting an increasingly digital landscape – and matching patterns in overall news consumption habits.

Preferred pathways to local news

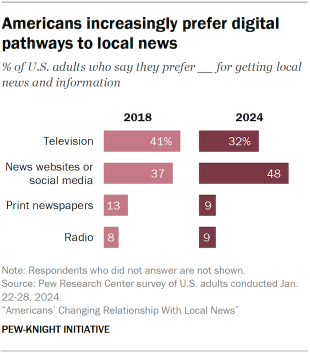
  • Fewer people now say they prefer to get local news through a television set (32%, down from 41% who said the same in 2018).
  • Americans are now more likely to say they prefer to get local news online, either through news websites (26%) or social media (23%). Both of these numbers have increased in recent years.
  • Smaller shares prefer getting their local news from a print newspaper or on the radio (9% each).

Specific sources for local news

The types of sources (e.g., outlets or organizations) Americans are turning to are changing as well:

A bar chart showing more Americans get local news from online forums than daily newspapers
  • While local television stations are still the most common source of local news beyond friends, family and neighbors, the share who often or sometimes get news there has declined from 70% to 64% in recent years.
  • Online forums, such as Facebook groups or the Nextdoor app, have become a more common destination for local news: 52% of U.S. adults say they at least sometimes get local news from these types of forums, up 14 percentage points from 2018. This is on par with the percentage who get local news at least sometimes from local radio stations.
  • Meanwhile, a third of Americans say they at least sometimes get local news from a daily newspaper, regardless of whether it is accessed via print, online or through a social media website – down 10 points from 2018. The share of Americans who get local news from newspapers is now roughly on par with the share who get local news from local government agencies (35%) or local newsletters or Listservs (31%).

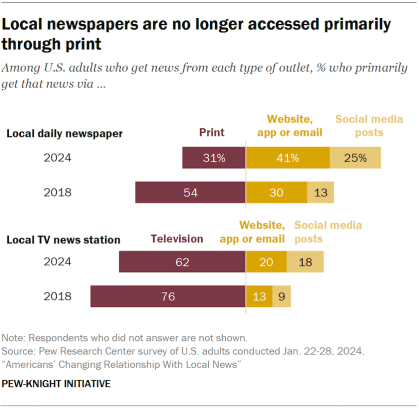
Not only are fewer Americans getting local news from newspapers, but local daily newspapers are now more likely to be accessed online than in print.
A bar chart showing local newspapers are no longer accessed primarily through print
  • 31% of those who get news from daily newspapers do so via print, while far more (66%) do so digitally, whether through websites, apps, emails or social media posts that include content from the paper.
  • In 2018, just over half of those who got news from local daily newspapers (54%) did so from print, and 43% did so via a website, app, email or social media site.

There is a similar move toward digital access for local TV stations, though local TV news is still mostly consumed through a TV set.

  • In 2024, 62% of those getting news from local TV stations do so through a television, compared with 37% who do so through one of the digital pathways.
  • An even bigger majority of local TV news consumers (76%) got that news through a TV set in 2018.

Jump to more information on how people access local news.

The financial state of local news

The turmoil for the local news industry in recent years has come with major financial challenges. Circulation and advertising revenue for newspapers have seen sharp declines in the last decade, according to our analysis of industry data, and other researchers have documented that thousands of newspapers have stopped publishing in the last two decades. There also is evidence of audience decline for local TV news stations, although advertising revenue on local TV has been more stable.

A bar chart showing the share who think their local news is doing well financially has fallen since 2018 but is still a majority

When asked about the financial state of the news outlets in their community, a majority of Americans (63%) say they think their local news outlets are doing very or somewhat well, with a third saying that they’re not doing too well or not doing well at all. This is a slightly more pessimistic view than in 2018, when 71% said their local outlets were doing well, though it is still a relatively positive assessment of the financial state of the industry.

Just 15% of Americans say they have paid or given money to any local news source in the past year – a number that has not changed much since 2018. The survey also asked Americans who did not pay for news in the past year the main reason why not. The most common explanation is that people don’t pay because they can find plenty of free local news, although young adults are more inclined to say they just aren’t interested enough in local news to pay for it.

Jump to more information on how people view the financial state of local news.

Other key findings in this report
A bar chart showing weather, crime, traffic and government are all commonly followed local news topics

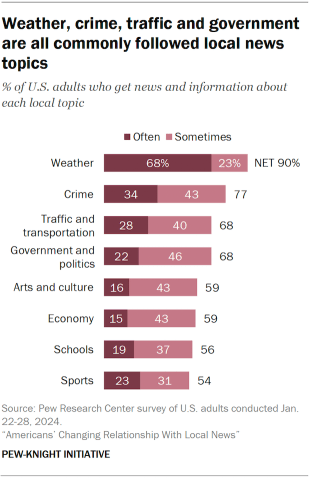
Americans get local news about a wide variety of topics. Two-thirds or more of U.S. adults at least sometimes get news about local weather, crime, government and politics, and traffic and transportation, while smaller shares (but still at least half) say they get local news about arts and culture, the economy, schools, and sports.

Relatively few Americans are highly satisfied with the coverage they see of many topics. The survey also asked respondents who at least sometimes get each type of local news how satisfied they are with the news they get. With the exception of weather, fewer than half say they are extremely or very satisfied with the quality of the news they get about each topic. For example, about a quarter of those who consume news about their local economy (26%) say they are extremely or very satisfied with this news. Read more about different local news topics in Chapter 2.

A bar chart showing younger adults are more likely to say that local journalists should advocate for change in the community

When asked whether local journalists should remain neutral on community issues or advocate for change in the community, a majority of Americans (69%) say journalists should remain neutral, reflecting more traditional journalistic norms. However, 29% say that local journalists should be advocating for change in their communities. Younger adults are the most likely to favor advocacy by journalists: 39% of those ages 18 to 29 say that local journalists should push for change, as do 34% of those 30 to 49. Read more about Americans’ views of the role of local journalists in Chapter 4.

Americans who feel a strong sense of connection to their community are more likely to engage with local news, say that local news outlets are important to the community, and rate local media more highly overall. For example, 66% of those who say they are very attached to their community say local news outlets are extremely or very important to the well-being of their local community, compared with 46% of those who are somewhat attached and 31% of those who are not very or not at all attached to their community.

1. Attention to local news

Find more updated survey data about local news in our “Local News Fact Sheet” here. 

The share of Americans who say they follow local news very closely now stands at 22% – a decline of 15 percentage points since 2016, when 37% of U.S. adults said the same.

A bar chart showing fewer Americans are closely following local and national news

Most U.S. adults (66%) still say they follow local news at least somewhat closely, although this number is also down. Roughly eight-in-ten adults (78%) followed local news at least somewhat closely in 2016.

This decline in attention is not unique to local news: The percentage of Americans following national news very closely declined from 33% in 2016 to 22% in 2024. And the share who say they follow the news all or most of the time (whether it is local, national or some other kind of news) dropped from 51% in 2016 to 38% in 2022.

A line chart showing older adults are more likely to follow local news very closely, although attention is waning across all groups

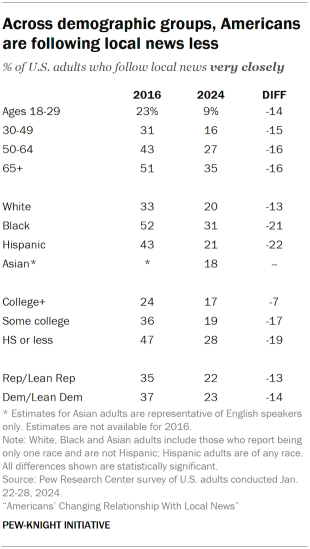
The decline in attention to local news has occurred across demographic groups, though there are still major differences by age. Young adults are much less likely than their elders to say they follow local news: In 2024, just 9% of Americans ages 18 to 29 say they follow local news very closely, compared with 35% of those 65 and older.

But people across all age groups have become less likely to follow local news in recent years. For instance, in 2016, 23% of the youngest adults said they followed local news very closely, and 51% of the oldest adults said the same.

About half of the youngest adults (47%) now say they follow local news at least somewhat closely, while majorities of all other age groups say this.

A table showing across demographic groups, Americans are following local news less

Americans with higher levels of formal education are less likely than those with a high school diploma or less education to follow local news very closely. While 17% of college graduates say they follow local news very closely, 28% of those with a high school education or less say the same.

And while Americans at all levels of education have become less likely to follow local news, this gap has narrowed in recent years. In 2016, there were 23 percentage points between the highest and lowest education categories (24% vs. 47%), compared with an 11-point difference today.

Black Americans are more likely than people in other racial and ethnic groups to follow local news very closely. But there is virtually no difference on this question between Democrats and Republicans (including those who lean toward each party).

2. Local news topics

Find more updated survey data about local news in our “Local News Fact Sheet” here. 

Local news topics range from useful daily information like weather and traffic, to civic information about local government, crime and the economy, to cultural news about the arts and sports.

A bar chart showing many Americans follow news about local weather, crime, traffic and government

Majorities of Americans say they get news at least sometimes about each of these topics, although weather is the only one followed often by most Americans. Roughly two-thirds of U.S. adults (68%) say they often get news about local weather – double the share who often consume news about crime, the next most common topic.

Those who pay more attention to local news generally are more likely to follow many of these topics. For example, adults 65 and older are more likely to get news about all of these topics than those ages 18 to 29, reflecting the broader difference between the age groups in attention to local news.

There are other differences that hint at how local news needs vary across the U.S. For instance, Americans who live in urban areas are more likely than those in rural areas to say they often get local traffic news (32% vs. 24%). And parents of children under 18 are about twice as likely as those without young children to often get news about local schools (30% vs. 14%).

Midwesterners are more likely than people in other regions to often get news about local sports (29%, vs. 22% or lower in other regions). And in general, Americans who describe themselves as “very attached” to their local community are more likely to say they often get news about all of these topics, reflecting a more general sense of engagement among those with high levels of community connection.

The survey asked respondents who get news about each topic how satisfied they are with the quality of the news they get in that area.

A bar chart showing most local news consumers are not highly satisfied with the news they get about various topics

Weather is the only topic news consumers are highly satisfied about, with 63% of those who get local news about weather saying they are extremely or very satisfied with the news they get on the topic. Among those who get news about local traffic and sports, just over four-in-ten say they are highly satisfied with the news they get (44% and 43%, respectively).

Only about a quarter of those who consume news about the local economy (26%) or local government and politics (25%) say they are extremely or very satisfied with the quality of this news, although about twice as many respondents in each category say they are somewhat satisfied.

3. Sources of local news

Find more updated survey data about local news in our “Local News Fact Sheet” here. 

A line chart showing Americans’ preferred path to local news is moving online

The way Americans get local news is changing, both in terms of which devices they’re using and who is delivering the news.

Television is still the most common way people prefer to get their local news, but it is no longer dominant as digital pathways to news continue to rise.

About a third of U.S. adults (32%) say they prefer to get their local news via television, a decline from 41% in 2018. Meanwhile, the share who prefer to get local news from social media has increased, from 15% in 2018 to 23% today. And roughly a quarter of adults (26%) say they prefer to use news websites. Combined, about half of U.S. adults prefer to get news through one of these digital platforms – even if the content they’re getting may be coming from traditional media outlets with an online presence.

Fewer Americans prefer print newspapers and radio for local news (9% each). The share who say they prefer print newspapers has dropped by 4 percentage points in the last six years.

Americans’ changing local news providers

A bar chart showing as traditional outlets decline, more Americans are turning to online forums (such as Facebook) and other online-only sources for local news

In addition to the technologies being used to access local news, the organizations and specific sources where people are getting local news also are evolving.

The share of Americans who say they often or sometimes get local news and information from daily newspapers has dropped from 43% in 2018 to 33% today – putting newspapers on par with government agencies as a source of local news. About twice as many people say they at least sometimes get news from local TV stations (64%), but this also represents a drop from 70% six years ago. 

The two types of sources that have seen the most substantial growth are primarily digital by nature.

The share of U.S. adults who at least sometimes get news from online forums like Facebook groups increased from 38% in 2018 to 52% in 2024. More people also are getting news from online-only sources that aren’t included in any of the other categories (up from 15% in 2018 to 33% this year).

If respondents said they got news from one of these sources, we asked them to name (in their own words) a specific source they were thinking of as “online-only.” Respondents cited a variety of different types of sources, reflecting the complexity of the ever-changing online information environment.

Some people mentioned local websites and blogs, local news aggregator apps (such as NewsBreak), and specific Facebook groups and Instagram accounts. Others had more general responses such as social media sites more broadly (simply “Facebook”), search engines and online portals (such as Google or MSN), and outlets that cover more national news (e.g., CNN or Breitbart).

A bar chart showing Americans no longer access local newspapers primarily through print

Growth in digital access extends to traditional news sources

The impact of digital technology is visible through how people access two more traditional sources of local news: daily newspapers and TV stations.

Many of these outlets now offer news not only in their original format (print and broadcast TV), but through websites and social media feeds as well. For example, among Americans who say they get news from local TV stations, a majority (62%) still say they primarily access it on a television, but 37% say they mainly access that information online – whether from a TV station’s website, app, email newsletter or social media posts.

Among those who get news from local daily newspapers, just 31% access it primarily via their print version. About two-thirds of those who get news from local daily papers (66%) primarily access them online, including 41% who say they use websites or apps and 25% who say they use social media.

How Americans access each of these types of outlets is becoming more digital. In 2018, people were more likely to access both local TV and newspapers via their original analog form: 76% of local TV consumers said they primarily accessed that news on TV, and 54% of daily newspaper users said they mostly used the print format.

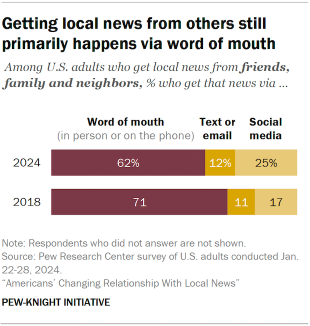
A bar chart showing getting local news from others still primarily happens via word of mouth

Even the way that people get information from friends and family shows signs of change.

A majority of Americans say they often (18%) or sometimes (55%) get local news from other people in their community, such as friends, family or neighbors. In 2018, a slightly smaller share said they got local news this way often (17%) or sometimes (49%).

News from friends, family and neighbors is still most often shared by word of mouth (i.e., in person or on the phone), but it is increasingly likely to be shared on social media. ­Among those who get local news from people in their community, 25% now say that primarily happens on social media, up from 17% in 2018.

Americans’ awareness of the outlets covering their local area

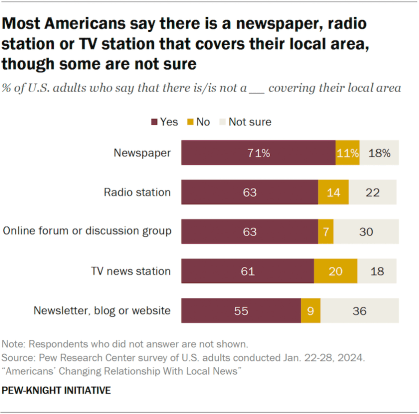
A bar chart showing most Americans say there is a newspaper, radio station or TV station that covers their local area, though some are not sure

How Americans access their local news first depends on whether they have local outlets available to them – and not everyone does. Others aren’t aware if there are specific types of sources that cover their local area.

We asked Americans whether or not there are newspapers, radio stations, online forums, TV news stations, or newsletters or blogs that cover their local area. For all five types of sources, more than half of Americans say there is at least one of these covering their area, although more say this about newspapers (71%) than other types of sources.

In each case, some respondents say their area doesn’t have a certain type of news outlet. For instance, 20% of respondents say their area doesn’t have a TV station, 14% say there is no radio station and 11% say their area doesn’t have a local newspaper.

In addition, substantial shares say they are not sure whether their area has each type of source, including 30% who aren’t sure if there is an online news forum in their area and 36% who aren’t sure if there is a local newsletter, blog or website.

A bar chart showing rural Americans are less likely to say there is a TV station covering their area

Some of this availability is connected to where respondents live – especially for local television stations. Americans who live in rural areas are much less likely to say there is a TV station covering their local area – 49% say there is, vs. 64% of those living in suburban areas and 70% of those in urban areas.

About a third of rural Americans (34%) say they do not have a TV station that covers their area, and 16% say they are not sure. By contrast, 17% of those in the suburbs and 10% of those in urban areas say there is no local TV station.

Americans in the suburbs, on the other hand, stand out for being more likely to say there are online forums or discussion groups (such as on Facebook or Nextdoor) in their local area. About seven-in-ten suburban Americans (69%) say there is at least one of these types of groups, compared with 55% of urban and 59% of rural Americans who say the same.

4. Views of local news

Find more updated survey data about local news in our “Local News Fact Sheet” here. 

Despite declining public attention to local news, many Americans express positive feelings about their local news media.

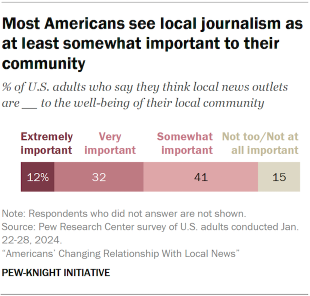
A bar chart showing most Americans see local journalism as at least somewhat important to their community

For instance, most U.S. adults (85%) believe local news outlets are at least somewhat important to the well-being of their local community, including 44% who say they are extremely or very important.

Those who feel more attached to their local communities are especially likely to hold this view: Around two-thirds of Americans who feel very attached to their communities (66%) see local news outlets as extremely or very important, compared with around a third (31%) of those who feel not very or not at all attached.

Older adults also are more likely to perceive local journalism as important to their community. Around half of U.S. adults ages 50 and older (51%) say local news outlets are extremely or very important, compared with 38% of adults under 50 – including 34% of those ages 18 to 29.

How people feel about their local news media’s performance

Most U.S. adults also think their local news media are doing their jobs well in several areas – largely unchanged from 2018.

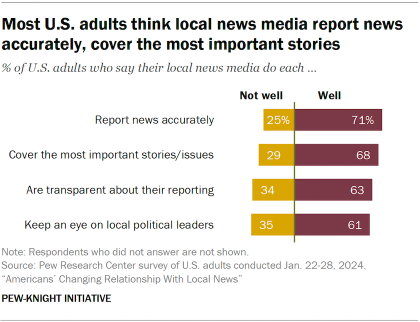
A bar chart showing most U.S. adults think local news media report news accurately, cover the most important stories

About seven-in-ten Americans say their local journalists are doing a good job of reporting news accurately (71%) and covering the most important stories and issues (68%). People are modestly less likely to believe their local news media are performing well at being transparent about their reporting (63%) and keeping an eye on local political leaders (61%). The share who say local media are doing well as political watchdogs is down slightly from 66% in 2018.

About a third of U.S. adults say their local news media are not doing well at keeping an eye on local political leaders (35%) or being transparent about their reporting (34%).

A bar chart showing Democrats modestly more likely than Republicans to give local media positive assessment

Democrats (including independents who lean toward the Democratic Party) are somewhat more likely than Republicans and GOP leaners to say their local journalists report news accurately, are transparent about their reporting, keep an eye on local political leaders and cover the most important stories and issues, although majorities in both parties hold these views.

There have been no major changes since 2018 when it comes to differences between the two major political parties in views toward local media. Past research has found a much larger partisan divide in views toward national news organizations, with Republicans expressing much more negative opinions.

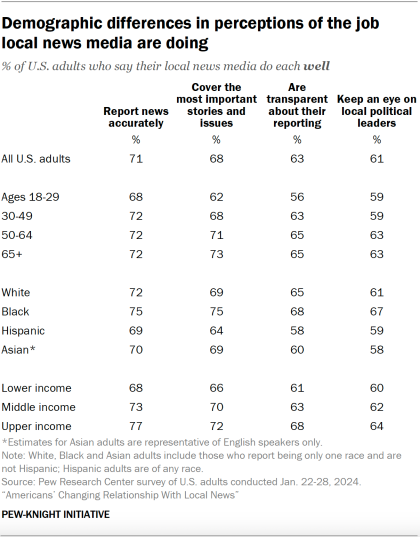
There are a few other demographic differences in views of the job local media are doing:

A table showing demographic differences in perceptions of the job local news media are doing
  • Black Americans are slightly more likely than all other racial and ethnic groups to say their local news media are doing well at keeping an eye on local political leaders (67%) and covering the most important stories and issues (75%).
  • U.S. adults ages 18 to 29 are modestly less likely than other age groups to say local news outlets are transparent about their reporting (56%) or cover the most important stories and issues (62%).
  • Lower-income Americans are less likely than upper-income Americans to say their local journalists are good at reporting news accurately (68% vs. 77%).
  • Those who say they are very attached to their local community are more likely to give their local media high marks on all these measures – for instance, 74% of this group say their local media do well at being transparent about their reporting, versus 54% of those who say they are not very or not at all attached to their community.
A bar chart showing younger people, Democrats more likely to say local journalists should advocate for change in community

Views of neutrality vs. advocacy in local news

One traditional journalistic value that has been the subject of recent debate is neutrality.

Most Americans (69%) say local journalists should remain neutral on issues in their communities. But 29% say local journalists should advocate for change in their communities, with some demographic groups especially likely to hold this view:

  • Younger people: Around four-in-ten U.S. adults ages 18 to 29 (39%) say local journalists should advocate for change in the community, compared with two-in-ten of those ages 65 and older.
  • Black, Hispanic and Asian Americans: Black (44%), Hispanic (40%) and Asian Americans (35%) are more likely to support journalists advocating for change in their communities than White Americans (22%).
  • Democrats: Democrats and Democratic-leaning independents are nearly twice as likely as Republicans and Republican leaners to say local journalists should advocate for change (37% vs. 20%).
  • Lower-income Americans: About a third of lower-income Americans (36%) say local journalists should advocate for change, compared with 26% of middle-income and 22% of upper-income Americans.
  • City dwellers: Urban residents (38%) are more likely than people in suburban (28%) or rural (23%) areas to say local journalists should advocate for change in their communities.

Most Americans think local journalists are in touch with their communities

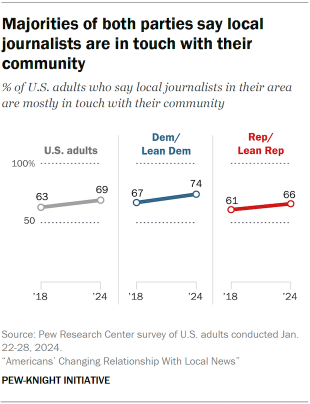
A line chart showing majorities of both parties say local journalists are in touch with their community

Americans are far more likely to say local journalists in their area are mostly in touch (69%) rather than out of touch (28%) with their local community. The share of U.S. adults who say local journalists are in touch with their community has increased slightly since 2018, from 63%.
Democrats (74%) remain modestly more likely than Republicans (66%) to say local journalists are in touch with their community, with small increases within both parties since 2018.

There are only slight age differences on this question. About two-thirds of Americans ages 18 to 29 (65%) say local journalists are mostly in touch with their community, as do 69% of those ages 30 to 49 and 50 to 64, and 72% of those 65 and older.

Interactions with local journalists

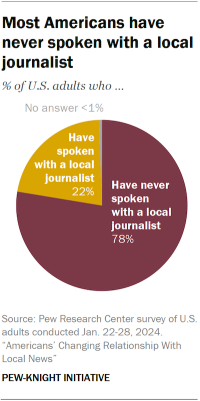
A pie chart showing most Americans have never spoken with a local journalist

Even though most Americans say local journalists in their area are in touch with their community, about three-quarters (78%) say they have never spoken with or been interviewed by a local journalist. This is consistent with past years: In 2018, an identical share said they had never spoken with a local journalist, and 74% said the same in 2016.

Americans with a postgraduate degree (29%) are more likely to have spoken with a local journalist than those at all other education levels. Around one-in-five U.S. adults with a bachelor’s degree (22%), some college (21%) or high school or less (19%) say the same.

Also, a slightly larger share of men (24%) than women (19%) say they have talked to a local journalist.

Those who feel very attached to their communities (36%) are more likely to have spoken to or been interviewed by a local journalist than those who feel somewhat attached (21%) or not very or not at all attached (16%).

5. Americans’ views on the financial health of local news

Find more updated survey data about local news in our “Local News Fact Sheet” here. 

A majority of Americans say they think their local news outlets are doing very or somewhat well financially. However, this share has decreased somewhat in recent years.

A bar chart showing the share of Americans who think their local news outlets are doing well financially has decreased since 2018

Today, 63% of U.S. adults say they think their local news outlets are doing very or somewhat well financially; 71% said the same in 2018, the last time we asked this question.

This change may be linked with real downward trends in the local news industry. Audiences for traditional local news media, including local TV stations and newspapers, have decreased in recent years. And newspaper revenue has been on a steep decline, although economic conditions for local TV, radio and digital news have been more mixed.

A bar chart showing Americans with more education have become less likely to say their local news outlets are doing well financially

One of the biggest changes on this question has been among Americans with higher levels of education. About half of college graduates (52%) now say their local news organizations are doing very or somewhat well, down 13 percentage points from 65% in 2018. Those with a high school education or less, on the other hand, are about as likely as they were in 2018 to say their local news organizations are doing well financially (72% in 2024, 73% in 2018).

Americans who prefer to get their local news from television are more likely than others to think their local outlets in general are doing well. But those who prefer news websites, radio and print for local news are less likely to say this.

A bar chart showing those who prefer to get their local news on TV are most likely to say their local outlets are doing well

Although respondents were asked about the financial status of their local news outlets in general (and not just the platform they prefer), this nevertheless may reflect real economic conditions across different segments of the local news industry. Revenue has declined across some platforms, including daily newspapers, but local TV news stations have remained relatively stable in this regard.

Vast majority of Americans don’t pay for local news

A bar chart showing 15% say they have paid or given money to a local news source in the past year

The survey also asked respondents whether they had paid or given money to any local news source in the past year – whether by subscribing, donating or becoming a member. An overwhelming majority of Americans (85%) say no, while 15% say yes. These shares have not changed much since 2018, when 84% said no and 14% said yes.

A bar chart showing many say they don’t pay for local news because there are free sources available; others cite lack of interest

Those who say they have not paid for local news in the past year were asked about the main reason they don’t pay. About half (49%) say there are plenty of free alternatives. Three-in-ten cite a lack of interest in local news, while 10% say the news is not good enough to pay for and 8% say it’s too expensive.

A bar chart showing young adults more often say they don’t pay for local news because they are not interested

Americans’ reasons for not paying for local news vary based on age. Among U.S. adults ages 30 and older who have not paid for local news in the past year, the most common reason they cite is that they can find plenty of free local news.

But the most common reason given by Americans ages 18 to 29 is a lack of interest: 46% in this group say the main reason they don’t pay for local news is that they are not interested enough in it, while 37% say there are enough free alternatives.

Overall, 47% of adults under 30 say they follow local news very or somewhat closely, compared with 83% of those 65 and older.

Acknowledgments

This is a Pew Research Center report from the Pew-Knight Initiative, a research program funded jointly by The Pew Charitable Trusts and the John S. and James L. Knight Foundation. Find related reports online at https://alpha.pewresearch.org/pewresearch-org/pew-knight/.

Research

Elisa Shearer, Senior Researcher
Michael Lipka, Associate Director, News and Information Research
Katerina Eva Matsa, Director, News and Information Research
Kirsten Eddy, Senior Researcher
Naomi Forman-Katz, Research Analyst
Luxuan Wang, Research Associate
Sarah Naseer, Research Assistant
Christopher St. Aubin, Research Assistant                          

Editorial and Graphic Design

David Kent, Senior Copy Editor
Kaitlyn Radde, Associate Information Graphics Designer
Peter Bell, Associate Director, Design and Production
Andrea Caumont, Associate Director, Digital Outreach

Communications and Web Publishing

Sogand Afkari, Communications Manager
Maya Pottiger, Communications Associate 
Justine Coleman, Associate Digital Producer

In addition, the project benefited greatly from the guidance of the Pew Research Center methodology team: Courtney Kennedy, Andrew Mercer, Ashley Amaya, Dorene Asare-Marfo, Dana Popky, Anna Brown and Arnold Lau.

Methodology

The American Trends Panel survey methodology

Overview

The American Trends Panel (ATP), created by Pew Research Center, is a nationally representative panel of randomly selected U.S. adults. Panelists participate via self-administered web surveys. Panelists who do not have internet access at home are provided with a tablet and wireless internet connection. Interviews are conducted in both English and Spanish. The panel is being managed by Ipsos.

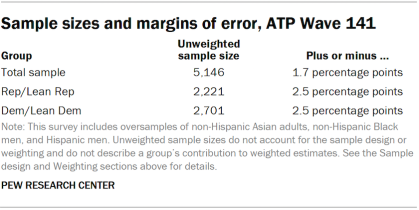
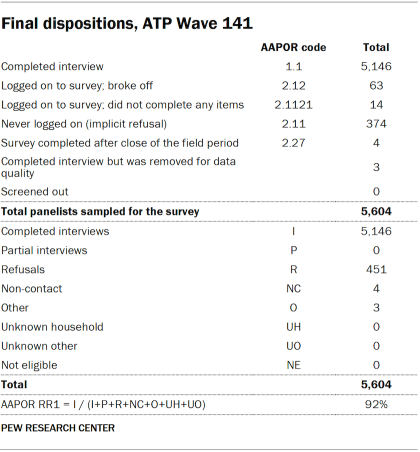
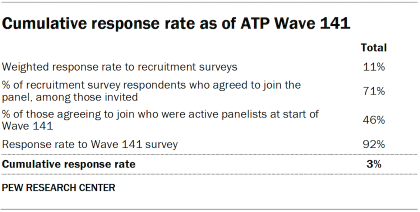
Data in this report is drawn from ATP Wave 141, conducted from Jan. 22 to 28, 2024, and includes an oversample of non-Hispanic Asian adults, non-Hispanic Black men and Hispanic men in order to provide more precise estimates of the opinions and experiences of these smaller demographic subgroups. These oversampled groups are weighted back to reflect their correct proportions in the population. A total of 5,146 panelists responded out of 5,604 who were sampled, for a response rate of 92%. The cumulative response rate accounting for nonresponse to the recruitment surveys and attrition is 3%. The break-off rate among panelists who logged on to the survey and completed at least one item is 1%. The margin of sampling error for the full sample of 5,146 respondents is plus or minus 1.7 percentage points.

This is a Pew Research Center report from the Pew-Knight Initiative, a research program funded jointly by The Pew Charitable Trusts and the John S. and James L. Knight Foundation. Find related reports online at https://alpha.pewresearch.org/pewresearch-org/pew-knight/.

Panel recruitment

The ATP was created in 2014, with the first cohort of panelists invited to join the panel at the end of a large, national, landline and cellphone random-digit-dial survey that was conducted in both English and Spanish. Two additional recruitments were conducted using the same method in 2015 and 2017, respectively. Across these three surveys, a total of 19,718 adults were invited to join the ATP, of whom 9,942 (50%) agreed to participate.

In August 2018, the ATP switched from telephone to address-based sampling (ABS) recruitment. A study cover letter and a pre-incentive are mailed to a stratified, random sample of households selected from the U.S. Postal Service’s Delivery Sequence File. This Postal Service file has been estimated to cover as much as 98% of the population, although some studies suggest that the coverage could be in the low 90% range.1

A table showing the American Trends Panel recruitment surveys

Within each sampled household, the adult with the next birthday is asked to participate. Other details of the ABS recruitment protocol have changed over time but are available upon request.2

We have recruited a national sample of U.S. adults to the ATP approximately once per year since 2014. In some years, the recruitment has included additional efforts (known as an “oversample”) to boost sample size with underrepresented groups. For example, Hispanic adults, Black adults and Asian adults were oversampled in 2019, 2022 and 2023, respectively.

Across the six address-based recruitments, a total of 23,862 adults were invited to join the ATP, of whom 20,917 agreed to join the panel and completed an initial profile survey. Of the 30,859 individuals who have ever joined the ATP, 11,927 remained active panelists and continued to receive survey invitations at the time this survey was conducted.

The American Trends Panel never uses breakout routers or chains that direct respondents to additional surveys.

Sample design

The overall target population for this survey was noninstitutionalized persons ages 18 and older living in the U.S., including Alaska and Hawaii. It featured a stratified random sample from the ATP in which Hispanic men, non-Hispanic Black men and non-Hispanic Asian adults were selected with certainty. The remaining panelists were sampled at rates designed to ensure that the share of respondents in each stratum is proportional to its share of the U.S. adult population to the greatest extent possible. Respondent weights are adjusted to account for differential probabilities of selection as described in the Weighting section below.

Questionnaire development and testing

The questionnaire was developed by Pew Research Center in consultation with Ipsos. The web program was rigorously tested on both PC and mobile devices by the Ipsos project management team and Pew Research Center researchers. The Ipsos project management team also populated test data that was analyzed in SPSS to ensure the logic and randomizations were working as intended before launching the survey.

Incentives

All respondents were offered a post-paid incentive for their participation. Respondents could choose to receive the post-paid incentive in the form of a check or a gift code to Amazon.com or could choose to decline the incentive. Incentive amounts ranged from $5 to $20 depending on whether the respondent belongs to a part of the population that is harder or easier to reach. Differential incentive amounts were designed to increase panel survey participation among groups that traditionally have low survey response propensities.

Data collection protocol

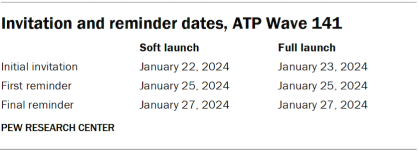
The data collection field period for this survey was Jan. 22 to Jan. 28, 2024. Postcard notifications were mailed to a subset of ATP panelists with a known residential address on Jan. 22.3

Invitations were sent out in two separate launches: soft launch and full launch. Sixty panelists were included in the soft launch, which began with an initial invitation sent on Jan. 22. The ATP panelists chosen for the initial soft launch were known responders who had completed previous ATP surveys within one day of receiving their invitation. All remaining English- and Spanish-speaking sampled panelists were included in the full launch and were sent an invitation on Jan. 23.

All panelists with an email address received an email invitation and up to two email reminders if they did not respond to the survey. All ATP panelists who consented to SMS messages received an SMS invitation and up to two SMS reminders.

A table showing the invitation and reminder dates, ATP Wave 141

Data quality checks

To ensure high-quality data, the Center’s researchers performed data quality checks to identify any respondents showing clear patterns of satisficing. This includes checking for whether respondents left questions blank at very high rates or always selected the first or last answer presented. As a result of this checking, three ATP respondents were removed from the survey dataset prior to weighting and analysis.

Weighting

A table showing the American Trends Panel weighting dimensions

The ATP data is weighted in a multistep process that accounts for multiple stages of sampling and nonresponse that occur at different points in the survey process. First, each panelist begins with a base weight that reflects their probability of selection for their initial recruitment survey. These weights are then rescaled and adjusted to account for changes in the design of ATP recruitment surveys from year to year. Finally, the weights are calibrated to align with the population benchmarks in the accompanying table to correct for nonresponse to recruitment surveys and panel attrition. If only a subsample of panelists was invited to participate in the wave, this weight is adjusted to account for any differential probabilities of selection.

Among the panelists who completed the survey, this weight is then calibrated again to align with the population benchmarks identified in the accompanying table and trimmed at the 2nd and 98th percentiles to reduce the loss in precision stemming from variance in the weights. This trimming is performed separately among non-Hispanic Black, non-Hispanic Asian, Hispanic and all other respondents. Sampling errors and tests of statistical significance take into account the effect of weighting.

The following table shows the unweighted sample sizes and the error attributable to sampling that would be expected at the 95% level of confidence for different groups in the survey.

A table showing sample sizes and margins of error, ATP Wave 141

Sample sizes and sampling errors for other subgroups are available upon request. In addition to sampling error, one should bear in mind that question wording and practical difficulties in conducting surveys can introduce error or bias into the findings of opinion polls.

Dispositions and response rates

A table showing the final dispositions, ATP Wave 141
A table showing the cumulative response rate as of ATP Wave 141