Pew Research Center

FOR RELEASE DECEMBER 8, 2020

Measuring News Consumption in a Digital Era

As news outlets morph and multiply, both surveys and passive data collection tools face challenges

BY Michael Barthel, Amy Mitchell, Dorene Asare-Marfo, Courtney Kennedy and Kirsten Worden

FOR MEDIA OR OTHER INQUIRIES:

Communications Department
202.419.4372
www.pewresearch.org

RECOMMENDED CITATION

Pew Research Center, December 2020, "Measuring News Consumption in a Digital Era"

About Pew Research Center

Pew Research Center is a nonpartisan, nonadvocacy fact tank that informs the public about the issues, attitudes and trends shaping the world. It does not take policy positions. The Center conducts public opinion polling, demographic research, computational social science research and other data-driven research. It studies politics and policy; news habits and media; the internet and technology; religion; race and ethnicity; international affairs; social, demographic and economic trends; science; research methodology and data science; and immigration and migration. Pew Research Center is a subsidiary of The Pew Charitable Trusts, its primary funder.

© Pew Research Center 2026

Table of contents

  • About Pew Research Center
  • Measuring News Consumption in a Digital Era
  • 1. The American public shows mixed familiarity with new and evolving forms of news
  • 2. Assessing different survey measurement approaches for news consumption
  • 3. The promise and pitfalls of using passive data to measure online news consumption
  • Appendix: Additional guidance on using surveys to measure news consumption
  • Detailed tables
  • Acknowledgments
  • Methodology

Measuring News Consumption in a Digital Era

As news outlets morph and multiply, both surveys and passive data collection tools face challenges

How we did this

This report is the culmination of a yearlong study into Americans’ news consumption habits in an era of rapidly evolving media technology and a look at how researchers can measure those news habits. This report was made possible by The Pew Charitable Trusts, which received support from the John S. and James L. Knight Foundation. Findings from this study are drawn from four major data collection efforts. See full study methodology for details.

First, cognitive interviews were conducted through RTI International in late February and early March 2020. These interviews were designed to obtain qualitative feedback on proposed survey questions and to gain preliminary, in-depth knowledge about the public’s understanding of emerging concepts around news consumption in a digital age. Some lightly edited quotations are included in the report. Second, survey experiments, conducted through Ipsos’ KnowledgePanel “omnibus” surveys on April 17-19 and April 24-25, 2020, were used to test different approaches to measuring news consumption. These questions emerged from discussions with experts in the field as well as data from the cognitive interviews. Topline results from these survey experiments are available here.

Later, the digital activity of Ipsos KnowledgePanel members who gave their consent to participate was recorded from May 16, 2020 to June 15, 2020 via a tracker from RealityMine® that they installed on their mobile devices and/or personal computer (PC). Researchers could then identify how frequently they engaged in various activities around media and news. Finally, survey data were used to compare with the passive data and to analyze Americans’ awareness of different aspects of media and news. This data are pulled from a survey of U.S. adults conducted June 2-11 on Ipsos’ KnowledgePanel. In all, 3,715 panelists took this survey. Survey data for 1,694 of the panelists were used only for comparison with their online activity as recorded in the passive data, while the remaining 2,021 survey respondents did not have their activity tracked and make up the representative general population sample from which survey results are reported. Topline results for this survey are available here.

Terminology

This study explored Americans’ news consumption across various types of sources. Overall, this report provides a sense of how Americans understand questions about news consumption in the digital age and different ways researchers can measure online news habits. Here are some definitions of key terms used throughout this report:

  • Platform: The medium through which news is consumed. Specifically, this report looks at television, radio, print publications, digital devices (smartphones, computers or tablets) and various online sources (news websites or apps, social media, search engines, podcasts and email newsletters).
  • Digital platform: News platforms that require someone to use digital technology to consume news content, such as a smartphone or news website.
  • Analog platform: Platforms that are not digital, such as a television set, radio or print newspaper.
  • Provider: The type of news organization producing news stories. Specifically, this report looks at daily newspapers; cable, local and network TV news; and public and talk radio. (Network TV news includes national news programs airing on the broadcast networks of ABC, CBS, NBC, and PBS [e.g., World News Tonight].)
  • New platforms: A newer type of digital platform that consumers can use to access news. Specifically, this report looks at smart speakers, streaming devices (such as a Roku or Fire Stick), smartwatches, push notifications or alerts and internet streaming services (such as Netflix or Hulu).
  • News aggregator: A digital news platform that collects news content from existing news organizations and presents them in a single location online. Specifically, this report looks at Google News, Apple News, Flipboard and Pocket.
  • Original news reporting: The process where journalists directly consult primary sources in order to develop news content. This is distinguished from aggregation of news from other sources.
  • Passive data: Data on participants’ online activity, such as browsing history and links clicked on, which was collected by a tracking software that panelists downloaded to their digital devices, and that automatically tracked their online behaviors.
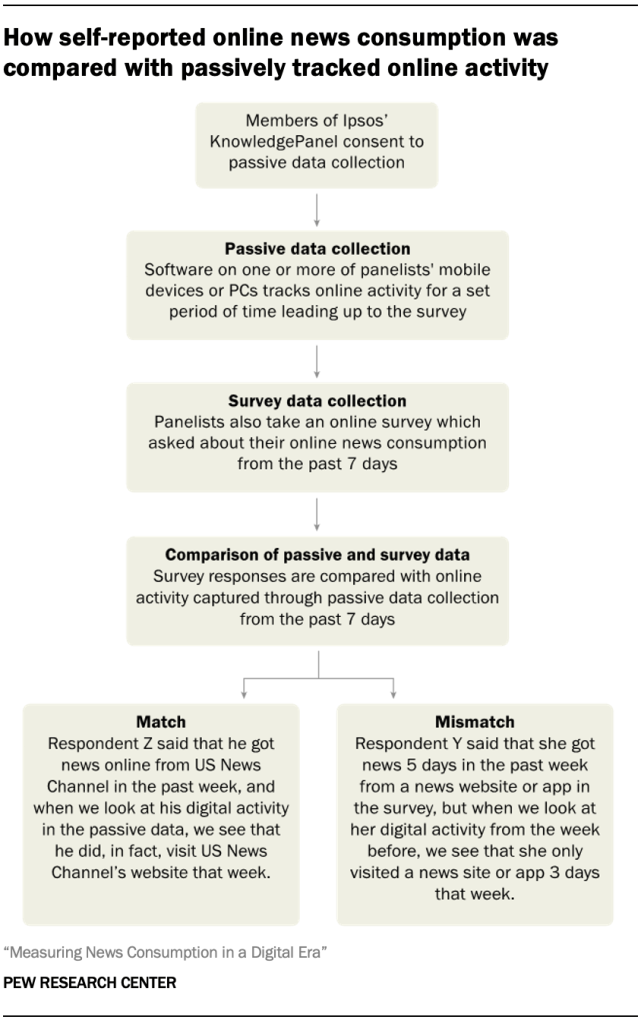
  • Match/mismatch: After having their digital activity tracked for a period of time, participants took a survey that asked about their online news consumption habits. Researchers then compared their responses to these survey questions with the participants’ online activity as captured in the passive data. A “match” occurred if a panelist said they got news a certain number of times in the survey and was also observed getting news that number of times in their passive data. A “mismatch” occurred if a panelist said they got news a certain number of times in the survey but was observed getting news less often in their passive data.
Testing different ways of asking about news consumption

The news media’s transition to digital has brought major upheaval to the industry – including a multitude of new providers and ways to get to news. And just as American news organizations have had to drastically reevaluate their business models, it would make sense that researchers who are trying to measure the U.S. public’s news consumption also need to reexamine the traditional ways they have done so.

In the mid-20th century, when media research came into its own, this task was more straightforward. There were only a few different ways to get news, and all were clearly distinct – print publications, radio or television. But over the past decades, in addition to a plethora of new forms of news (from 24-hour news channels to news websites), many news outlets no longer stay confined to producing content on only one platform. For instance, to meet the growing digital audience, newspapers like The New York Times also produce audio podcasts, which can be heard on radio stations through a smart speaker, and video series, which can be seen on a cable TV network through a streaming device (such as a Roku or Fire Stick). And cable news outlets and other news providers have an active presence on Facebook, YouTube and other social media sites, further blurring the line between platforms. Finally, there is an industry-wide concern that news consumption habits are overestimated in surveys where respondents self-report their behavior.

Given the increasing complexity and interconnectedness of this news landscape and concerns around overreporting of news consumption, Pew Research Center wanted to explore how best to measure news consumption: Where do currently used survey practices still work and where might changes be in order?

This report is the culmination of this effort and is organized into three sections: Chapter 1 looks at the U.S. public’s familiarity with newer concepts related to news; Chapter 2 examines possible ways to improve survey-based measures of news consumption; and Chapter 3 compares survey results to the use of passive data that comes straight from tracking software news consumers downloaded to their digital devices.

Americans are largely familiar with new technologies but often don’t think of them as news sources
Americans are familiar with new digital platforms, but few use them for news

In the survey of U.S. adults, there is mixed evidence about the public’s understanding of newer forms of media and news, which has an impact on the topics survey researchers can reasonably ask about. U.S. adults are broadly familiar with technologies like streaming devices or services, podcasts and news alerts. At the same time, though, many do not seem to use most of these for news consumption, and results from the cognitive interviews suggest that many do not even think of these new forms as ways to get news.

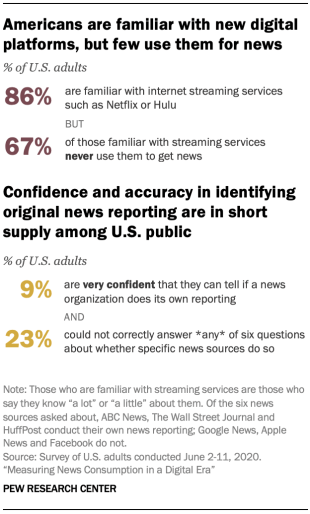
Additionally, as news consumers navigate an information environment that includes news aggregators and social media feeds, confusion abounds regarding the original source of reporting. Only 9% of U.S. adults are very confident that they can tell if a news organization does its own reporting, and, when asked to identify which of six sources do this (See Chapter 1), nearly a quarter (23%) could not identify any of them correctly.

Finally, in an era of rapidly changing business models for news organizations, this study finds a need for survey researchers to carefully specify what they mean by “paying for news.” When asked generally if they pay for news, many people do not seem to think of specific ways that they do pay for news – not to mention the large chunk of Americans who indirectly pay for news, such as through a cable TV subscription.
Survey approaches tested for measuring news consumption

Possible ways to improve survey questions about news consumption

The findings reveal that, while there is no “silver bullet” for perfect survey measures of news consumption, a series of refinements could drive marginal improvements – such as around the goal of reducing overreporting.

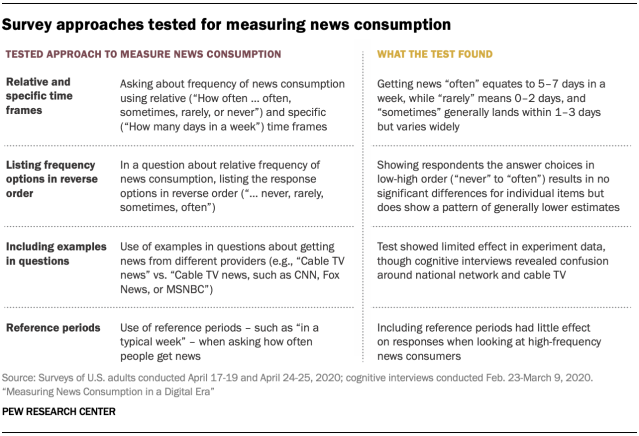
The study tested a number of concepts, including adding a reference period – e.g., “In the past week, how many days did you get news from …” – or examples – e.g., “Daily newspapers (such as The New York Times, Wall Street Journal, or your local daily paper)” – to core survey questions about news consumption. The study found that these two changes largely do not affect estimates of news consumption among the U.S. public overall, although they may make important differences for specific platforms. For instance, a specific reference period appears to get more accurate measures of radio consumption, and examples may help respondents to better understand what is meant by national network TV outlets, which were often confused with cable TV news in cognitive interviews.

Moreover, the study finds that, when asking about how often people consume news, showing the response options in low-to-high order (i.e., starting with “never” and working up to “often,” rather than the reverse) produces no significant differences on individual items but did show a pattern of generally lower estimates of news consumption. And while there is a close correspondence between respondents saying they get news “often” or “rarely” and saying they do so a specific number of days per week, a response of “sometimes” is used to indicate a wide range of news consumption habits. In other words, to one respondent, “sometimes” can mean once a week, and to another, it could mean three times a week or more.

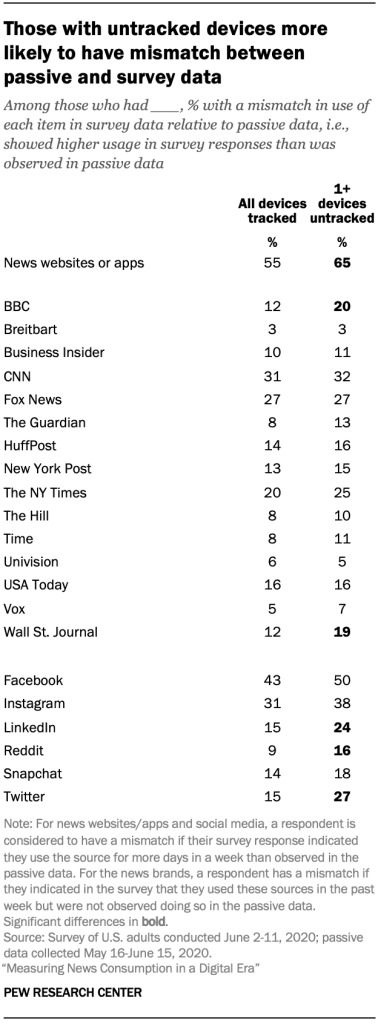
An exploration of the potential to use passive data, gained from software people download to record their activities online, as a direct measurement of the public’s digital news habits – free of the concerns with self-reporting inherent to surveys – shows some promise. Yet there are still too many pitfalls to rely on it for a complete portrait of Americans’ digital news consumption. Estimates coming in from passive data are systematically lower than those from survey questions, with inadequate coverage of devices being one apparent culprit: Most of the respondents who agreed to have their news consumption tracked said that they had additional devices that were not being tracked, and so some of their news consumption was likely not captured.

That is not the only possible issue with passive data, which generally cannot track in-app news consumption (e.g., when someone taps on a link to a news story within a social media app). And a similar measurement from a commercial metrics provider comes in even higher than the estimates from the survey data. This points to one strength of the survey approach: its sources of error are consistent, well-studied, and widely understood, while the sources of error in passive data are, at present, unclear, dependent on the specifics of data collection, and difficult to adjust for.

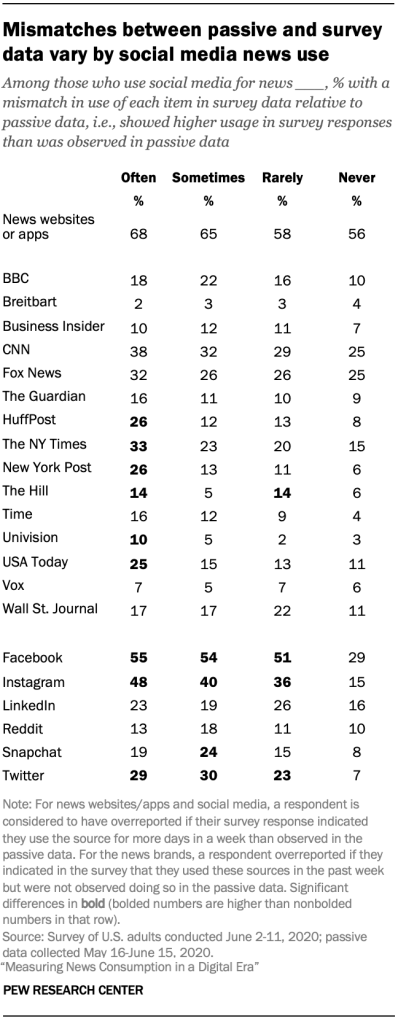
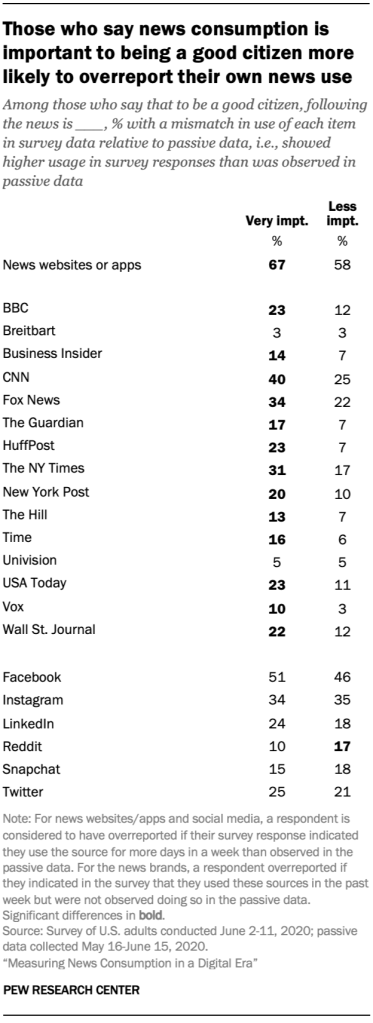
Survey-based measurement of news consumption is not without its own problems – perhaps foremost among them is people’s tendency to exaggerate their news consumption, consciously or not. The study finds strong evidence of this: Many Americans say that following the news is “very important” to being a good citizen, and those who say this are more likely than others to overestimate their news consumption when their survey responses are compared with passive data tracked on their devices. This suggests that following the news is seen as a “socially desirable” behavior by many people, which may lead them to think aspirationally about their news consumption – i.e., how often they ideally intend to consume the news rather than how often they actually do – when answering survey questions about it.

When it comes to measuring news consumption, tracking respondents’ digital devices does not capture all of their online activity

Still, overall, this yearlong research effort reveals the continued value of survey research – both in and of itself and compared with other options – and indicates ways to further improve data quality. The strength of survey research stands out in particular for the purpose of providing comprehensive and comparable tracking of the public’s news consumption habits over time and capturing a representative slice of the full U.S. adult population as well as demographic subgroups. Further, surveys allow the measurement of multiple different forms of news consumption (not just digital) in the same way, at the same time – and across time. Passive data has useful applications in the consumer world and can be a tool for publishers and others who want a fine-grained picture of user behavior. But the data does not, at present, seem well suited for high-level estimates of news consumption.

It is worth noting that Pew Research Center’s own organizational expertise in survey work may incline its researchers toward a more enthusiastic endorsement of that methodology. But the Center has also long explored and produced news consumption research using other types of data collection, such as tracking the social media habits of a representative sample of U.S. adults, tracking activity in public social media spaces around certain topics, studying aggregated search behavior around news events and making use of commercial metrics. The Center, particularly in the area of news research, looks forward to continuing to explore new data opportunities and further developments of those that have already become available. As we put it on our website: “We continue to search for ways to expand and strengthen the traditional methodologies that underlie survey research and to explore the potential of alternate methods of conducting surveys and measuring public opinion.”

Data sources and methods

This study took a multimodal approach to investigating these questions, drawing on cognitive interviews, split-form survey experiments, comparisons between passive data and self-reported survey data and a full, nationally representative survey. The details of each are provided briefly below.

After an initial round of brainstorming and testing, the formal process began with cognitive interviews conducted among 21 respondents through RTI International. The aim was to get qualitative feedback on the proposed survey questions and to gain some preliminary knowledge on the public’s understanding of emerging concepts around news consumption in a digital age. After RTI staff conducted an expert review of the questionnaire, respondents took a draft version of the full news consumption questionnaire and were probed to talk through their responses, along with some specific probes asking about their understanding of key concepts. These results are included throughout the report for additional context for some findings.

Survey experiments were then conducted on two separate Ipsos KnowledgePanel surveys in April 2020, with roughly 1,000 respondents per survey split randomly across two different forms. The aim was to test different approaches to measuring news consumption (e.g., half were asked how often they get news on television, and half were asked how often in a typical week they get news on television) and to determine which version of certain questions would best reduce the overall incidence of reported news consumption, in light of research that has identified potential overreporting of news consumption in surveys.1 These results can primarily be found in Chapter 2.

Finally, 3,715 members of Ipsos’ KnowledgePanel responded to a custom national survey fielded June 2-11, 2020. Approximately half (N=1,694) had previously consented to have their digital activity tracked on one or more devices. This passive data was compared with their self-reported data from the survey. For instance, they were asked if they used the website or app of The New York Times in the past week, and this was compared with the records of their digital activity. In addition, these passively monitored panelists were compared with the general population sample to help understand the potential for using passive data to measure news consumption. These results can be found in Chapter 3.

The remaining 2,021 respondents were a nationally representative general population sample of U.S. adults who completed the survey, from which data is mainly being used for general point estimates and over-time trend comparisons. Their results can be found in Chapter 1. All respondents took the survey online. Home internet access was provided to adults who did not previously have it during panel recruitment.

For more details, see the methodology.
1. The American public shows mixed familiarity with new and evolving forms of news

One major challenge researchers may encounter in designing surveys about news consumption: Does the U.S. public understand the range of concepts being measured – concepts that are constantly evolving as news organizations adapt to the ever-changing digital landscape?

This chapter examines this question from several angles, including the public’s overall familiarity with – and use of – new digital forms of news consumption. The results show that most Americans are familiar enough with newer digital devices and services to answer questions about them in a survey, though the adoption of most of these technologies for news consumption remains quite low.

Most U.S. adults also do not report regularly using several top news aggregators, and Americans largely do not know whether some of these aggregators do their own original news reporting. Even when it comes to more traditional news organizations, there is limited knowledge about where news reporting originates. Americans are, at least, largely accurate in self-assessments of their news source literacy: Many express little confidence in their ability to identify original reporting.

The analysis finds that the vast majority of Americans say they have not paid for news in the past year. But, in an increasingly varied news ecosystem, a broad question about paying for news does not appear to capture all the ways that Americans financially support news organizations. Indeed, two follow-up questions asking about more specific ways that people may pay for news find that some Americans – particularly older adults – answer no to the broader question about whether they pay for news but yes to a more specific way of paying for news. And it appears that an even higher share of U.S. adults indirectly supports news organizations financially.

Finally, this chapter explores the different platforms Americans use for news consumption – and how researchers can best measure usage of some of the newer, more specific digital platforms, such as podcasts and internet streaming services.

The findings in this chapter are drawn from an online survey of 2,021 U.S. adults conducted June 2-11, 2020, on Ipsos’ KnowledgePanel (see Methodology for details).

The public is broadly aware of some newer forms of news consumption, but most Americans do not often use them

Americans are broadly aware of newer digital platforms

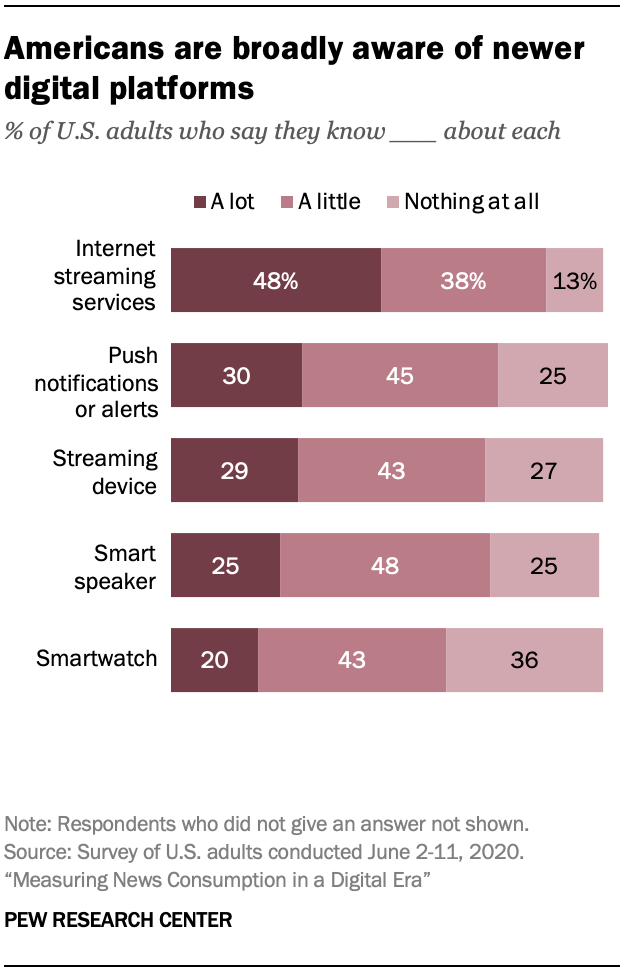
Among the five new digital platforms mentioned in the survey, streaming services are the most widely known.

A majority of U.S. adults (86%) are aware of internet streaming services such as Netflix or Hulu. Nearly half (48%) of respondents say they know a lot about these services, while an additional 38% say they know a little about them. Just 13% say they are not familiar with streaming services at all.

Americans also are broadly aware of push notifications and alerts on mobile devices, streaming devices such as Chromecast and smart speakers. About three-quarters of all Americans know at least a little about each of these technologies, though no more than three-in-ten say they know a lot.

Smartwatches are less commonly known, with about a third of Americans (36%) saying they know nothing at all about them and only one-in-five saying they know a lot.

Demographic profiles of Americans’ knowledge of new digital platforms

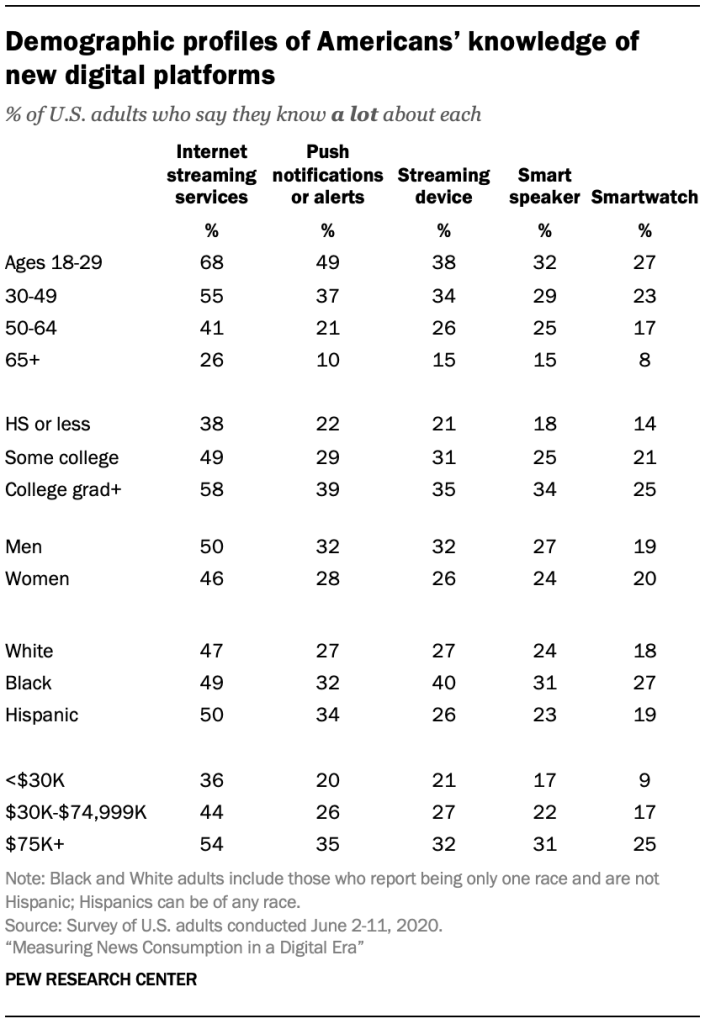
Young adults (ages 18 to 29) are more likely to know a lot about all five types of new digital media, compared with those ages 50 and older. Differences in knowledge are especially stark when younger Americans are compared with those 65 and older: For example, about two-thirds of adults under 30 (68%) say they know a lot about streaming services, while the same is true of only 26% of those ages 65 and older – a gap of 42 percentage points.

Higher levels of education (and income) also are associated with greater knowledge of new digital platforms. Those with a bachelor’s degree or higher are more likely than those with lower education levels to say they know a lot about each of these new digital platforms.

Familiarity with some of these newer digital platforms is higher among Black Americans than White or Hispanic Americans. For instance, Black Americans (40%) are more likely than White (27%) or Hispanic (26%) Americans to say they know a lot about streaming devices, such as Roku, Chromecast or Fire Stick.

Few newer forms of digital media are widely used for news

Among those with at least a little knowledge of these devices or services, only small portions report using them to get news – with the exception of push notifications.

About four-in-ten Americans who are aware of push notifications say they “often” (12%) or “sometimes” (30%) use them for news. An additional 26% say they “rarely” use push notifications for news, while 32% of individuals with knowledge of push notifications never use them to get news.

By contrast, around two-thirds of those who are familiar with internet streaming services (67%), streaming devices (66%) and smart speakers (66%) never use them to get news. And an even greater share of Americans with knowledge about smartwatches (79%) never use them to get news.

These results are consistent with findings from the cognitive interviews that streaming devices, streaming services and smartwatches are not popular for accessing news, despite most respondents being familiar with these new platforms.2

Overall, the results show that most people – at least in the U.S. – are familiar enough with newer digital devices and services to answer questions about them in a survey, though adoption for news consumption is currently quite low.

News aggregators are used at varying rates

Americans do not widely use four news aggregators

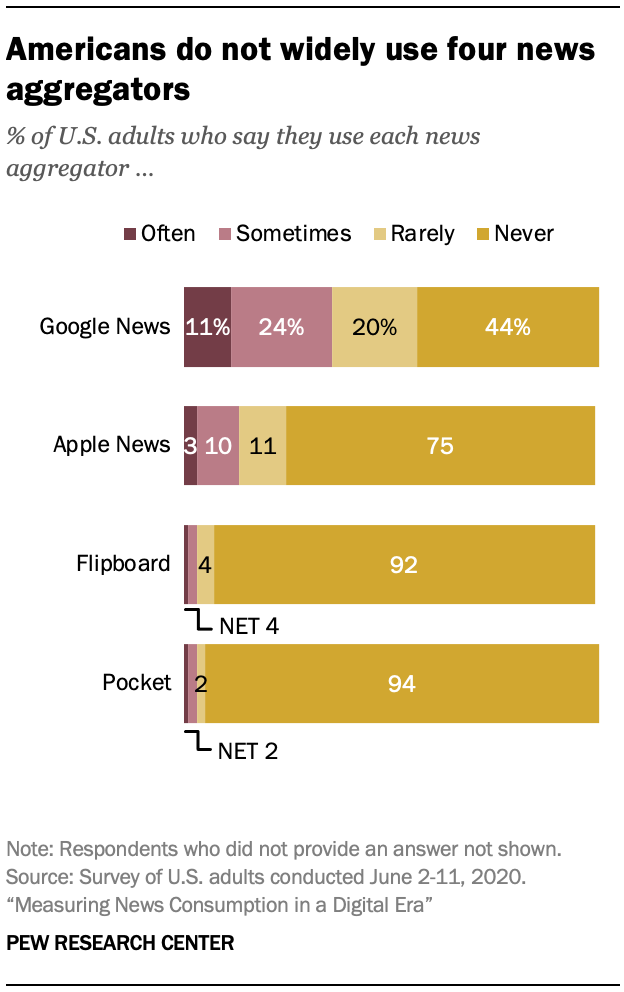
News aggregators – websites, apps and other services that compile news from a variety of different original sources – are another form of news consumption unique to online spaces. The survey asked respondents how often they use four of the most widely used news aggregators (based on fourth-quarter 2019 traffic measured by Comscore): Google News, Apple News, Flipboard and Pocket.

Google News is the most widely used: Roughly one-in-ten U.S. adults (11%) report using it often, and about a quarter (24%) say they use it sometimes. Apple News is less widely used, with 3% saying they get news there often and 10% doing so sometimes. And fewer than 5% of Americans use either Flipboard or Pocket at least sometimes, while roughly nine-in-ten never use these two aggregators.

Google News is more likely to be used often or sometimes by Black adults (44%) and Hispanic adults (45%) than White adults (29%). Democrats (and Democratic-leaning independents) are more likely than Republicans (and independents who lean Republican) to use Google News or Apple News at least sometimes.

Some news aggregators, then, seem to play a larger role in digital news consumption than others, suggesting that including some of the most prominent ones could be a worthwhile addition when seeking to gather a full picture of news intake. However, additional questions remain about how people distinguish such news aggregators and organizations who do original reporting – questions explored next in this study.

Little public confidence in identifying original reporting – and little success

Amid the variety of new digital platforms that people can use to access news, confusion emerges when people are asked to distinguish news sources that do original reporting from those that do not.

Just over half of Americans (55%) are at least fairly confident they can differentiate between organizations that do original news reporting versus those that do not, including 46% who are pretty confident but only 9% who feel very confident. The remainder are either not too (35%) or not at all (8%) confident they can identify organizations that do original reporting.

Americans often uncertain about who does original news reporting

This general uncertainty is also evident in respondents’ answers to fact-based questions in which respondents were shown six different sources they could get news from, and then asked: “Do you believe that each of the following does its own news reporting?”3 The results show that the ability to correctly identify whether news sources do their own reporting is limited – and also varies widely by source.

Around half or more correctly identify that ABC News (56%) and The Wall Street Journal (52%) do their own original reporting, while 51% know that Facebook does not do its own reporting.

But respondents are much less likely to give correct answers about HuffPost (23% correctly say it does its own reporting), Google News (31% correctly say it does not do original reporting) and Apple News (26% correctly say it does not do its own reporting).4 It is not that more Americans answer these questions incorrectly; rather, more than half say they are unsure whether each of these sources does its own original reporting.

In the case of HuffPost, this may reflect a lack of familiarity with the outlet among many Americans: A separate study, conducted in November 2019, found that, while 93% of Americans have heard of ABC News and 79% have heard of The Wall Street Journal, fewer (63%) have heard of HuffPost. And in that survey, while 70% had heard of Google News, only 35% had heard of Apple News.

About a quarter of Americans could not correctly identify any original reporting sources

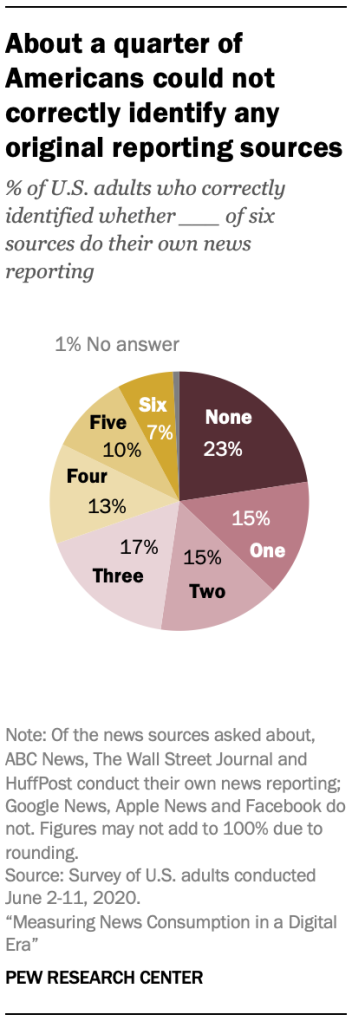
All in all, nearly a quarter of Americans (23%) could not correctly identify whether any of the six sources do original reporting, and an additional three-in-ten got only one (15%) or two (15%) questions right. The remaining 47% were able to answer three or more questions correctly, but only 7% correctly classified all six sources based on whether they do their own reporting.

Although Americans generally do not have a strong sense of confidence in their ability to identify sources that do original reporting, greater self-assessed confidence does line up with higher levels of actual knowledge. Among those who correctly answered all six questions, 81% initially said they are confident (including 20% who are very confident) in their ability to distinguish between sources that do original news reporting and those that do not. Conversely, only 33% of those who could not correctly identify any sources said they are confident in their ability to do so (including just 4% who are very confident).

Previous Center research has found that Republicans are generally less likely to think the news media are professional or report news accurately. As such, it is possible that some Republicans treated these not as knowledge questions but as an opportunity to express that news organizations do not engage in professional practices. Indeed, Democrats (and Democratic-leaning independents) are generally more likely than Republicans (and Republican-leaning independents) to correctly say that ABC News, The Wall Street Journal and HuffPost do their own reporting – including about twice as likely to say HuffPost does original reporting (31% vs. 15%). Still, roughly half of Republicans correctly answered that ABC News (47%) and The Wall Street Journal (48%) do their own reporting.

Full scope of financial support for news organizations not captured with simple ‘paying for news’ question

Most Americans say they have not paid for news in past year… but when asked more specifically, some who initially said no indicate their household had subscribed or donated

Decades ago, most Americans could easily tell if they financially supported a news organization, since the only available mechanisms were to subscribe to or individually purchase print publications or donate to a public broadcaster. The other news options of radio and commercial broadcast TV news were free to access, minus the initial cost of the physical device.

The advent of cable and then the web, however, brought a wide variety of ways to directly and indirectly support news organizations financially. This includes both direct forms of support – such as becoming a member of an online news site or using a subscription service like Substack – and indirect forms of support, including cable or satellite subscriptions that go toward paying license fees for network affiliates and cable news channels. Americans also can pay to access news in a way that does not directly benefit any news organizations, such as by paying for internet access and using that connection to access free news sites or social media.

What it means to “pay for news,” then, is another concept impacted by technological and digital advancements. As such, the study examines what people tend to think of – and not think of – when asked about paying for news. The results indicate the importance of using specific language about the possible types of financial support that researchers are interested in measuring.

When asked simply whether they have “paid for news in the past year,” only 17% of Americans say they have done so. The overwhelming majority (83%) say they have not paid for news.

Separate, more specific questions, however, reveal that this seemingly straightforward question does not capture the full range of how Americans pay for news. Among those who say they haven’t paid for news in the past year, nearly one-in-five (19%) also say they or someone in their household has paid for a subscription to a newspaper, magazine or news website in the past year. Also, within the group who initially denied having paid for news, 6% say they or a household member have donated to a public broadcaster or other news organization during the same time period.

The more specific questions add in the option of someone else in their household being the one who pays for news. That specificity, however, does not seem to be the primary factor in the situations where there is a disconnect between respondents’ answers. That is because those in multiperson households are about as likely as those in a single-person household to have a mismatch between the initial question and the donation and print or online subscription follow-ups. In other words, both groups are about as likely to have the follow-ups “catch” additional ways of paying for news directly.

For example, among those who say they did not pay for news in the past year, 15% of those in a single-person household also say they (or someone in their household) paid for a subscription to print or online news in the past year, while 20% of those who live with at least one other person say this. When it comes to donations to a news organization, the figures are exactly the same (6% for both those in single-person and multiperson households).

Who says ‘no’ to initial question about paying for news but ‘yes’ to a more detailed follow-up

Some demographic differences emerge in the likelihood of missing certain types of payment in the simple approach.

Those ages 65 and older are more likely than their younger counterparts to provide differing answers on the general question about paying for news and the more specific question about paying for a subscription. And White adults are also more likely than Black or Hispanic adults to do so.

For donations to public broadcasters or other news organizations, again, those ages 65 and up are more likely than adults between 30 and 64 to say they provided a donation after initially saying they had not recently paid for news.

Less sharp divisions on indirect support for news

This analysis also reveals that indirect payment is also not entirely captured in a general “pay for news” question.

Among those who say they don’t pay for news, over half (57%) do pay for a cable or satellite TV subscription, and 18% pay for a satellite radio subscription. This may not be part of a researcher’s definition of “paying for news,” but since some revenue does flow from these subscriptions to news organizations (including cable TV channels and local TV channels), these payments do result in increased financial resources for some news organizations.

On one final item where no money flows to news organizations – paying for internet access – there is no substantial difference between those who initially say they had and had not paid for news.

Understanding how use of new digital platforms overlaps with use of analog and digital platforms for news consumption

In the digital age, it is possible to obtain news through various platforms, services and devices, with news content originally published through one avenue easily being shared elsewhere. For example, a news excerpt that is originally broadcast on national TV could also be available to watch online through a computer or mobile device. The same is true for radio broadcasts that can be accessed through podcasts and, more recently, smart speakers.

Analyzing the relationships between how people use analog (e.g., TV, radio or print publications) and digital media together can inform the best ways to measure news consumption overall. In other words, does a broad platform measure (e.g., asking about TV, radio, print and digital devices) already capture nearly all news consumption in the U.S., or is it also necessary to include specific, newer digital forms of news consumption – such as streaming devices or smart speakers – in future survey questions in order to get a full picture of Americans’ news habits?

Results show that streaming seems to be well captured by a broad platform question, though it is unclear if it overlaps more strongly with TV or digital devices. This is also largely the case for podcasting in terms of its overlap with radio and with digital devices.

Do survey respondents associate streaming, podcasts with broader platforms?

Asking about streaming video adds little to overall picture of news habits

In this digital era, it is reasonable to question to what extent it is necessary to ask about newer forms of news consumption in surveys to capture the full scope of Americans’ news habits. Since the old analog trio of TV, radio and print no longer encompasses the entire universe of news consumption, and since, in cognitive interviews, respondents did not consider all forms of digital news consumption when asked a broad question about their use of smartphones or computers for news, do questions about these new platforms add anything to the overall news consumption picture? Or are they edge cases – interesting in and of themselves but of relatively minor importance to a holistic picture of Americans’ news habits?

Among all U.S. adults, only small portions of respondents say they at least sometimes get news from streaming devices such as a Roku, Chromecast or Fire Stick (14%); internet streaming services like Netflix or Hulu (14%); or podcasts (15%). By contrast, large majorities say they get news from TV (73%) or from mobile devices or PCs (84%). There also seems to be a lot of overlap: The vast majority of those who get news from streaming devices or services also say they get news from TV or digital devices. As a result, including streaming devices or services in the totals – e.g., the portion of respondents who get news either from TV or from streaming devices – is nearly identical to the portion who get news from TV or mobile devices alone, suggesting that it is probably not necessary to ask specifically about getting news from streaming services or devices.

Asking about news consumption via podcasts specifically, however, does seem to bring something new to the table – at least, if podcasts are considered to be part of radio. There is a difference of 7 percentage points between the portion of respondents who at least sometimes get news from either radio or podcasts compared with radio alone (57% vs. 50%). However, the portions are identical when it comes to digital devices, and, as the data below show, podcast usage overlaps far more strongly with the use of digital devices than with radio.

Overlap of streaming and podcast use with analog or digital platforms

Use of streaming video for news overlaps strongly with both TV and digital news use …but use of podcasts for news overlaps more strongly with digital devices than radio

To understand whether these new platforms would be more strongly associated with analog or digital platforms, researchers looked at the overlap between use of streaming for news consumption and use of either TV or digital devices for this purpose. A separate analysis examined the crossover between news consumption via podcasts and either radio or digital devices.

Those who say they often or sometimes use streaming devices and internet streaming services for news were divided into four categories: those who also say they get news (at least sometimes) from both TV and digital devices; those who also get news from TV but not digital devices; those who get news from digital devices but not TV; and finally, those who say they don’t get news from either TV or digital devices.

Use of streaming devices for news overlaps strongly with both TV and digital devices. About eight-in-ten of those who say they at least sometimes get news from streaming devices (81%) also get news from both TV and digital devices. The same pattern is apparent for streaming services: 77% of those who get news from streaming services also say they get news from both TV and digital at least sometimes. In both cases, larger shares say they get news only from digital devices rather than only from TV, but these portions are small and reflect higher overall use of digital devices than TV for news consumption. In both cases, very few (1%-2%) in either group say they do not get news from TV or digital devices.

A different pattern is apparent for use of podcasts, which overlaps far more strongly with use of digital devices than radio. While a slim majority of those who say they at least sometimes get news from podcasts say they get news from both digital devices and radio (57%), about four-in-ten say they get news only from digital devices – not radio (41%). Fewer than 1% say they get news only from radio but not from digital devices. Again, virtually none (less than 1%) say they get news from neither of these broader platforms.

These results may in part reflect the sequencing of these questions: The question about use of podcasts for news was included as a follow-up question for those who said they ever get news from digital devices. Still, the analysis suggests that including podcasts as a separate item in survey questions about news consumption may add clarity to the overall picture of Americans’ news consumption habits, while items about streaming video devices or services can be used on an as-needed basis.

At the same time, results from the cognitive interviews suggest that, even though people are generally familiar with streaming devices, they do not commonly think of streaming devices when considering ways to access news. This is in line with results from the survey, which finds relatively little use of streaming devices for news – despite widespread familiarity with the devices. It seems that, among those who say they don’t use them for news, newer platforms like streaming devices are not considered news sources but, rather, digital or technological gadgets that make it possible to get news and other information if one wanted to. When asked if they associate streaming devices with other news platforms, one participant (man, age 35) said, “No, I wasn’t thinking about streaming devices at all. I think things like Roku are in a league of their own.” 

As a follow-up probe in the cognitive interviews, those who said they use streaming devices to get news were asked whether they saw it as more akin to getting news from a television or from a digital device. A few participants said that they see them as more similar to getting news online or on digital devices, while others said they considered news accessed via a streaming device to be TV.

Still others said they see streaming devices as being somewhere in between TVs and digital devices, including one man (63) who called them “kind of a hybrid,” and another man (68) who said such devices “turn your TV into a terminal so you can get internet-provided content.”

In addition, six participants felt that watching news through streaming services like Netflix was more like watching news on TV, and two felt it was more like getting news online. Cognitive interview participants who said streaming services were like TV mostly focused on the device they use for streaming when making that determination – those who watched Netflix on their television were more likely to see it as watching TV.

2. Assessing different survey measurement approaches for news consumption

Broadly speaking, perhaps the biggest problem with survey measurement of news consumption is that it seems to produce inflated estimates of how much news people consume when compared with other sources, such as ratings or online trackers.5 This may be because, on the whole, respondents feel social pressure to describe themselves as informed, which could cause them to consciously or subconsciously exaggerate their levels of news consumption – a phenomenon known as the “social desirability” effect. A previous Pew Research Center study has found that online surveys should reduce this effect, since respondents are not talking to an interviewer when giving their answers. Nevertheless, survey-takers may respond “aspirationally” by indicating how much they should have followed the news rather than how much they actually did. And it may be challenging for them to accurately remember just how often they got news from various platforms and providers.

How survey experiments can test the effect of different question wordings for measuring news consumption

At the same time, “passive data” – i.e., data collected without respondents having to report their own consumption in a survey – is not without its own complexities (see Chapter 3). Each news platform currently produces its own unique set of data (e.g., TV ratings, print circulation, web browsing metrics, social media impressions or podcast downloads) that are not directly comparable and would very likely rely on separate datasets with distinct groups of respondents, making comparisons far more difficult. Improved survey measures would thus have a distinct value in measuring news consumption, as they can measure usage of each of these platforms within a single population sample, and this chapter takes an exploratory approach to achieving that goal.

First, results from cognitive interviews shed light on how survey respondents understand the terms used in a standard news consumption questionnaire. For instance, when asked about cable TV news, can they provide examples or explain how it differs from national network or local TV news? These qualitative results help researchers to understand how respondents think through questions as they go about answering them and how they estimate their levels of news consumption.

Second, survey experiments test the effect of different approaches to measurement, such as question wording and item ordering. How can the findings about respondents’ awareness and understanding of the news media and their own news habits be applied to survey instruments in a way that aids respondent comprehension? What specific changes to question wording might produce more robust results?

The 21 cognitive interviews were conducted in late February and early March. The experiments were run in two separate surveys conducted April 17-19, 2020, (N=1,031) and April 24-25, 2020, (N=1,018) on Ipsos’ KnowledgePanel. Multiple experiments were conducted in each survey. For more detail, see the omni topline and survey topline.

In addition, throughout the planning stages of this research, a series of exploratory experiments was conducted using a nonprobability survey platform to examine the possible effects of different terminology, use of examples, sequencing of questions and the like. These experiments, while hardly definitive, were nevertheless suggestive of the potential consequences of different kinds of survey measures. This information, along with the cognitive interviews, led to the construction of the set of KnowledgePanel experiments described below. The results of some of these tests are discussed in the appendix.

Are the terms researchers use to ask about news consumption generally understandable among respondents?

People’s definition of news and news sources may differ; however, in order to do comparative research about how Americans consume news, it is important that respondents define and understand the different news platforms and providers similarly. (For more on what these terms mean, see the terminology at the top of the overview.) For instance, do people fully understand distinctions between more traditional forms of news consumption, such as cable, network or local TV, and newer digital platforms, such as social media, where such TV organizations might have a presence? Also, do these forms naturally come to mind when asked about news habits? And, finally, how do respondents “calculate” their news consumption – what process do they go through in thinking about how frequently they get news from different sources?

Results from the cognitive interviews shed some light on these questions. When asked by interviewers to talk through how they typically get news, participants reported a mix of television, online sources, radio, newspapers and magazines. Respondents also had little trouble understanding what was meant by TV, radio, print publications and digital devices such as smartphones and computers. (Note that nearly all of the participants reported “often” getting news from digital devices, suggesting that they may be somewhat heavier online news consumers than the population at large; indeed, this group should not be seen as nationally representative.) When probed, most participants limited their understanding of “print publications” to physical newspapers and magazines and did not include digital versions of these publications, which is consistent with what this item was intended to capture in the survey.

Social media stood out as a distinct form of news consumption, especially among participants who were 45 years and younger. One participant (woman, age 27) commented that, even though she considers news via social media to be “unreliable,” she is “already on social media for personal reasons, so it’s more convenient that way.” The same participant also said that “social media gives instant access that you can move on from quickly.” Another woman (21) offered, “I rarely use news websites or apps, only if I am specially searching out something. It’s not a normal thing for me to do. Social media is a big outlet for me to get the news.” Most participants who were ages 60 and older mentioned television, radio, newspapers and “online” when asked how they typically get news – but not “social media” specifically.

Understanding of major digital platform categories also was consistent among participants, for the most part. Participants generally understood “news websites and apps” to include things such as sites of cable news networks (such as CNN.com) and local television apps and sites, as opposed to social media sites. Participants also consistently understood “search” and search engines to be an individual-initiated action used to learn more about a story or to “cross-reference” information about a specific topic they may have heard about through other sources. For example, one participant (man, 35) commented that “Google is the main search engine I use. If I want to cross reference an article on, say CNN, I will go to Google and look up stuff about it.” Respondents also expressed general familiarity with email newsletters.

Do respondents naturally think of all platforms when they consider their news consumption?

For some of the sources of news and information mentioned in the cognitive interviews, however, respondents did not universally think of them as sources of news. For example, despite the strong sense of familiarity with newer digital platforms (such as streaming devices, smart speakers, or internet streaming services; see also Chapter 1), cognitive interview participants largely did not think of these as news sources without prompting.

In contrast, there was more frequent recognition of social media as a news source, though not all participants thought of it as an original or direct news source. For example, one participant (man, 35) said, “If I see an article on social media from CNN or Fox News, I would consider that as getting it from CNN or Fox News. Social media for me, especially Facebook, is like a news aggregator.”

Several participants omitted podcasts and search while initially discussing their news habits until these were explicitly brought up, particularly among people who do not use these platforms regularly for news. One respondent (woman, 27) who does not rely on podcasts or search for news said she “didn’t think about Google/search engines or podcasts” when asked about ways to get news digitally; “Really only social media.” Participants generally thought of podcast and search as digital gadgets that are possible ways to get news and information if one wanted to rather than as an original source of news or as being tied to a particular news organization, similar to the way respondents largely understood social media.

Similarly, though many said they got information from an advocacy group or an elected official or government agency, several participants volunteered that they did not think of these as news sources. Together, this suggests that broad questions asking about news use on general platforms may not capture all types of news consumption that researchers have in mind – particularly lesser-used platforms or sources that are less consistently understood by the public, such as these direct sources of news and information. At the same time, most participants who do not initially think of these platforms also do not use them for news – meaning that the impact on overall survey numbers may be minimal. Thus, researchers should take into consideration which types of news consumption they specifically wish to target; lesser-used platforms like podcasts or search need not be included unless they are of specific interest, and researchers must decide whether they will ask specifically about information directly from sources such as public figures and advocacy groups.

Are distinctions between traditional terms well understood by survey respondents?

For the most part, participants can differentiate between the different radio news providers that researchers ask about in surveys. Cognitive interview participants could accurately distinguish talk radio stations from public radio stations as well as identify types of stations like satellite and local radio.

However, the process revealed possible confusion with certain terms used for TV providers. Notably, participants could not easily tell the difference between national network TV and cable TV news organizations. And while participants generally were confident that they know what “local TV news” means, a few expressed confusion. Some said that national network TV was the same thing as cable TV, and several could not correctly identify news organizations that fall into the various buckets. Others outright said “I don’t know” or that they were confused; still others indicated that they are different but could not articulate those differences. This confusion could be mitigated by adding examples to survey items, the effect of which was tested in survey experiments detailed below.

Finally, how did participants ‘calculate’ their level of news consumption?

In the cognitive interviews, researchers asked follow-up questions and probes in order to gain a better understanding of how participants actually come up with their answers, especially with regard to the questions that ask about frequency of news consumption. Participants were asked what they were thinking of when they answered the platform battery: “How often do you get news from [platform]?” two ways: first, they were asked generally what they were thinking of while answering this question; then, they were asked what time period they had in mind.

By and large, two strategies emerged from the first probe. The first is that participants think of the different platforms they use to get news, with no specific programs or time frames in mind. For example, a participant (man, 66) said he was “thinking about devices and thinking about frequency generally.” One woman (28) said, “The devices that I use. I did not compare them to each other – just generally.” The other strategy is thinking about their news consumption habits within a specific time period, mainly throughout the course of a day. For example, an older man (63) said, “I listen to the radio every morning, I get news from my phone during the day, I watch cable TV news at night.” And a 45-year-old woman said, “I listen to the news in the morning on my smart speaker. I look at news on my phone during the day. I watch the news on TV at night.”

When asked specifically about the time period they were thinking of when answering how often they get news from various sources, many participants said they were thinking “generally” or that they had no specific period in mind. Several said they were thinking of their daily routine, two said they were averaging over the past couple of years, and some said they were thinking on a weekly or monthly basis. One participant (woman, 68) said, “Daily, weekly, monthly, in that order.”

The remainder of this chapter explores these themes further through survey experiments that test the impact of different question wordings and measurement approaches, including the addition of a reference period to questions about the frequency of news consumption and the use of examples.

Can examples improve respondents’ understanding of news providers?

Adding examples to question about news providers has little effect on responses in most cases

In the past, news providers such as newspapers, network TV and radio were largely tied to a single platform (i.e., the physical medium through which the news is consumed). Daily newspapers published in print, network news appeared on TV sets and radio news traveled through the airwaves to a radio receiver. In a digital era, however, when news providers associated with various traditional platforms can produce content that appears online and arrives through a wide variety of digital devices, it may be harder to understand what it means to get news from a cable TV news organization. For instance, content produced by CNN may be consumed through a TV set, a website or a smartphone – and perhaps on Twitter or Facebook.

Even as news organizations now publish on analog (i.e., print, TV and radio) and digital platforms, their brand identities (and revenue streams) may still be associated with their legacy platform. In other words, local metro daily papers may publish online but may still be identified as newspapers and get most of their revenue from print; further, cable news channels have a large online presence but still identify themselves as cable news channels. As a result, collecting data on news consumption across provider types (e.g., daily newspapers, network TV, cable TV, public radio, etc.) in the same data structure still has value – and can illuminate important differences in the news people get from various types of sources.

But if respondents are unsure where the boundaries are between different providers, how do researchers do this in a way that accurately measures which survey respondents use which different news providers? If respondents receive robust examples of each provider type, does this help? Survey respondents in these survey experiments were randomly assigned to one of two conditions, each of which showed a different version of a survey question. For example, about half the respondents were asked how often they got news from six provider types, such as “cable TV news” or “daily newspapers.” The other half of respondents were shown the same question but with examples provided for each item: “cable TV news (such as CNN, Fox News or MSNBC)” or “daily newspapers (such as The New York Times, Wall Street Journal, or your local daily paper).” Responses were then compared to detect any effects of these modifications to survey questions.

For the six provider types tested in the survey, four do not produce notably different estimates for frequent consumption (five to seven days per week) when examples are added. These include local TV news, cable TV news, daily newspapers and talk radio.

In the cases of national network TV and public radio, however, differing shares of Americans say they frequently get news from these sources depending on whether examples are added or not. For instance, 35% of Americans say they get news from “national network TV” at least five days per week, but when examples are added – “such as NBC Nightly News, Good Morning America, or the PBS NewsHour” – 28% say they do this. And 15% of U.S. adults say they get news from “public radio” five to seven days per week, but this figure falls to 10% when respondents are asked about “public radio, such as NPR.”

Does a specific response scale improve measurement of news consumption?

News consumption survey questions may use a relative response scale, asking how often respondents get news in each way: often, sometimes, rarely or never. This scale has some ambiguity given the varying frequency of publication or broadcast between providers and platforms (e.g., ongoing 24-hour cable TV news compared with once-daily print newspapers).

Alternately, researchers could ask respondents to provide a specific time measurement: How many days in the past week have they gotten news a certain way? Or did they get news that way yesterday?

It is important to know what respondents mean when they say they get news often, sometimes or rarely; so, after using the relative scale to measure frequency of news consumption, the experiment included a follow-up question asking specifically how many days in a week respondents got news a given way.

The results (see detailed tables) show that those who say they get news from a given source “often” generally say they get news that way five to seven days per week. Americans who say they get news from a source “rarely” mostly seem to mean zero to two days per week. And those who say they get news from a source “sometimes” are more scattered – with most responses landing in the range of one to three days per week but with wider variation.

When asking about frequency of news consumption, ‘often’ aligns with 5-7 days in a week, ‘rarely’ aligns with 0-2 days, and ‘sometimes’ means a variety of things

Does providing a reference period affect news consumption measurement?

Adding a reference period has little effect on frequency of self-reported news consumption

Does providing a reference period – such as asking how often “in the past week” someone got news rather than how often in general – affect responses to news consumption measures? In theory, this could make it easier for respondents to reply accurately, since it is a more specific task, but it could also misrepresent their more general news consumption habits if there was something unusual about the period (e.g., a party convention happening in the past week or something atypical happening in the respondent’s own life). Alternatively, a middle ground may be to provide a more general reference period, such as “in a typical week.”

Pew Research Center tested three different approaches. The findings show that providing a general reference period has almost no effect on results. Those respondents who are asked about their use of various platforms “in a typical week” show the same incidence as those who are simply asked how often they use these different platforms, with no reference period provided. For example, 52% of Americans say they often get news from a smartphone, computer or tablet in general, which is identical to the share who say they do the same “in a typical week.”

The same pattern of little to no variance applies to a variety of more specific news sources, such as news websites or apps, social media, local TV and public radio. In all of these instances, and others, similar shares say they get news often from each source when they are asked about “a typical week” or without any reference period.

The one platform where there is a small but statistically significant difference is podcasts: 6% of Americans say they often get news from podcasts in general, while 3% say they do so “in a typical week.”

At high end of news consumption, few differences between ‘a typical week’ and ‘the past week’

More differences emerge when respondents are asked about the number of days they get news in a specific reference period of “the past week” compared with “a typical week.”

Still, there is plenty of similarity in responses when it comes to the share of respondents who frequently get news a certain way. For instance, 53% of respondents say they got news from television five to seven days “in the past week,” which is nearly identical to the 52% who say they get news from TV as often “in a typical week.”

Respondents do, however, appear to be somewhat more likely to say they frequently get news from radio and search “in a typical week” than “in the past week.”

More consistent differences exist between these two reference periods at the other end of the spectrum – in the share who say they’ve gotten news a certain way zero days in a week. Respondents are consistently more willing to say they get news from radio, print publications and other sources at least one day “in a typical week” than “in the past week.” For example, 26% of respondents said they got news from radio zero days “in the past week” compared with just 10% who said this about “a typical week.”

Still, given the broad similarities in responses – and the fact that researchers are primarily interested in the portion of Americans who often or regularly get news a certain way, rather than those who “ever” (even if rarely) get news from a particular source – surveys can usually omit a specific reference period without affecting the quality of the data. One exception is if there is particular interest in radio or podcast consumption; in these cases, a specific reference period may be helpful. In any case, this provides additional evidence that respondents tend to calculate their news consumption aspirationally, given that the specific reference period of “past week” never resulted in higher estimates than the vaguer period of “a typical week” for the lowest end of news consumption.

Do respondents give different answers when the response scale is reversed?

Differences in responses based on order of response options consistent but not statistically significant

Surveys frequently order response options from high to low – e.g., starting with “often” and descending to “never” – to aid in respondent comprehension. However, research on ordering effects shows that respondents can disproportionately select the first response in a scale when taking an online survey like the ones featured in this study, which can lead to overreporting (also known as a “primacy effect”). As such, it may make sense to reverse the order and display the least frequent option (“never”) first and the most frequent option (“often”) last.

Although differences between the two conditions are not statistically significant, there is a clear pattern that the reverse-response scale produces slightly lower estimates of the portion who get news often from each source. Since there is no necessary reason why a scale needs to run in one direction or another, a response scale that runs low to high would be advisable if overreporting is a concern.

3. The promise and pitfalls of using passive data to measure online news consumption

Given the challenges of survey research detailed above, it is worth considering other approaches to measuring news consumption – especially when it comes to getting news online. One possibility is so-called “passive” data, in which respondents’ online activity is recorded automatically by a computer tracker. Several vendors now offer these types of panels: They recruit a sample of respondents who allow their PCs or mobile devices to be tracked and their activity recorded, although respondents are free to leave the panel at any time by deleting or disabling the tracker. Researchers have been intrigued by the possible ways this data could be useful in understanding online activity, including online news use.

The advantage of passive data is that it does not rely on people’s self-reporting of their own behavior, which can be subject to both imperfect recall and aspirational responses by those who value the news but do not actually consume it at the levels they say they do. A second advantage of passive data collection is that it arguably reduces the burden on respondents, removing the need for them to answer questions about their digital behavior.

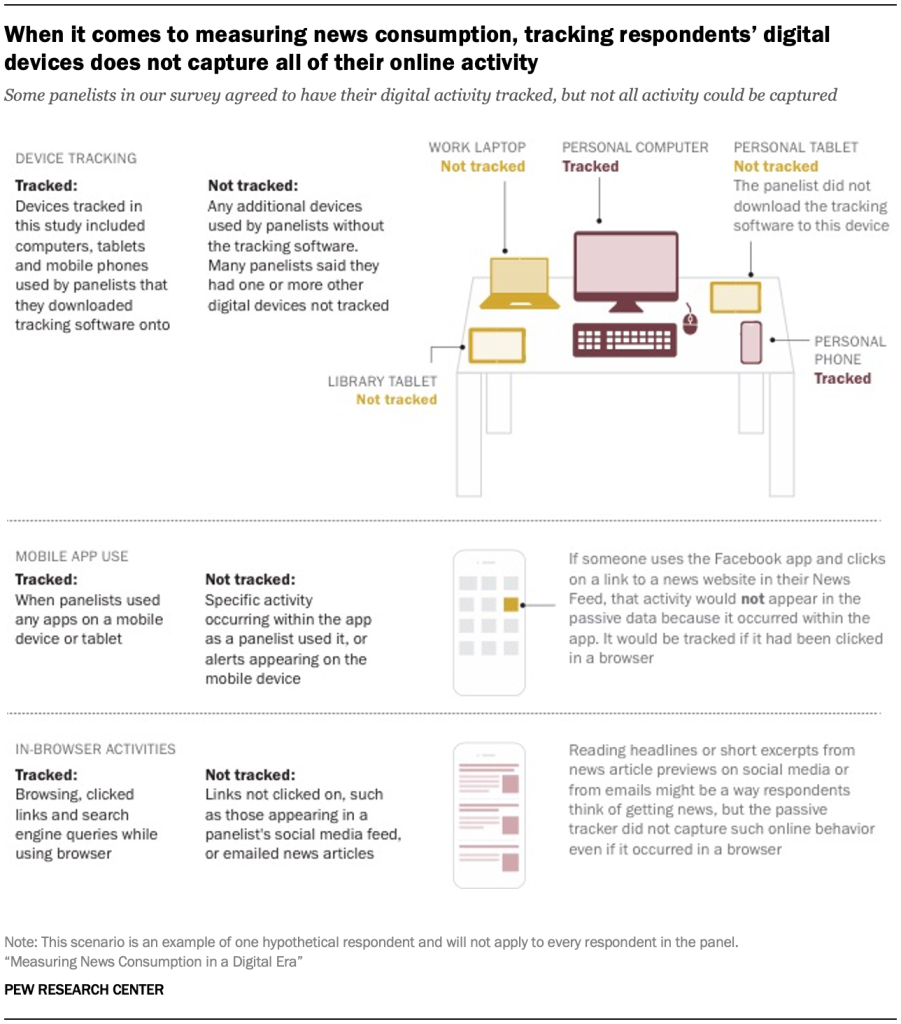
But passive data collection is not without its limitations. Notably, digital tracking commonly used with survey panels excludes all offline consumption, such as television, radio and print newspapers or magazines. At present, television is one of the primary platforms Americans use to get news, but it is not covered by typical passive tracking.6 Due to this exclusion of offline behavior, digital tracking alone cannot provide a complete picture of Americans’ news consumption. Even within online behavior, passive tracking is not fully comprehensive, in part because in-app behavior (e.g., viewing news on Facebook) is not captured, nor are emails or push alerts from news organizations, unless the recipient clicks or taps on the link.

Two additional limitations of passive data concern not the tracking technology but the public’s willingness to use it. Passively tracked adults need to permit the tracking on all their devices in order for the data to represent the full breadth of their usage. But that is a questionable assumption on several levels. Some Americans use employer-issued computers and smartphones, in which cases the employee may not be allowed to install tracking software on those devices. This means that, for some adults, all the news that they consume on an employer-issued device would be excluded from tracking. Employer-related restrictions aside, it is simply more burdensome and invasive to install the tracking on all the devices people use, as opposed to just one device. Full coverage may thus not be a feasible request of panelists.

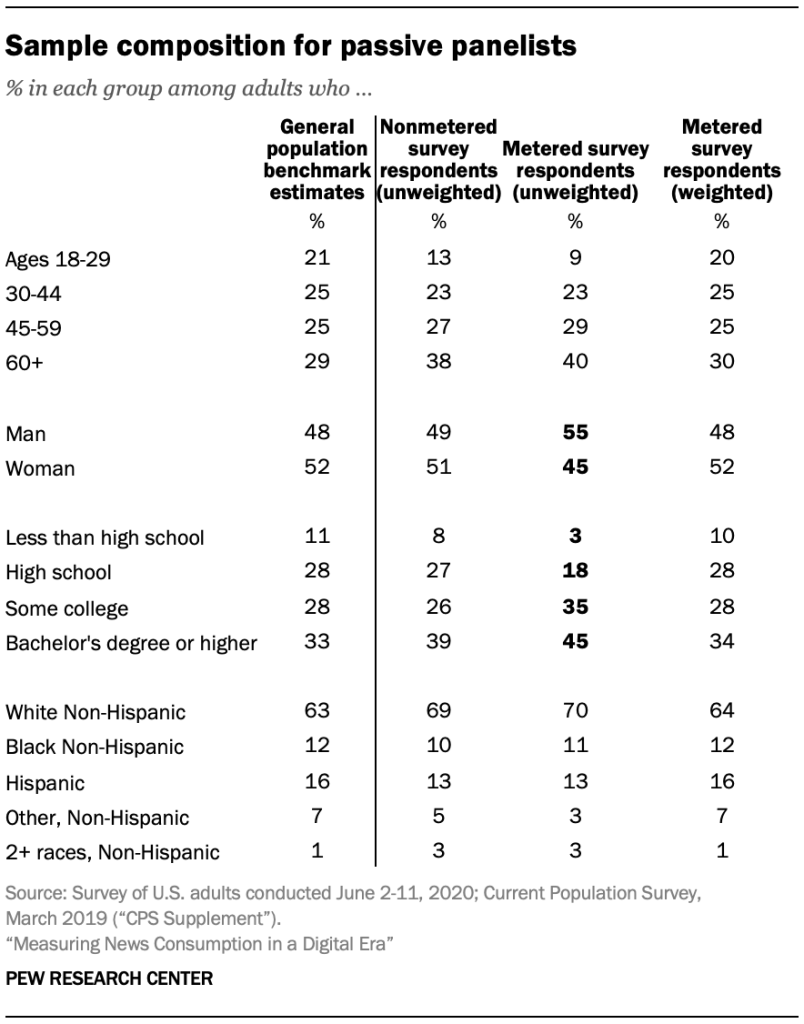
A final question surrounding passive data collection is whether the people willing to participate in the tracking are nationally representative or skewed toward demographic groups (e.g., younger and more educated adults) who tend to be more comfortable with technology and adept at installing new software.

It is worth noting that the capabilities of passive tracking have evolved (and improved) over time. Some panels could only track users on their PC or mobile device – but not both. Others could not see which pages were visited in a browser. Since this methodology is still being developed, it is possible that some or all of these limitations will be addressed in the future.

When it comes to measuring news consumption, tracking respondents’ digital devices does not capture all of their online activity
How self-reported online news consumption was compared with passively tracked online activity

To explore these advantages and disadvantages of passive data, Pew Research Center researchers designed a study to compare passively collected data to survey self-reports from the same individuals. A national sample of adults consented to passive digital tracking, installing trackers from RealityMine that used a VPN, mobile app, software package, or browser extension to record all activity on their PCs and/or mobile devices. This same group also completed a news consumption survey, self-reporting their online behavior in a few different ways:

  • Days in the past week they got news from online news sites or apps
  • Whether they got news online from each of 15 news organizations in the past week7
  • Days in the past week they used each of six social networking services8

These responses were then compared with the passive data. The estimates of news consumption resulting from the two different methods – survey self-report and passive data – differ widely. For nearly every item asked about, self-reporting produces higher totals than the passive data.

What are the implications for news consumption research? Are survey estimates inflated, or is the passive data underestimating respondents’ news habits due to limitations in what can be collected? Or both? Two approaches seek to shed light on these questions. First, secondary data – traffic data from a commercial vendor that tracks visitors to news websites and apps – is used as a comparison point. Second, further analysis of the survey and passive data seeks to ascertain what is driving the differences between the self-report and passive data – and whether more sizable effects arise from potential sources of error in the survey or passive data.

The comparison finds that both the passive data and survey data contain flaws. Numerous passively generated estimates for the share of Americans visiting news websites in the past week are implausibly low when triangulated against traffic data from a commercial metrics vendor. Meanwhile, a number of the survey-based estimates are likely inflated by aspirational responding (also known as social desirability bias).

For researchers seeking to measure Americans’ complete news diet, however, the underestimates in the passive data stemming from insufficient coverage seem to be the greater of the two challenges, at least at the present time. Predictably, the survey data do appear to overstate news consumption to some extent, but they do a better job capturing the many varied ways that Americans continue to get their news.

Respondents self-report online activities at far higher rates than what passive data shows, but it is unclear which is more accurate

Estimates of online behaviors far higher in self-reported data than passive data

The most basic question in evaluating the potential of passive data for measuring news consumption is the overall estimates it produces for the portion of Americans who engage in each activity. This can then be compared with the estimates that result from the survey.

Respondents were asked: “In THE PAST 7 DAYS, how many days did you get news from a news website or app?” This is the type of broad measurement researchers are interested in when it comes to news consumption. To match it to the passive data, a list of over 2,500 local and national news organizations’ websites was constructed from commercial databases. Their Android or iOS apps, if available, were included as well. A respondent was deemed to have visited a news website or app if their passive data matched any entry on this list.

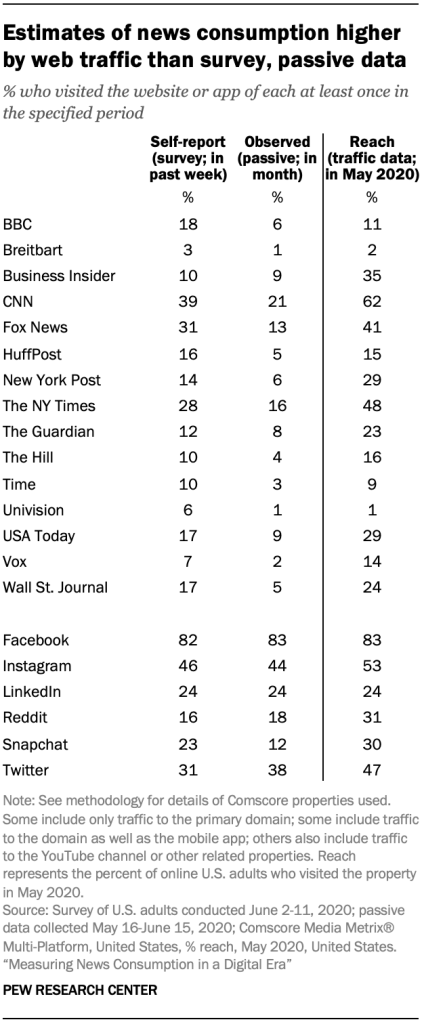
The results show a large gap. In the passive data, only one-in-five respondents used a news website or app between five and seven days in the week prior to their interview. In the survey, however, nearly half of respondents (45%) say they used news websites or apps five to seven days in the past week, a 25 percentage point gap between survey and passive estimates.

It may be difficult for respondents to remember all the news sites and apps they have visited, however, potentially leading them to make an estimate based on their general sense of their news behaviors rather than an actual accounting of their activity in the past week. The survey, then, also included more directed questions: Respondents were asked about the use of 15 specific news organizations’ websites and apps. Here, however, the same pattern is evident, with survey estimates consistently higher than results from the passive data. For instance, roughly a quarter of survey respondents (28%) say they got news online from The New York Times in the past week, while only 8% of respondents show a matching behavior in the passive data (i.e., visited nytimes.com or the Times’ Android or iOS apps within the week before their interview date).

Still, the passive data does not include in-app activity on social media, so it may be that some respondents did see content from the organization online at some point without visiting their site in a browser or using their app. To account for this, the survey also included questions about the use of social media sites and apps, since these are distinct presences with fewer measurement issues, even though use of social media in general is not part of the scope of news consumption research. Here again, however, there are large gaps, with more people reporting that they used social media than the passive data showed.

Estimates of news consumption higher by web traffic than survey, passive data

This would seem to confirm earlier research that found survey estimates of news consumption greatly inflated relative to estimates emerging from behavioral data such as ratings or trackers.9 But when two data points differ, it makes sense to bring in a third data source as a triangulation point. Traffic data is the natural place to turn to as a comparison point for online news consumption. Web traffic data is used by online publishers in much the same way TV ratings or circulation figures are used: to measure their overall performance as well as to set ad rates. Here, we can turn to data from Comscore to see what its data indicates about the portion of the population that visited different online properties in a month.

When bringing in this traffic data, however, the reach – the percentage of online U.S. adults who visited the property at least once in the given month – for individual news organizations and social media sites and apps is generally higher than both the survey and passive estimates. The survey estimates are closest to the traffic data, though they are not an exact conceptual match.10

About Comscore

Comscore data represent a third approach, one that incorporates passive data but also uses analytics data generated by “tagged” webpages and apps. Similar to the respondents to this study, Comscore maintains a panel of users whose online activity is tracked and recorded. But their media clients also place a small piece of code on their websites and in their apps that registers every time it is visited or used. These two data sources are combined to calculate overall traffic. This second stream of data, from “tagged” pages, would necessarily capture some visits that are not valid, whether because they are from a “bot” or because they are not within the target population being measured (e.g., U.S. adults). The panel data can be used to correct for these issues, as well as to provide estimates in and of themselves. Thus, it is a hybrid approach different from both the survey and passive data analyzed here.

For example, 31% of U.S. adults reported visiting the website or app of Fox News in a one-week period in the survey, much higher than the 13% who were observed doing this in the passive data (reanalyzed to cover a one-month period). But traffic data shows that 41% of online Americans visited the website or app of Fox News at some point in May 2020.

Note that the metric here measures only the barest use: at least one visit in an entire month. As such, it would not capture what some media researchers have been searching for when it comes to news consumption: a measure of heavy, habitual or regular consumers of each source, so their media habits can be linked to their attitudes.

Regardless, the hoped-for clarity does not emerge from this triangulation. Given evidence that survey responses are likely inflated, it would be wishful thinking to see these as validation of the survey approach. The wide spread among the three sources suggests that nailing down a precise point estimate for news usage remains elusive.

Accounting for differences between survey and passive data

Another way to answer the question of whether the passive data or self-reported data is more accurate is to assess the influence of various sources of error. For instance, errors in the passive data could result from respondents’ devices not being fully tracked, while errors in the survey data could result from respondents overreporting their news consumption due to social desirability – i.e., they believe it is important to follow the news and consciously or subconsciously want to represent themselves as good citizens – ones who often consume news. If errors from inadequate device coverage were more likely to drive mismatches than social desirability, the blame for the mismatches could be laid more squarely on the passive data. And vice versa – if social desirability is found to be the major culprit for error, then the blame would fall on the survey.

Three areas of potential error stood out: issues with how the passive data are collected, such as coverage of all devices a respondent uses or the ability to gather data from inside apps; social desirability, lack of knowledge about the news media, or other factors affecting the survey responses; and the composition of the sample that could be recruited, which could affect both the passive and survey data.

Those with untracked devices more likely to have mismatch between passive and survey data

Potential error resulting from passive data collection

Device coverage

Americans can use multiple devices to access the internet – from their personal smartphone or laptop to their work computer to a shared computer in their home or elsewhere. To gain a comprehensive picture of their online activity, trackers would ideally be installed on all devices a panelist uses.

When asked in the survey if all the devices they use to access the internet were being tracked, however, only 28% of respondents said this was the case. About two-thirds (68%) said one or more devices they use to access the internet were not being tracked.

This less-than-full coverage was not for lack of trying. About one-in-five panelists (19%) were tracked on more than one device. In contrast to some panels that only track PC or mobile usage, this data captured both: 50% were tracked on at least one PC and 63% were tracked on at least one mobile device. (This data is unweighted.)

While the survey did not ask directly which devices were untracked, most panelists do not access the internet using devices not owned by themselves or someone in their household (e.g., work or library devices). One-in-ten report using a smartphone or tablet they do not own, and about a quarter (24%) use a PC they do not own. Thus, it is possible that many people simply own multiple devices and did not have the tracking software installed on all of them.

An analysis found that those who say they did not have all their devices tracked were more likely to have a mismatch between the results in the passive and survey data (i.e., indicate higher usage in the survey than could be measured in their passive data) for some of the items, especially the social media items.11 For example, among those who say they had at least one untracked device, 27% showed a mismatch for Twitter, compared with 15% of those who say they had all devices tracked. However, for the 15 news organization items, there were only two (BBC and The Wall Street Journal) for which having untracked devices was related to a higher incidence of mismatching.12

Mismatches between passive and survey data vary by social media news use

The only demographic difference on the question about untracked devices was by education. A third of those with a high school degree or less said they had all of their devices tracked, while this was true of 29% with some college education and 21% of college graduates.

A ‘blind spot’ for news consumption within social media apps

While the tracking software captures the use of apps, it does not capture activity that happens within the app. So, for instance, if a panelist visits nytimes.com on their smartphone browser (such as Safari on an iPhone or Chrome on an Android device), this would be captured, as would any time they used the mobile app of The New York Times (though not which stories they read inside the app). However, if they are using the Facebook app and tap on a link to a nytimes.com story, this would not be captured – nor would any links to nytimes.com that appear in their Facebook news feed but are not clicked on. Given the sizable portion of Americans who get news on social media, this blind spot for in-app activity is effectively a social media blind spot when it comes to measuring news consumption through device tracking.13

An analysis found that those who said in the survey that they often get news from social media were generally more likely to show a mismatch than those who say they got news from social media less often. For example, among those who often get news from social media, a quarter showed a mismatch between the portion that get news online from USA Today in their passive and survey responses – in other words, indicated higher usage in their survey responses than was evident in their passive data – compared with 15% or fewer among those who get news from social media less often.

However, such a gap might be expected given that those who say they follow the news more often in general also are more likely to have a mismatch. About one-in-five respondents who follow the news often (21%) showed a mismatch for USA Today, compared with 10% of those who follow the news less often.

Digging even deeper, researchers divided respondents into those who were tracked on just mobile devices, just PCs or on both mobile devices and PCs. If the social media blind spot is driving mismatches, this should only be evident on mobile devices, since on PCs any clicked link would open in the browser window and would be tracked.

Those who were tracked on both PC and mobile were significantly less likely to have a mismatch on use of news websites and apps (49%) than those tracked on just PCs (61%) or just mobile (66%). But there was no consistent pattern for mismatches when it comes to specific news organizations or social media sites. For example, there was a mismatch for USA Today among 16% of those tracked on PC and mobile, 15% of those tracked just on mobile, and 18% of those tracked just on PC – statistically indistinguishable figures.

Those who say news consumption is important to being a good citizen more likely to overreport their own news use

This, then, suggests that the issue isn’t that in-app activity on mobile isn’t being picked up, but that heavy news consumers – including those who get news on social media – are generally more likely to have a mismatch.

Potential sources of error in survey data

Social desirability

Research has shown that survey respondents may overestimate their self-reported level of activities they see as socially desirable, though self-administered web surveys (such as this one) may mitigate this effect. They also may overreport activities they see as important to them personally. To help gauge this effect, the survey asked respondents: “Thinking about what it means to be a good citizen, how important is it to follow what is happening in the news?” Those who say it is very important see news consumption as a socially desirable activity. (Respondents also were asked about volunteering, which showed similar results to the question analyzed here.)

Social desirability inflates survey estimates relative to passive data: Those who said news consumption is important to being a good citizen were more likely to have a mismatch on most news items. For example, among those who say keeping up with the news is very important, 23% showed a mismatch on use of the BBC online, compared with 12% who said it was less important. This pattern is not seen on the items about social media usage, suggesting this social desirability effect is limited to news organizations.

Knowledge
Lower knowledge of the media is not linked with more mismatches

Aside from aspirational overreporting, it is possible that respondents could have cognitive difficulty in accurately recalling their news consumption habits over the past week with the specificity required. Those with higher knowledge of the news media may have more accurate recall of where they got news from online.

While no index of news knowledge or news literacy was included on the survey, some questions can be leveraged to produce a post-hoc measure – specifically, the battery asking whether six places to get to news do their own original reporting. Respondents were grouped into three categories: those who correctly identified one or fewer items (low knowledge), two or three items (medium knowledge) or four or more items (high knowledge).

The results do not support the hypothesis: Those who have higher knowledge of which news organizations do their own reporting were more likely to have a mismatch – not less. This pattern is also evident for education. Those with a college degree are more likely to show a mismatch than those with less formal education (see detailed tables). As such, it would not appear that respondents’ lack of knowledge is driving overreporting.

The results here are, at least in part, an artifact of the close relationship between knowledge and news use. Higher knowledge is closely tied to higher self-reported news use in general; this is also the case for education. And, as discussed above, those who say they get news more often are generally more likely to show a mismatch.

But why are those with more frequent (self-described) overall news consumption more likely to show a mismatch? Are they driven by social desirability effects to overreport? Or are they more likely to have news behaviors that are not getting picked up in the passive data, such as on social media or on work devices? The results here are unclear.

Sample composition

Sample composition for passive panelists

While the results above are weighted to match national estimates, there are some differences between the unweighted portions of nonpassive survey respondents (the nationally representative sample whose results are discussed in Chapter 1) and passive survey respondents. These differences could be affecting both the survey and passive estimates. Part of the discrepancy could have to do with the heavy burden of allowing a tracking device or with loss of privacy.

Passive panelists are more likely to be a man and to have more formal education. While gender does not drive mismatches between survey and passive data, those with a college degree are more likely to show a mismatch. This could be due to their disproportionate representation in the sample, though results were weighted.

Differences in survey responses between passive respondent panelists and general population sample

In addition, there are some differences in the (weighted) survey responses of passive and nonpassive panelists, with passive panelists showing greater awareness and use of some digital platforms. This suggests that the passive panelists are somewhat more online-oriented than the population at large, meaning that both their survey and passive data could be inflated compared with what we might see for a general population sample.

Passive panelists are more likely to say they know a lot about digital devices and services, including smartwatches, streaming devices and push notifications.

However, there are no differences in their use of different news providers. There is also no difference in their reported volunteering for organizations or associations.

Appendix: Additional guidance on using surveys to measure news consumption

As with any research project, we could not test every methodological question we had about measuring news consumption on surveys. For the sake of transparency, and in hopes that it may help other researchers studying this subject, this appendix provides additional details on decision points that we did not opt to test formally using a representative national sample. In some cases, this is because the implications were already clear from non-representative testing (using SurveyMonkey’s Audience survey panel). In other cases, it was the result of data coming out of the cognitive interviews or previous work – and some were purely the result of discussions with experts around the Center. In addition, some of these decision points are specific to the way Pew Research Center has measured news consumption over the past few years and so may not be as broadly applicable. Nevertheless, they are presented here as a potential resource to others.

Top-of-mind elicitation on news use

We wanted to take a breaking news event – in this case, Robert Mueller’s testimony before Congress on July 24, 2019 – and ask, immediately afterward, how people had heard about it. This would, in theory, be a lower cognitive burden than trying to ask a question about how respondents get news more generally, or about getting news from different types of organizations, since it would be tied to a specific event in the past day. As such, on July 25, we asked SurveyMonkey respondents who’d heard about the testimony, in an open-ended question, how they first heard about it. Some said a specific news organization, some provided a format (“TV”), while others provided a verb such as “watching” or “listening.” Still others gave some version of “word of mouth.” This suggests that respondents have different top-of-mind responses when asked about news consumption and that asking exclusively about platforms or providers may not capture the full scope of how they get news.

Defining ‘news’

There are many different definitions of what is meant by “news”: Just breaking news? Only political news? Anything produced by the news media? Or just any information about the world beyond our immediate circle? We wanted to test whether different definitions of news would produce different estimates of news consumption. Using five different SurveyMonkey custom audiences of approximately 500 respondents each, we tested the following conditions:

  • Control: No definition
  • A broad definition: “information about events and issues that involve more than just your friends and family”
  • A definition that primed different topics of news: “any kind of news, including sports, traffic, weather, business, politics, health, or any other topic”
  • A story that primed different “levels” of news: “local, national or international news”
  • A definition that primed “hard news” considerations: “stories about major events in the U.S. and around the world from journalists or news organizations”

Respondents were then asked about their overall news use and their use of different platforms. There was no systematic variation among the definitions; that is, there was no definition that produced consistently higher or lower results relative to the control condition, where there was no definition offered.

Longer response scales

Our main response scale for the news consumption items is a four-point scale: often, sometimes, rarely or never. We wondered if this may be artificially inflating the portion who end up at the top of the scale and so tested it on SurveyMonkey with a six-point scale instead (daily, several times a week, weekly, several times a month, once a month, less often). This did not notably reduce the portion giving the highest response.

Other tests and refinements

  • When asking about individual news organizations, we will sometimes show respondents icons of each brand to aid in comprehension. We experimented with using icons to represent different types of news consumption, but this proved impractical for several categories (e.g., there are no obvious abstract icons that could differentiate among local TV news, network TV news and cable TV news).
  • Following the way we asked about news consumption in our local news study, we decided early on to have separate batteries for platforms (the ways people get news) and providers (the types of organizations producing that news).
  • We added examples to “network TV” and “cable TV” to help alleviate the confusion that cognitive interview respondents expressed about not knowing the difference between the two.
  • We chose not to ask about digital-native news organizations in the providers battery. In the cognitive interviews, when respondents were asked to name specific digital-native news organizations they get news from, they frequently gave examples of TV or newspaper providers (such as latimes.com or cnn.com), suggesting strongly that survey respondents have difficulty separating online news organizations from legacy ones.
  • In addition, we made some structural changes to our existing measures. This includes asking about individual online platforms for news (such as social media and podcasts) as a follow-up to our main platform battery; adding search, podcasts and email newsletters into this digital follow-up; and adding talk radio and public radio to the providers battery we launched in the local news study.

Detailed tables

Relative vs. specific response scale: Sometimes
Relative vs. specific response scale: Rarely
Mismatch between passive and survey data by education
Mismatch between passive and survey data by age
Mismatch between passive and survey data by device


Acknowledgments

This report was made possible by The Pew Charitable Trusts. Pew Research Center is a subsidiary of The Pew Charitable Trusts, its primary funder. This report was made possible by The Pew Charitable Trusts, which received support from the John S. and James L. Knight Foundation. This report is a collaborative effort based on the input and analysis of the following individuals. Find related reports online at www.pewresearch.org/pewresearch-org/journalism.

Michael Barthel, Senior Researcher Amy Mitchell, Director, Journalism Research Dorene Asare-Marfo, Research Methodologist Courtney Kennedy, Director, Survey Research Kirsten Worden, Research Assistant Galen Stocking, Senior Computational Social Scientist Scott Keeter, Senior Survey Advisor Jeffrey Gottfried, Senior Researcher Elisa Shearer, Research Associate Andrew Mercer, Senior Research Methodologist Margaret Porteus, Information Graphics Designer Michael Lipka, Editorial Manager Claudia Deane, Vice President, Research Hannah Klein, Communications Manager Rachel Weisel, Senior Communications Manager Andrew Grant, Communications Associate Calvin Jordan, Communications Associate James Dryden, Copy Editor, courtesy of ServiceScape Sara Atske, Associate Digital Producer         

Methodology

Cognitive interviews

The cognitive interviews for the news consumption study were developed to assess

  • how people engage with, consume and act on news and information;
  • how news is consumed over vast and connected platforms; and
  • the public’s understanding of emerging concepts at a time when familiarity with news sources and platforms may vary widely.

As part of the broader project to answer these questions, cognitive interviews were conducted to capture qualitative feedback on a draft questionnaire that was eventually administered to 2,021 general population U.S. adults and 1,694 metered panelists, both on Ipsos’ KnowledgePanel. The cognitive interviewing process was conducted by RTI International to gain some understanding of respondents’ comprehension of certain concepts and questions around news consumption. Think aloud techniques and verbal probing were used to assess respondents’ answers based on four critical areas: (1) question comprehension, (2) retrieval of relevant information from memory, (3) decision processes and (4) response processes.[14.numofset=”14″ Tourangeau, R. 1984. “Cognitive sciences and survey methods.”]

The survey is administered online; to mimic that setting, the cognitive interviews were conducted remotely with people using their personal devices. Each cognitive interview was conducted by one of three survey methodologists experienced in cognitive interviewing methods. Interviews were conducted using Zoom software between February 23, 2020, and March 9, 2020. The survey instrument was programmed using Voxco Acuity software. To minimize participant burden, the survey administration and cognitive interviews were designed to last no more than 60 minutes. Participants were asked to complete the online survey during the interview, allowing RTI staff to view their screen. If the participants agreed, the interviewers recorded the audio interaction and screen share using Zoom.

Interviewers typed notes into a protocol document during each interview. After each interview, the interviewers transferred their notes to a summary table, allowing for easier analysis of findings across interviews. As the interviewers transferred their notes, they reviewed the interviews’ video and audio recordings to ensure accuracy and to expand on any cognitive issues that were found. Due to technical difficulties in three cases, only audio data was captured. In most cases, the dialog that transpired between interviewer and participant was captured in the summary notes. In some cases, the interviewer paraphrased the dialog, especially if the discussion was lengthy.

Interviewers included in their notes any additional observations about issues that could help improve the quality of questions or response categories.

After the cognitive interviews, the cognitive testing team analyzed the notes and summarized key findings and recommendations across all interviews on a question-by-question basis.

Recruitment and Participants’ Profile

Summary of the participants’ profiles

The cognitive interviewing recruitment protocol addressed variance in respondent age, gender, means of internet access (mobile versus PC) and news consumption level. The Center requested a total of 20 interviews with the following specifications: have five interviews with adults age 65 and over using a smartphone; five interviews with adults age 65 and over using a desktop or laptop; at least five interviews with adults under age 30; and at least five interviews with adults who consider themselves high-volume news consumers. RTI posted advertisements in the “volunteer” subset of the “community” section of Craigslist, an online community forum often used to recruit research participants, and in a NextDoor community located in Raleigh, NC. Craigslist advertisements were posted in various cities around the U.S. The advertisements described the requirements for participation and instructed interested persons to complete an online screening survey to determine eligibility. Individuals were then screened based on gender, age, the devices through which they receive news and their frequency of news consumption. A total of 28 recruits were selected for cognitive testing. Of those, 21 completed the cognitive testing, five refused before scheduling and two were no-show appointments. Each participant received a $50 Amazon e-card emailed to them as a token of appreciation for participation in the interview. The table below is a summary of the participants’ profiles.

Survey experiments

Survey experiments were conducted through Ipsos’ KnowledgePanel (KP) online Omnibus surveys to test different approaches to measuring and asking about news consumption. Two such surveys were carried out in mid-April 2020 with roughly 1,000 respondents per survey. The first survey, conducted between April 17-19, 2020 (N=1,031), experimented with the use of three measurement approaches: reference periods (i.e., no reference period vs. “typical week” vs. “past week”), relative and specific scales (i.e., “often, sometimes, rarely, never” vs. “number of days per week”) and item ordering. The second survey was conducted between April 24-25, 2020 (N=1,018) and tested two measurement approaches in particular: reverse relative response scales (often-never vs. never-often) and providing examples for provider items (or not).

Recruitment

Ipsos KP panelists are recruited using probability-based, addressed-based sampling (ABS). Samples are representative of U.S. adults aged 18 and older and include hard-to-reach population groups including noninternet households, for whom internet access and devices are provided in order to complete the online surveys.

A combination of random-digit dialing (RDD) and address-based sampling (ABS) methodologies have been used to recruit KP members. In 2009, KP switched its sampling methodology for recruiting panel members from RDD to ABS. Adults from sampled households are invited to join KP through a series of mailings, including an initial invitation letter, a reminder postcard and a subsequent follow-up letter.

For the two omnibus surveys, 2,856 and 2,857 panelists were sampled and invited to take part in each survey, respectively. All sampled members received an initial email to notify them of the survey as well as a link to the survey questionnaire. The completion rate was 36% in both surveys.

Weighting

For selection of general population samples from KnowledgePanel, a patented methodology has been developed that ensures all samples behave as equal probability of selection method (EPSEM) samples. Briefly, this methodology starts by weighting the pool of active members to the geodemographic benchmarks secured from the latest March supplement of the U.S. Census Bureau’s Current Population Survey (CPS) along several dimensions. Using the resulting weights as measures of size, a probability-proportional-to-size (PPS) procedure is used to select study-specific samples. It is the application of this PPS methodology with the imposed size measures that produces fully self-weighing samples from KnowledgePanel, for which each sample member can carry a design weight of unity. Moreover, in instances where a study design requires any form of oversampling of certain subgroups, such departures from an EPSEM design are accounted for by adjusting the design weights in reference to the CPS benchmarks for the population of interest. Sampling errors and test of statistical significance take into account the effect of weighting.

Once all survey data have been collected and processed, design weights are adjusted to account for any differential nonresponse that may have occurred. Depending on the specific target population for a given study, geodemographic distributions for the corresponding population are obtained from the CPS, the U.S. Census Bureau’s American Community Survey (ACS) or in certain instances from the weighted KnowledgePanel profile data. For this purpose, an iterative proportional fitting (raking) procedure is used to produce the final weights. In the final step, calculated weights are examined to identify and, if necessary, trim outliers at the extreme upper and lower tails of the weight distribution. The resulting weights are then scaled to aggregate to the total sample size of all eligible respondents.

The following table shows the unweighted sample sizes and the error attributable to sampling that would be expected at the 95% level of confidence for different groups in the first (April 17-19) omni sample:

First (April 17-19) omni sample

The following table shows the unweighted sample sizes and the error attributable to sampling that would be expected at the 95% level of confidence for different groups in the second (April 24-25) omni sample:

Second (April 24-25) omni sample

In addition to sampling error, one should bear in mind that question wording and practical difficulties in conducting surveys can introduce error or bias into the findings of opinion polls.

The News Consumption survey

The analysis in chapter one of this report is primarily based on a nationally representative online survey conducted for the Pew Research Center on Ipsos’ KnowledgePanel (KP), a probability-based web panel designed to be representative of adults in the U.S. The survey was carried out from June 2 to June 11, 2020, in both English and Spanish among a sample of 3,715 noninstitutionalized U.S. adults ages 18 years or older. Of these, 2,021 respondents constituted a general population sample and were weighted to be representative of the U.S. adult population.

An additional 1,694 respondents who agreed to have their digital activity monitored also took the same survey, with some additional questions designed to capture their self-reported digital news use. This set of respondents is referred to as the “passive” sample, as they agreed to have their digital activity measured passively. The passive sample was drawn from Ipsos’ existing pool of KP members and only includes those who had internet access at the time of their recruitment. All recruited passive panelists gave their consent to have their devices tracked and linked to their survey data.

A combination of random-digit dialing (RDD) and address-based sampling (ABS) methodologies have been used to recruit panel members for KP. In 2009, Ipsos switched the KP sampling methodology for recruiting panel members from RDD to ABS.

In all, 5,351 panelists were sampled and invited to take part in the survey. All sampled members received an initial email to notify them of the survey as well as a link to the survey questionnaire. Additional follow-up reminders were sent as needed to those who had not yet responded. The study completion rate was 69.4%. The cumulative response rate is 5.1%. The break-off rate among panelists who logged onto the survey and completed at least one item is 3.1%.

The data were weighted in a multistep process that begins with a base weight and incorporates the respondents’ selection probability. The surveys were raked on gender x age, race and ethnicity, education, Census region, household income and English and Spanish language proficiency. Benchmark estimates for all but language proficiency came from the March 2019 Current Population Survey (CPS) Supplement, and language proficiency estimates were based on the 2018 American Community Survey (ACS). Final weights were calculated separately for the passive and nonpassive samples in this study.

Sampling errors and test of statistical significance take into account the effect of weighting.

In addition to sampling error, question wording and practical difficulties in conducting surveys can introduce error or bias into the findings of opinion polls.

The following table shows the unweighted sample sizes and the error attributable to sampling that would be expected at the 95% level of confidence for different groups in the nonpassive and passive samples:

Margin of error

Sample sizes and sampling errors for other subgroups are available upon request.

Passive data

Recruitment and data collection

Ipsos KnowledgePanel members were recruited to participate in passive monitoring of their online activity. Those who agreed were given a privacy statement and consent form detailing what data would be collected and what would be done with the data. They then installed a tracker from Reality Mine on their mobile device (including tablets) or PC. On PC, data was tracked using a browser plug-in and a software package; on mobile, it was a VPN and, in the case of Android devices, a mobile app. Recruitment was continuous, as panelists could drop out at any time, so panel composition varied over time. While this tracking was done from April through July, 2020, the report uses the passive data collected between May 16 and June 15, 2020 (though in many cases limits analysis to the week before the respondent’s interview date).

In total, 1,694 members of KP consented to the passive monitoring and completed the News Consumption Survey. However, not all who consented provided usable data. An individual’s passive data was considered valid if there was data recorded for any of the seven days prior to their survey completion (the survey questions asked about the number of days in the past seven days that they had done various activities). Ultimately, both valid passive data and survey response were obtained from 1,416 KP members.

About one-in-five (19%) panelists were tracked on more than one device. Half (50%) were tracked on at least one PC, and 63% were tracked on at least one mobile device. The data was provided at the level of the user and day, such that each line would aggregate all instances of a panelist performing a given event on a given day. Events could be the panelist visiting a website, using an app or watching a video. Web browsing data was aggregated at the domain level. Individual links were not analyzed. The number of distinct events and the total duration were recorded. Website visits were only recorded if they occurred within a browser. This means that, for example, tapping a link to pewresearch.org in a social media app would not be recorded. Any event where the average duration (total duration of the event type on that day/number of events of that type on that day) was less than five seconds was excluded, matching a cutoff we have used in previous research. This cutoff is used because events less than five seconds in duration were most likely refreshes or people clicking on a link erroneously and then closing it.

Matching events to behaviors asked in survey

Each event was classified as a match or a mismatch for each of the survey questions used for the comparison between the self-report and passive data. This included both the broad question of whether an event was a visit to a news website or app as well as more narrow questions of whether it was a visit to a specific social media platform or website domain.

News websites and apps

To match a passively tracked event to an answer to the question “In THE PAST 7 DAYS, how many days did you get news from a news website or app?” researchers created a whitelist of news websites from a variety of databases (modeled in part after what the Center does for the State of the News Media fact sheets).

  • National news websites: Researchers hand-coded each website in Comscore with at least 4 million monthly unique visitors in the fourth quarter of 2019, looking for evidence of publishing current events content on their homepage (as of February 2019).
  • Local news websites: any site listed on Michele’s List.
  • Local TV: any news-producing ABC, CBS, Fox or NBC network affiliate in the top 100 markets listed in the BIA database.
  • Commercial radio: any news-producing station (i.e., their format is classified as news, news/talk or news/talk/info) in the top 100 markets listed in the BIA database.
  • Public radio: the top 129 public broadcasting stations, as aggregated and provided by Mark Fuerst, director of consultancy, Public Media Futures Forum, using the Annual Financial Reports submitted by each licensee to the Corporation for Public Broadcasting (CPB).
  • Newspapers: any daily newspaper in Editor & Publisher’s database in the top 100 markets.

This resulted in a list of 2,416 news organizations (without de-duplicating) with their primary domain. For each, researchers searched the Google Play store for their primary app, if one existed, and the name and unique ID were recorded. For the Apple App Store, the API was queried using the news organization name, and the app ID and name were returned. The results were hand-verified; in some cases, the API was re-queried with a slightly different name in order to obtain more accurate results. This resulted in a further list of 1,272 Android apps and 947 iOS apps.

Other events (social media and news organizations)

For questions about specific news organizations and social media (e.g., “In THE PAST 7 DAYS, did you get news from the WEBSITE OR APP of any of these news organizations? That is, did you get news ONLINE from any of these? … USA Today”), a list consisting of the primary domain, the primary Android app and the primary iOS app was constructed for each item. Websites and Android apps were found through search, while the iOS app was found by querying the API.

Calculating summary variables

For each panelist, summary variables were calculated for each event type. This measured the number of days, in the seven days before their survey interview, that their passive data showed evidence of each event. For instance, if a panelist was interviewed on June 4, visited foxnews.com on June 2 and used the Fox News iOS app on May 30, the summary variable for Fox News would show two days.

Note that some survey questions were not matched to passive data. In the case of the question about getting news from YouTube, researchers did not have the resources to code the tens of thousands of videos in the dataset for news vs. non-news content (however, see our recent analysis of news on YouTube). In the case of news aggregators, our results showed that many respondents do not use the four aggregators asked about for getting news. Additionally, for Google News, the passive data as structured would not allow for accurate identification of visits to Google News since its primary domain, news.google.com, is a subdomain of google.com. And one of the news organizations was omitted from analysis, i.e., ABC News, which has a primary domain of abcnews.com but which often links on its Facebook page to abcnews.go.com. Since the go.com domain incorporates a large amount of non-news content (e.g., Disney), this question was omitted from analysis.

Comparing survey responses to passive data

Survey responses were compared to passive data in two ways. The first was at the aggregate level. This analysis compares the weighted percentage of passive respondents who say they got news from a specific online source (e.g., the BBC) in the past seven days and compares this to the weighted percent of panelists with valid passive data who visited that source online in the seven days before their survey interview date. In nearly all cases, the survey responses showed higher incidence than the passive data.

Other comparisons were at the individual level. Each panelist’s survey responses were compared to their passive data, and if their survey responses indicated greater usage than their passive data, they were deemed to have a mismatch. In the case of the general news websites and app question and the social media questions, this meant that they said in the survey that they did the activity on more days than could be found in their passive data. In the case of the news organization questions, a mismatch occurred only when respondents said in the survey that they had visited the organization online in the past week, but the passive data did not show any instances of this.

Comparison to traffic data

In the final chapter of the report, results from the survey and passive data are compared with traffic data. This data comes from Comscore, a cross-platform measurement company. Entities were chosen for each news organization and social media service. In each case, the entity whose dictionary definitions were the closest match to the way the data are analyzed above, where a visit to The New York Times online could be to their primary domain (nytimes.com), their iOS app or their Android app was chosen. In some cases, to get an entity that included both website and apps, it would also include the organization’s YouTube channel. In the case of organizations that are not exclusively news-producing (e.g., the BBC and Univision), efforts were made to choose a news-specific entity. Details are below. Data come from the Comscore Media Metrix® Multi-Platform U.S. database for Total Digital Population, May 2020.

U.S. database for Total Digital Population, May 2020