Pew Research Center

FOR RELEASE OCTOBER 19, 2020

Americans Plan To Follow Election Returns Closely; Biden Supporters More Confident Their News Sources Will Make Right Call

Partisan differences on COVID-19 change little after infection of Donald Trump

BY Amy Mitchell, Mark Jurkowitz, J. Baxter Oliphant and Elisa Shearer

FOR MEDIA OR OTHER INQUIRIES:

Communications Department
202.419.4372
www.pewresearch.org

RECOMMENDED CITATION

Pew Research Center, October 2020, "Americans Plan To Follow Election Returns Closely; Biden Supporters More Confident Their News Sources Will Make Right Call"

About Pew Research Center

Pew Research Center is a nonpartisan, nonadvocacy fact tank that informs the public about the issues, attitudes and trends shaping the world. It does not take policy positions. The Center conducts public opinion polling, demographic research, computational social science research and other data-driven research. It studies politics and policy; news habits and media; the internet and technology; religion; race and ethnicity; international affairs; social, demographic and economic trends; science; research methodology and data science; and immigration and migration. Pew Research Center is a subsidiary of The Pew Charitable Trusts, its primary funder.

© Pew Research Center 2026

Table of contents

  • About Pew Research Center
  • Americans Plan To Follow Election Returns Closely; Biden Supporters More Confident Their News Sources Will Make Right Call
  • 1. Americans plan to follow election returns closely and most are confident their news sources will make the right call
  • 2. Interest in election news increases, with most Americans feeling worn out by the volume of coverage
  • 3. As COVID-19 hits Trump and White House, slight shift in opinion on whether the outbreak has been exaggerated
  • Appendix
  • Acknowledgments
  • Methodology

Americans Plan To Follow Election Returns Closely; Biden Supporters More Confident Their News Sources Will Make Right Call

Partisan differences on COVID-19 change little after infection of Donald Trump

How we did this

Pew Research Center’s American News Pathways project conducted this study to understand how Americans are engaging with and perceiving news coverage of the 2020 presidential election and the COVID-19 pandemic.

For this analysis, we surveyed 10,059 U.S. adults between Oct. 6-12, 2020. Everyone who completed the survey is a member of Pew Research Center’s American Trends Panel (ATP), an online survey panel that is recruited through national, random sampling of residential addresses. This way nearly all U.S. adults have a chance of selection. The survey is weighted to be representative of the U.S. adult population by gender, race, ethnicity, partisan affiliation, education and other categories. Read more about the ATP’s methodology.

See here to read more about the questions used for this report and the report’s methodology.

Visit our interactive data tool to access the questions included in this report, as well as content about the coronavirus outbreak and the 2020 presidential election.
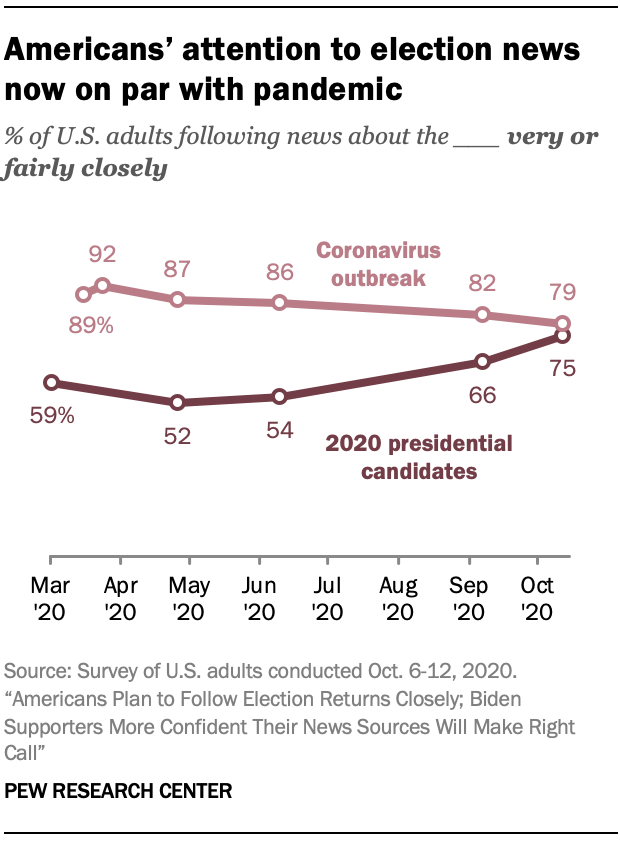
Americans’ attention to election news now on par with pandemic

With the country just a couple of weeks away from Election Day 2020, attention to news about the presidential candidates has increased. For the first time since the coronavirus outbreak began in earnest in the United States, Americans are following the election as closely as the pandemic.

And, amid questions over how mail-in ballot counting could impact the timing of results, Americans plan to tune in closely to election night returns, according to a new survey of 10,059 U.S. adults conducted Oct. 6-12, 2020. This survey is part of the ongoing American News Pathways project at Pew Research Center.

At the same time, during a month when it was made public that President Donald Trump and several others in the White House were infected with the coronavirus – connecting it even more closely to the election – Republicans’ sense that it has been overplayed and controlled as much as possible remains largely unchanged. This is also true among Republicans who rely on Trump and his coronavirus task force for news about the outbreak.

Overall, three-quarters of U.S. adults say they are paying “very” or “fairly” close attention to news about the 2020 presidential candidates. That is up from 66% just a month ago and includes 39% who are paying very close attention. It also brings the share of Americans who are closely following the election roughly in line with the share closely tracking coronavirus news (79%), attention that has remained high since the outbreak hit the U.S. in early March.
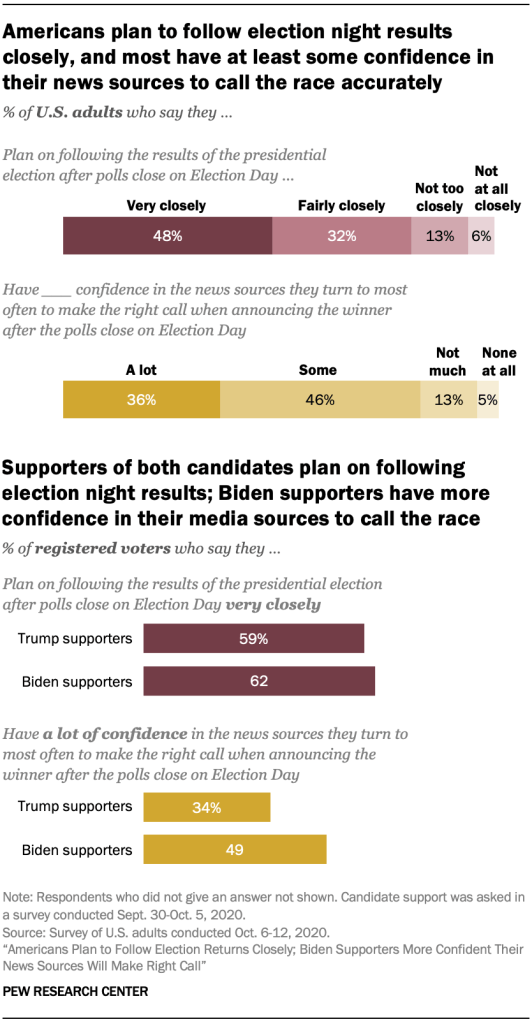
Americans plan to follow election night results closely, and most have at least some confidence in their news sources to call the race accurately

Americans plan to pay even closer attention as results come in on election night. Roughly half of U.S. adults (48%) say they plan to follow results after polls close on Nov. 3 very closely, and another 32% plan to do so fairly closely. Just 6% plan to follow the results not at all closely.

What’s more, in what will likely be a more complicated ballot counting scenario than normal due to the large number of mail-in ballots amid the pandemic, about eight-in-ten Americans express at least some confidence that the news outlets they turn to most will make the right calls in announcing the winner after polls close, including 36% who have “a lot” of confidence and 46% who have “some” confidence.

Registered voters who express support for Donald Trump and voters who support Joe Biden express similar intention to closely follow the results on election night, but Biden supporters express somewhat greater confidence that their news sources will make the right call. Roughly six-in-ten of both Trump and Biden supporters say they will follow the returns very closely. Yet, while about half of Biden supporters (49%) express a lot of confidence in their news sources to make the right call, the figure falls to about a third of Trump supporters (34%).

Biden supporters also are more likely than Trump supporters to say they find it easy to determine what is true and what is not related to the presidential campaign. About six-in-ten Biden supporters (59%) find it easy to distinguish fact from fiction, while most Trump supporters (62%) find it difficult.

Views of COVID-19 outbreak changed very little following infection of President Trump, and partisan gaps remain

The survey was conducted just after it was announced that President Trump and several others in the White House had tested positive for COVID-19. But Republicans’ views about the pandemic remain largely unchanged, including among those Republicans who rely mainly on Trump and the White House for news about the outbreak.
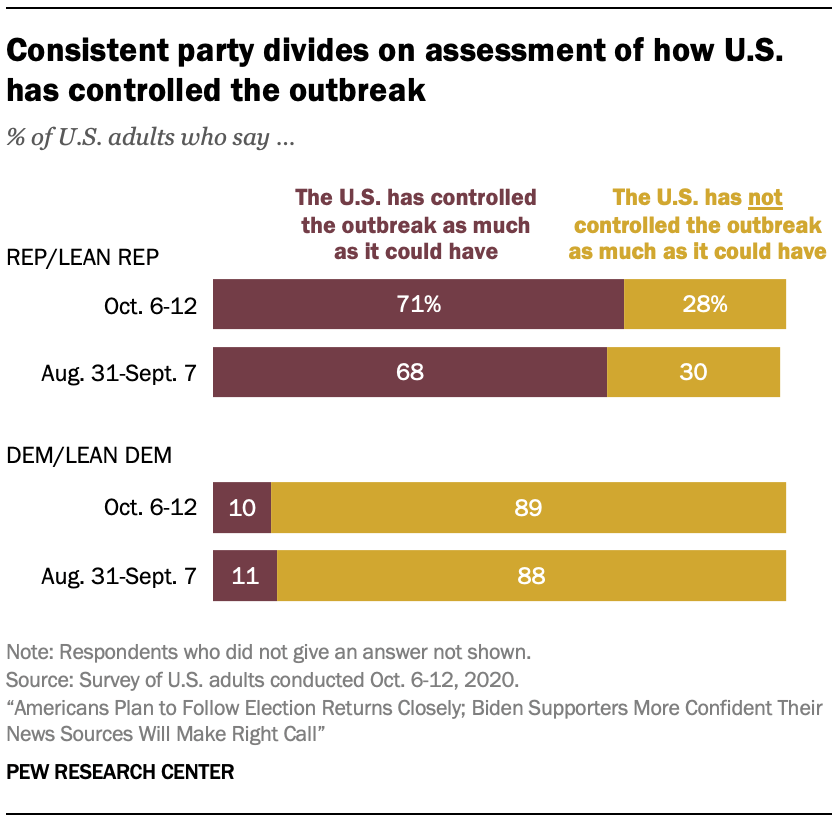
Consistent party divides on assessment of how U.S. has controlled the outbreak

Indeed, Democrats and Republicans remain worlds apart on the question of whether the U.S. has controlled the outbreak as much as it could have. Among Americans overall, about seven-in-ten Republicans and independents who lean Republican (71%) say that the U.S. has controlled the outbreak as much as it could have – compared with just 10% of Democrats and Democratic-leaning independents who say the same. An overwhelming majority of Democrats (89%) say that the U.S. has not controlled the outbreak as much as it could have, compared with about three-in-ten Republicans (28%). These numbers are largely unchanged from a survey in early September, before Trump announced that he had tested positive for the virus.

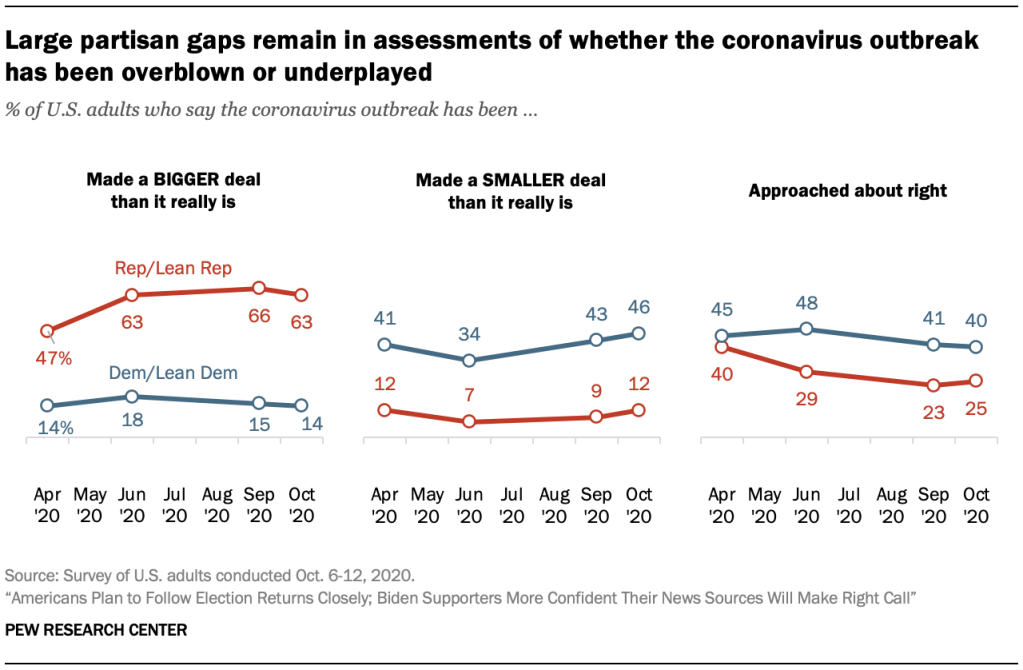
Attitudes about whether the outbreak has been made a bigger deal than it really is, made a smaller deal or approached about right are also largely unchanged from September. Large partisan gaps remain over whether the outbreak has been made a smaller deal than it really is (46% of Democrats say the outbreak has been underplayed while 12% of Republicans say the same) or a bigger deal than it really is (63% among Republicans vs. 14% among Democrats).

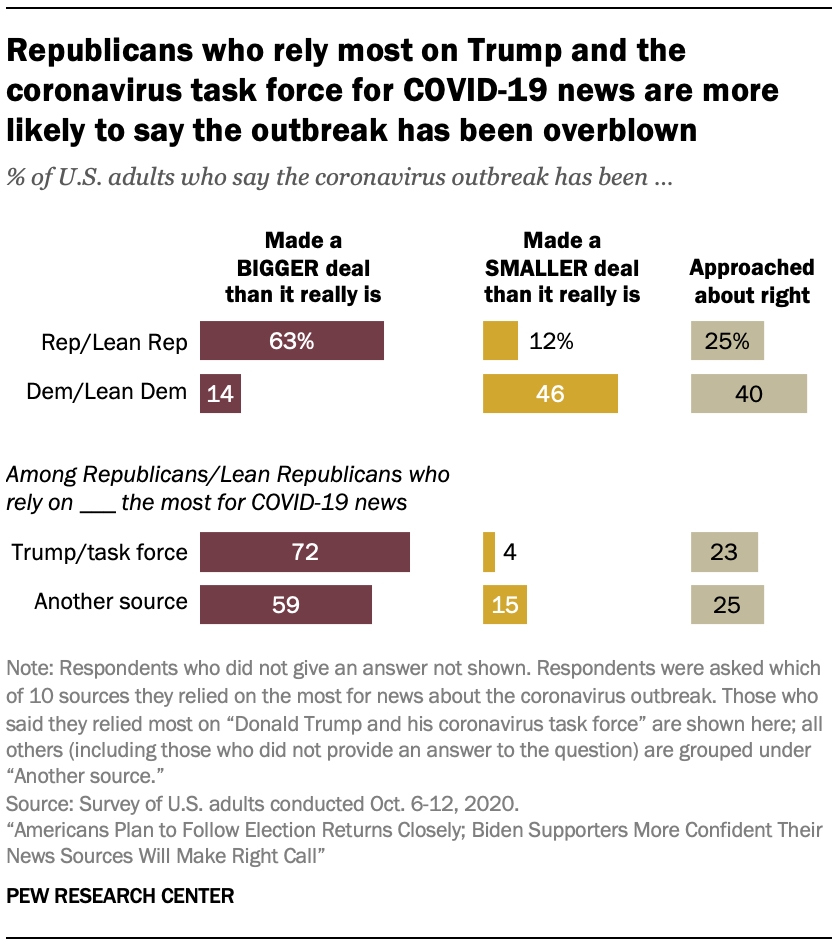
Among Republicans, the views of those who mainly rely on Trump and his coronavirus task force for coronavirus news also went unchanged. Roughly three-quarters of this group (72%) say the coronavirus outbreak has been exaggerated, nearly the same portion as said so in September (75%).

Other key findings in this report include:

  • Among registered voters, supporters of both Trump and Biden largely agree that the media should emphasize inaccurate statements so the public knows they are false, but there is more disagreement over whether the media should do the same with offensive statements. About three-quarters of Biden supporters (76%) say offensive statements should be emphasized because it’s important for the public to know about them, while 55% of Trump supporters share this view – a gap in line with the one between supporters of Trump and Hillary Clinton in 2016.
  • Registered voters who support Biden are more likely than Trump supporters to say that the election comes up in often in their conversation (33% vs. 24% of Trump supporters), and also that they have stopped talking to someone about political news because of something they said (54% say this, vs. 37% of Trump supporters).
  • There is some public confusion over the mechanics of the news media’s role in announcing winners on election night. Just under half of Americans (44%) know that news organizations declare winners in states when they feel confident based on vote returns, not when state officials can formally certify the results (26% incorrectly say this). Three-in-ten say they aren’t sure when news organizations make these calls.
  • Democrats rate the coverage of the election from the news sources they turn to most often higher than do Republicans. About a third of Democrats say their most-used news sources have covered the presidential election “very well” (36%), compared with 24% of Republicans who say the same. But, among Republicans who only rely on Fox News and/or talk radio (among eight sources asked about in the survey)  for political news, 43% say their most-used news sources have done very well, compared with three-in-ten or fewer among Republicans with different news habits.

1. Americans plan to follow election returns closely and most are confident their news sources will make the right call

Americans plan to pay close attention to Election Day 2020 results as they roll in. Roughly half of U.S. adults (48%) say they will follow Election Day results very closely, with another 32% who will do so fairly closely. A mere 6% plan to follow not at all closely.

Americans plan to tune in closely to election results

Registered voters supporting each of the two candidates plan to follow the results very closely.  About six-in-ten Joe Biden supporters (62%) and Donald Trump supporters (59%) intend to follow the election results very closely.

Majorities of Trump and Biden supporters express confidence that their news sources will make the right call when announcing a winner

Americans also express a good deal of confidence in the news sources they turn to most to make the right call when announcing the winner. The vast majority of U.S. adults (82%) have at least some confidence that their main news sources will make the right call. That breaks down to 36% who say they have a lot of confidence in the sources they turn to most, while another 46% have some confidence.

Voters who support Biden express greater confidence than supporters of Trump, though majorities of both are more confident than not. About half (49%) of Biden supporters have a lot of confidence in their main news sources to make the right call. That figure drops to 34% among registered voters who support Trump. Those who support Trump are also about twice as likely as Biden supporters to say they have not much or no confidence: 20% vs. 8%.

Many Americans don’t know how news organizations make election night calls

At the same time, though, many Americans do not have a great understanding of how news outlets make those calls. When asked which best describes how news organizations decide to announce who has won the presidential election in a state, 44% of adults correctly answered that the organizations do so when they feel confident based on vote returns and other information. A quarter (26%) incorrectly think it is when state officials are ready to formally certify the results after counting ballots (a process that often does not occur until December), and 30% say they are not sure.

There are no significant differences between Trump and Biden supporters giving the correct answer to this question.

Trump supporters more likely to turn to cable, Biden supporters to network TV to follow election results

When it comes to where Americans plan to follow election night returns, a wide mix of pathways emerge – with many Americans planning to use multiple methods over the course of the night.

Overall, the largest segment of U.S. adults (60%) say they plan to follow the election results on national network TV (such as ABC, CBS, NBC or PBS). Close behind are cable TV (55%) and news websites and apps (54%). Another 42% plan to use social media, while 28% say they will turn to a presidential candidate or campaign for the results.

About three-quarters of U.S. adults say they will use two or more of these sources (74%). A slightly higher share of Biden supporters (84%) than Trump supporters (74%) say they will use two or more news sources.

A number of viewing differences emerge between Trump and Biden supporters. Fully 78% of registered voters supporting Biden plan to turn to network TV. Far fewer Trump supporters (49%) plan to do the same. Biden supporters are also more likely to say news websites and apps will be in their mix: 63% vs. 51%. In contrast, Trump supporters look in greater numbers to a presidential candidate or their campaign. Roughly four-in-ten Trump supporters (37%) say they will follow results this way, compared with 26% of Biden supporters.

Partisans largely agree on importance of fact-checking role of the news media but not on treatment of offensive statements

While in many ways the norms of politics and campaigns seem to have shifted since the 2016 presidential election, with deep partisan divisions today over many aspects of conducting elections, certain views about the news media’s role have held steady – and with similar areas of partisan agreement and disagreement.

As in 2016, Americans say news media should emphasize both offensive and inaccurate statements, because it’s important for the public to know

One set of questions asked about how much emphasis news organizations should place on certain types of candidate statements.

About seven-in-ten U.S. adults (71%) agree that if a candidate makes an inaccurate statement, the news media should emphasize it so the public knows it is inaccurate. That is nearly identical to the sentiment expressed heading into the final stretch of the 2016 election, when 76% said the media should emphasize such statements.

Most Americans also think the news media should call out offensive statements made by a candidate: 66% say they should emphasize such statements compared with 31% who say they should not. Again, these results are consistent with views in 2016.

Trump supporters less likely to say a candidate’s offensive statements should be highlighted

Among registered voters, majorities of both Biden and Trump supporters say the news media should emphasize inaccurate statements, with Biden supporters somewhat outpacing Trump supporters: 77% to 68%, respectively.

When it comes to offensive statements, however, there is more disagreement between Biden and Trump supporters. While about three-quarters of registered voters who support Biden (76%) say the news media should call out such statements, fewer Trump supporters (55%) feel this way.

Views on both of these questions are strikingly consistent with 2016. Then, strong majorities of both Hillary Clinton and Trump supporters (among registered voters) said it was important to emphasize inaccurate statements (83% and 71%, respectively). But Trump supporters were more divided than Clinton supporters on whether the news media should emphasize offensive statements, with 49% saying they should and 45% saying they should not.

More broadly, about two-thirds of U.S. adults say that correcting inaccurate statements made by a candidate is a major responsibility of the news media. Another 21% say it is a minor responsibility, while only 12% say it is not a responsibility at all.

Biden supporters more likely than Trump supporters to say news media have a major responsibility to correct inaccurate statements

Fully 86% of Biden supporters describe this as a major responsibility of the news media, far outpacing the roughly half (54%) of Trump supporters who feel this way. Another 26% of Trump supporters call this a minor responsibility, while 19% say it is not a responsibility at all.

These figures are strikingly consistent with 2016. Heading into that election, 62% of U.S. adults said correcting inaccurate statements was a major responsibility of the news media, with a similarly large difference between Clinton and Trump supporters.

2. Interest in election news increases, with most Americans feeling worn out by the volume of coverage

Interest in the 2020 election has increased over the last month. Three-quarters of U.S. adults now say they are following news about candidates for the presidential election “very” or “fairly” closely, including 39% who are doing so very closely. That is up about 10 percentage points from early September, when 66% said the same. Attention to the election is now roughly on par with interest in news about the coronavirus outbreak, which 79% now say they are following fairly or very closely. It does still trail the height of interest in COVID-19 news in late March, when 92% said they were following it closely and nearly six-in-ten were following it very closely.

Interest in election news is high among both Trump and Biden supporters. About half of registered voters who support Trump (49%) and Biden (53%) say they are following election news very closely.

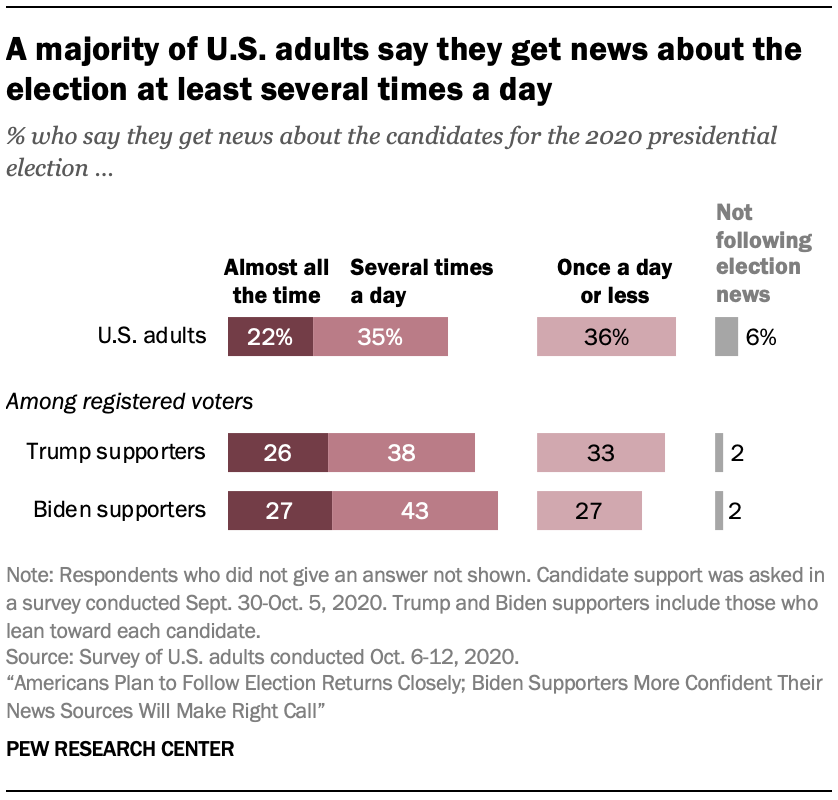
A majority of U.S. adults say they get news about the election at least several times a day

Increased attention to election news coincides with people getting many updates throughout the day. About six-in-ten U.S. adults (57%) say they are getting news about the candidates at least several times a day, with about two-in-ten (22%) who do so almost all the time.

The frequency of updates is very consistent across Trump and Biden supporters, with about a quarter of registered voters in each group getting updates almost all the time and majorities doing so at least several times a day.

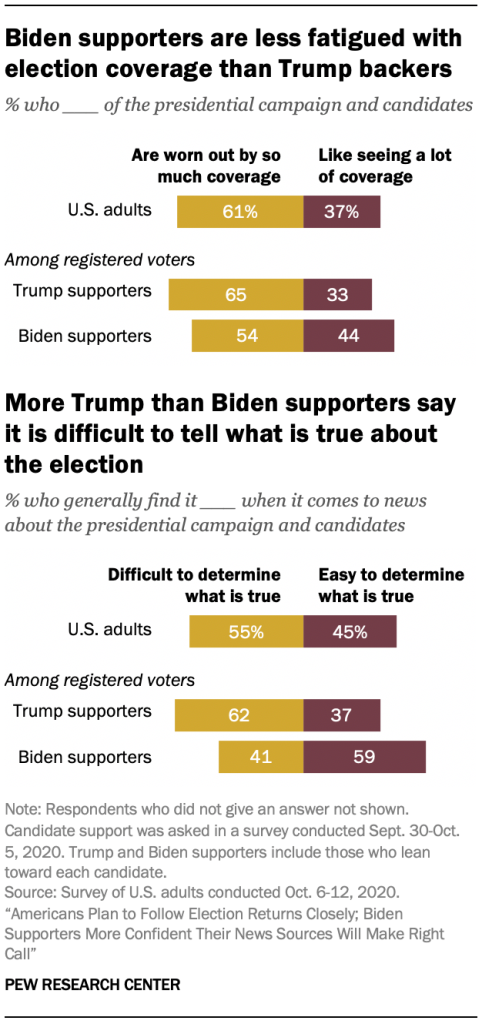
Biden supporters are less fatigued with election coverage than Trump backers

One area of difference between these groups of supporters is in the level of weariness brought on by keeping up with the news. About two-thirds of Trump supporters (65%) say they are worn out by so much coverage. That compares to just over half of Biden supporters (54%) who are worn out, while 44% say they like a lot of attention on the election.

Overall, about six-in-ten Americans (61%) say they are worn out by so much coverage of the 2020 presidential election.

Trump supporters are also more likely than Biden supporters to say they are finding it difficult to determine what is true and what is not about the presidential campaign.

Overall, U.S. adults are somewhat more likely to say they find this difficult (55%) than to say they find it easy (45%). That gap grows among registered voters supporting Trump. About six-in-ten (62%) say they find it difficult, while 37% find it easy. The figures for Biden are nearly flipped, with 59% finding it easy and 41% finding it difficult.

Biden supporters more likely to discuss the election with others, stop talking to someone because of something they said

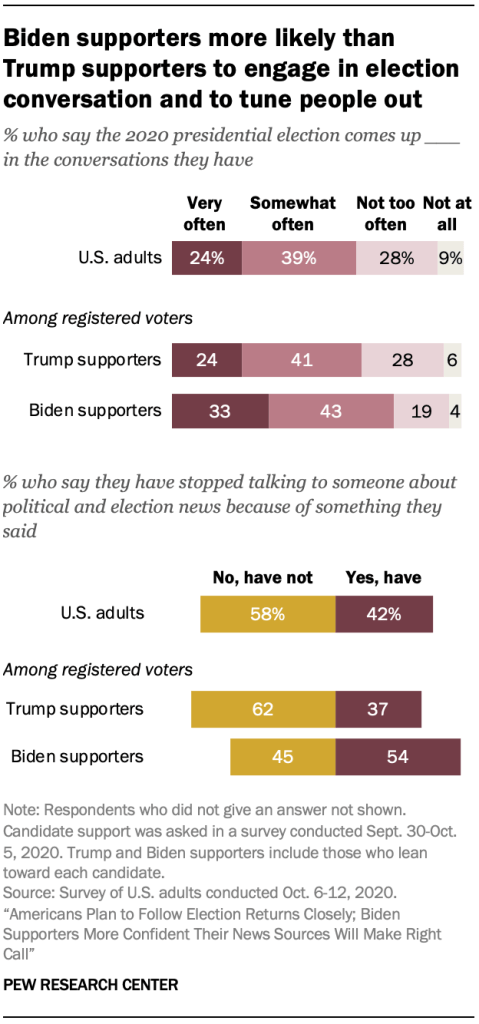
Biden supporters more likely than Trump supporters to engage in election conversation and to tune people out

Americans are frequently talking about the upcoming election with others, with Biden supporters more likely to be doing so than those who are planning to vote for Trump.

About a quarter (24%) of U.S. adults say the 2020 presidential election comes up in conversation “very often,” while another 39% say it comes up “somewhat often.” Just 9% say the election does not come up in their conversations at all.

The topic of conversation is somewhat more frequent among registered voters who say they support Biden for president than among those who support Trump. A third of Biden supporters say the topic comes up very often compared with about a quarter (24%) of Trump supporters.

The focus of these conversations also differs somewhat between the two groups of supporters. Biden supporters are more likely to say much of their election discussions focus on the candidates’ personalities and comments than are Trump supporters (71% vs. 51%). Conversely, Trump supporters are more likely than Biden supporters to say their conversations are about the issues (42% vs. 24%). (See the Pathways data tool for more about this question.)

Even as Biden supporters discuss the 2020 election more frequently, they are also more likely than Trump supporters to cut off conversation about political and election news with someone because of something they said.

Overall, about four-in-ten Americans say they have stopped talking to someone because of something they said (42% have, and 58% say they have not done this). Biden supporters are more likely to do this – 54% of registered voters who support Biden say they have stopped talking to someone about political and election news because of something they said, compared with 37% of Trump supporters.

Most Americans say the news sources they turn to most have covered the election well

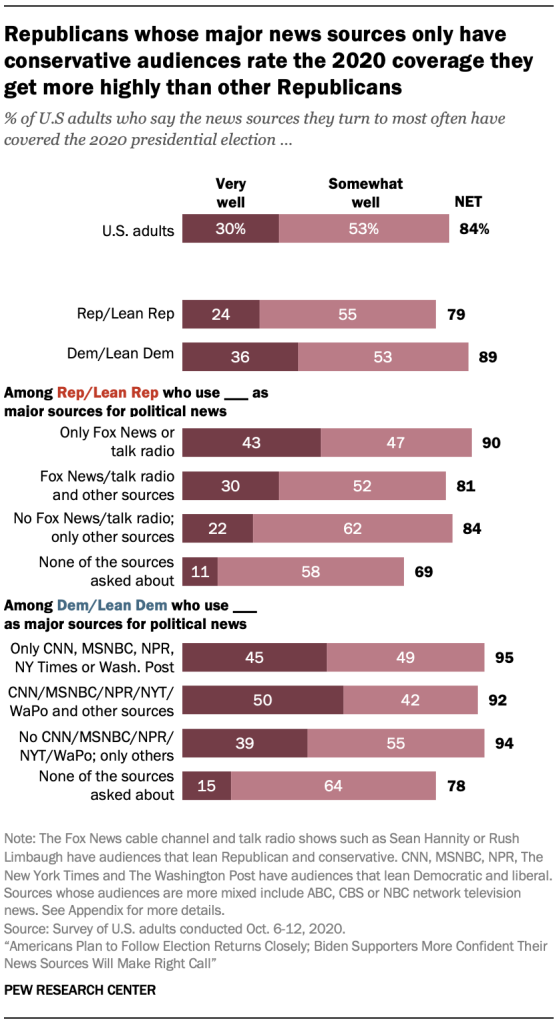
Republicans whose major news sources only have conservative audiences rate the 2020 coverage they get more highly than other Republicans

Most Americans (84%) say the news sources they turn to most often are covering the 2020 presidential election well. Three-in-ten say their most-relied on news sources have covered the election very well, while about half (53%) say these outlets have covered it somewhat well. Few U.S. adults say their most commonly used news outlets have covered the presidential election either not too well (12%) or not at all well (4%).

Democrats and independents who lean toward the Democratic Party give the news sources they turn to most higher marks for their coverage than do Republicans and Republican-leaning independents.

Nearly four-in-ten Democrats (36%) say their most-used news sources have covered the election very well, compared with about a quarter of Republicans (24%) who say the same. Roughly similar shares of Republicans and Democrats say the outlets they commonly use have done somewhat well (55% and 53%, respectively).

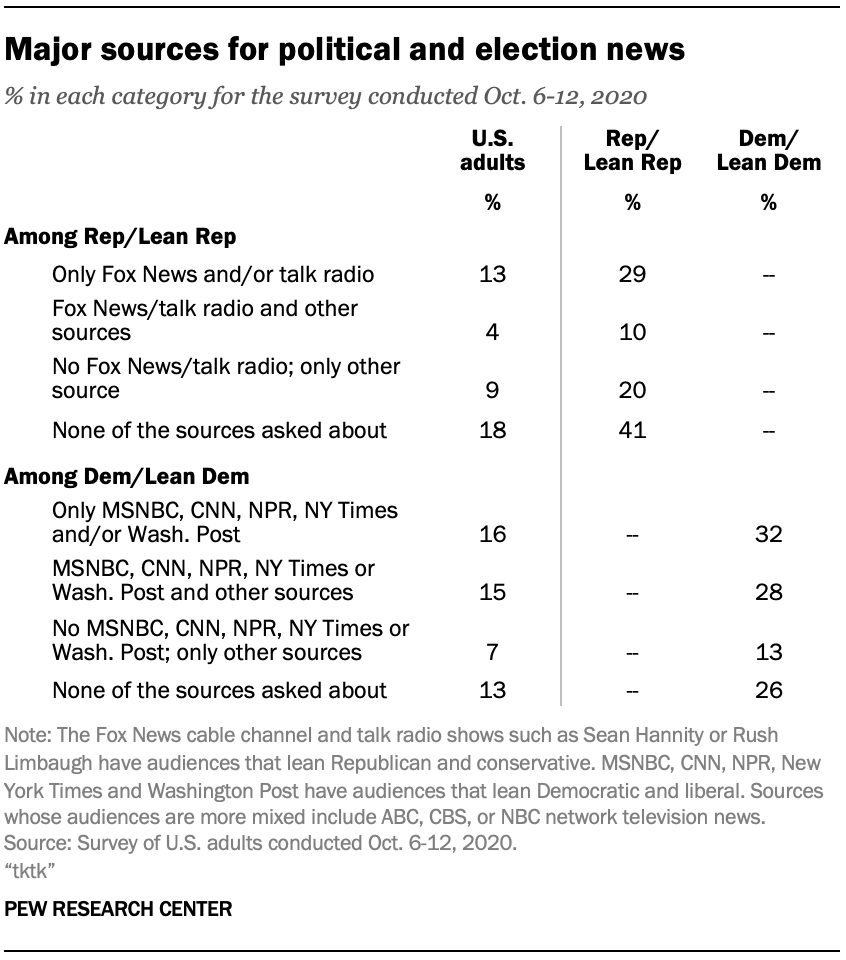
Respondents indicated on a previous survey whether each of eight news providers was a major source of political and election news for them. Researchers then grouped these responses based on the political composition of the outlets’ audiences. For example, Republicans were analyzed based on the degree to which they get political news from the outlets with conservative-leaning audiences (specifically, Fox News and talk radio), and Democrats were categorized based on the degree to which they get news from the outlets with liberal-leaning audiences – CNN, MSNBC, NPR, The New York Times and The Washington Post. (The eighth source, national network TV such as ABC, CBS or NBC, has an audience that does not lean strongly in either direction; see the Appendix for more details about how respondents were grouped by their major news sources.)

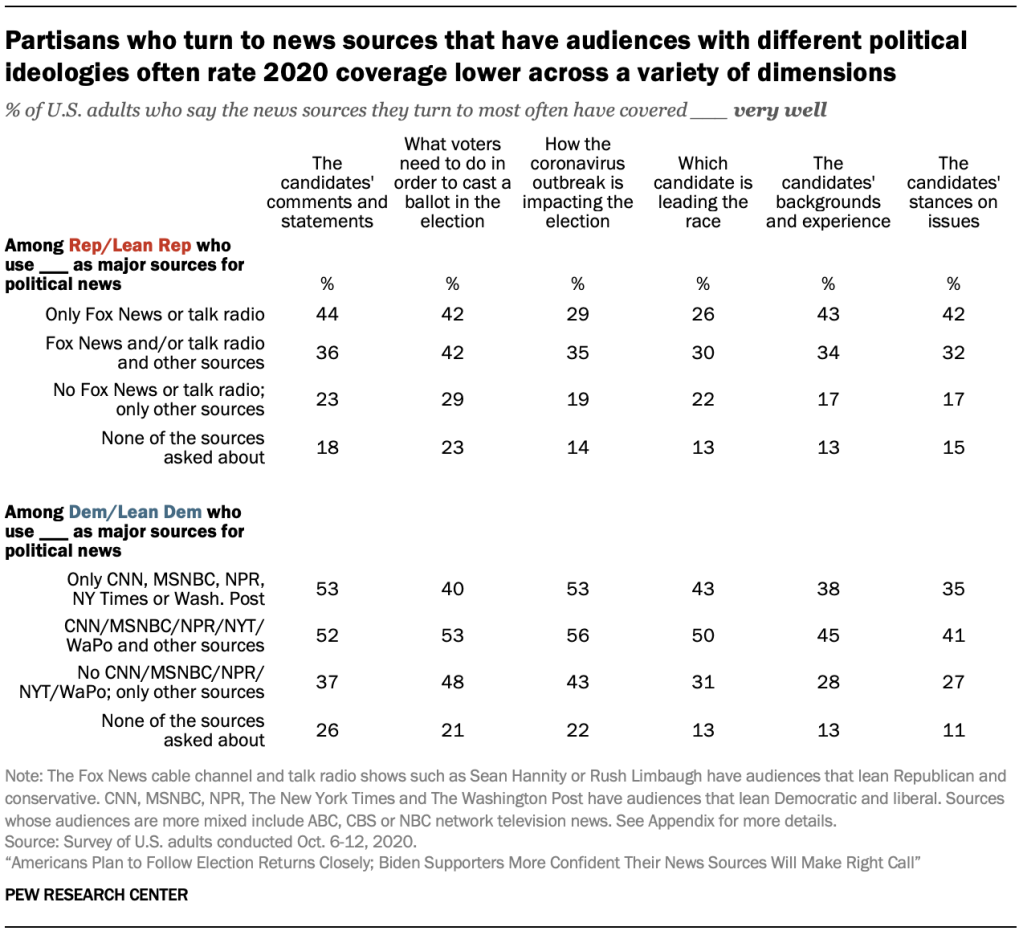
Republicans who use only Fox News and/or talk radio like Sean Hannity or Rush Limbaugh as major sources of news give much higher scores for how well their most-used news sources have covered the election (43% say very well) than Republicans who primarily use news sources with more politically mixed audiences (30% among Republicans who use Fox News or talk radio plus other outlets, and 22% among Republicans who use other outlets as major sources but not Fox News or talk radio). Republicans who do not use any of the eight sources asked about are generally the most negative about how well their most used news sources are performing.

There is less of a clear pattern among Democrats, with only modest differences in assessments of coverage between those who use outlets with left-leaning audiences and those who do not. Again, Democrats who do not use any of the eight news sources asked about are generally the most negative overall.

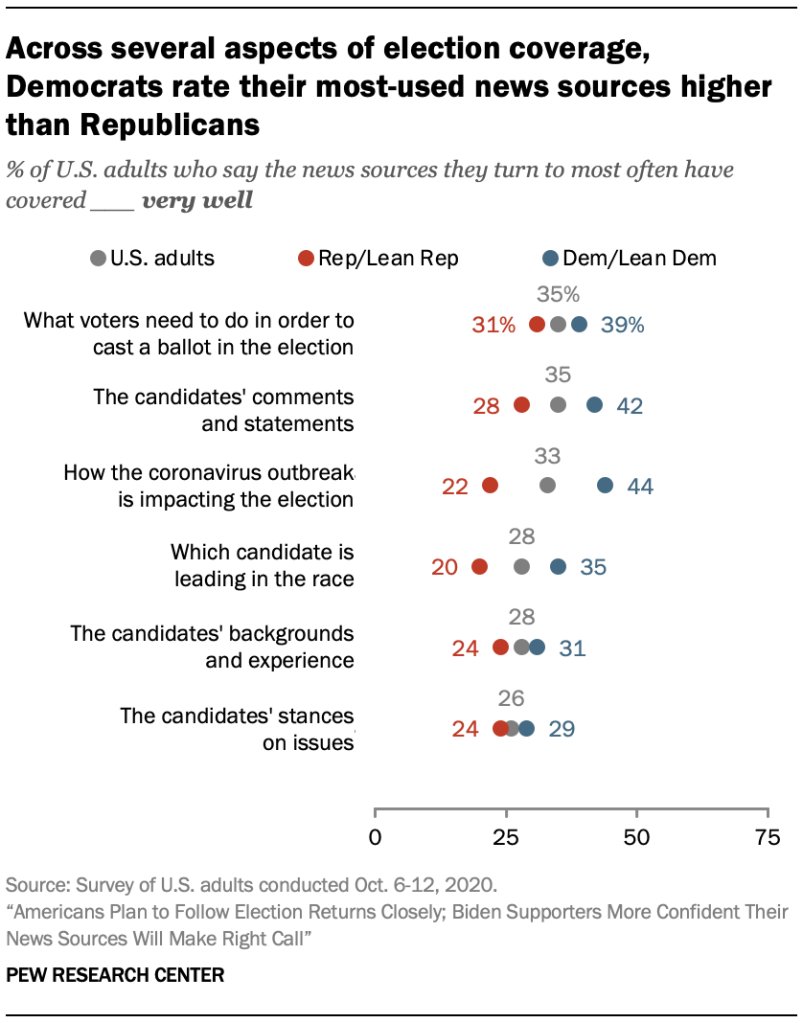
Asked in more detail to rate how well the news sources they turn to most often have covered a selection of six aspects of the 2020 election, Democrats and Democratic-leaning independents rate their outlets more highly than Republicans and Republican-leaning independents on all six.

Across several aspects of election coverage, Democrats rate their most-used news sources higher than Republicans

One of the largest gaps between Republicans and Democrats is for the coverage in their most commonly used outlets of how the coronavirus outbreak is impacting the election. Slightly more than four-in-ten Democrats (44%) say their news outlets have covered this topic very well, compared with half as many Republicans (22%).

Additionally, there is a 15 percentage point gap between the shares of Republicans (20%) and Democrats (35%) who say the news outlets they use most have done very well covering which candidate is leading in the race, as well as a 14-point gap in shares saying the candidates’ comments and statements have been covered very well (42% of Democrats vs. 28% of Republicans). The partisan gaps are more modest (about 10 points or less) on the other three items, including what voters need to do in order to cast a ballot, the candidates’ backgrounds and experience, and the candidates’ stances on the issues.

Media diet within party is linked with differences here as well, though of a different nature. Among both Republicans and Democrats (including leaners in both parties), those who give their commonly used media sources the lowest marks are generally those who use news outlets with audiences that do not align with their personal political views.

Compared with Republicans who turn to Fox News and/or talk radio as major sources, Republicans who turn to other major sources instead are the least likely to say their news sources are covering five of these six storylines very well.

Partisan voters who turn to news sources that have audiences with different political ideologies often rate 2020 coverage lower across a variety of dimensions

The story is similar among Democrats. Democrats who do not use outlets with left-leaning audiences as major sources give lower ratings on five of the six dimensions compared with Democrats who use outlets with left-leaning audiences.

The two groups who turn to none of the major sources asked about tend to be the most negative groups on most of these measures.

3. As COVID-19 hits Trump and White House, slight shift in opinion on whether the outbreak has been exaggerated

With the coronavirus outbreak having spread to the White House, Americans are now almost equally divided on the question of whether the outbreak has been exaggerated or underplayed. And after trending downward for several months, the percentage of Americans very closely following news about the coronavirus outbreak has remained steady.

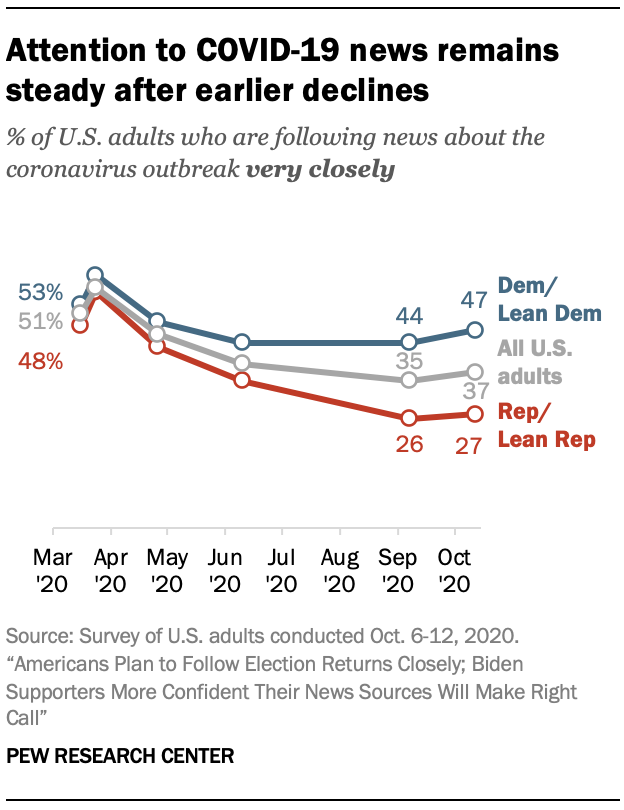
Attention to COVID-19 news remains steady after earlier declines

Among all U.S. adults, 37% say they are very closely following coronavirus news, about on par with the 35% who said they were doing so in early September. The new survey was conducted after news of President Donald Trump and the first lady testing positive broke on Oct. 2, with news of other administration officials testing positive becoming public within days of Trump’s diagnosis.

These findings show at least a pause to a steady trend of diminishing interest in coronavirus news over time. The portion of Americans very closely following coronavirus news fell from 57% at the outset of the pandemic in the U.S. in late March to 46% in late April, 39% in early June, and 35% in early September before registering most recently at 37%.

The substantial partisan gap in attention to coronavirus news that emerged in recent months remains. Nearly half of Democrats and those who lean Democratic (47%) are paying very close attention to coronavirus news, compared with about three-in-ten Republicans and Republican leaners (27%).

Public now almost equally divided on question of whether outbreak has been exaggerated or underplayed

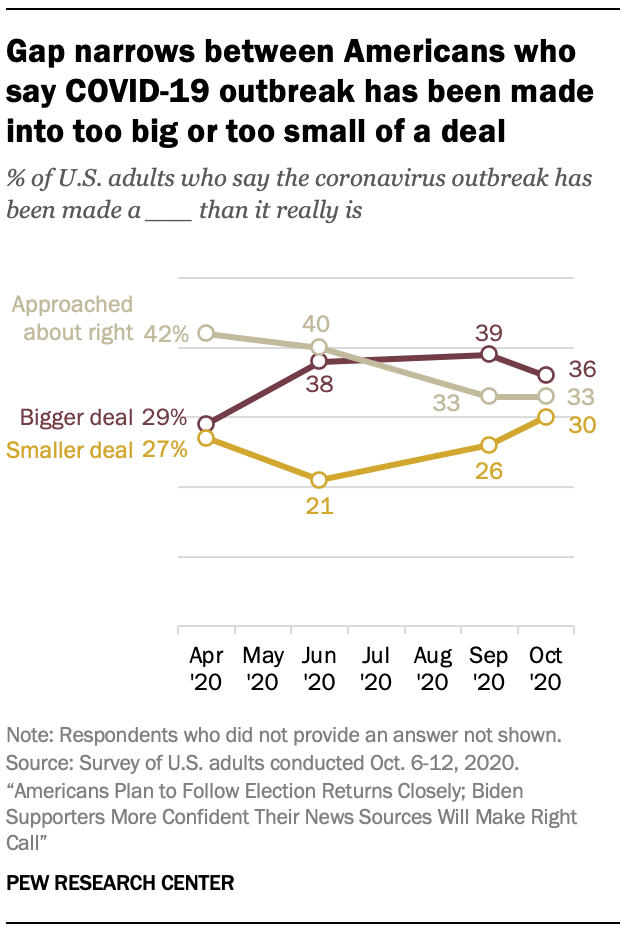
Gap narrows between Americans who say COVID-19 outbreak has been made into too big or too small of a deal

The public’s assessment of whether the coronavirus outbreak has been exaggerated or underplayed also shifted slightly after the White House infection. Overall, 36% of U.S. adults say the outbreak has been made into a bigger deal than it really is, while 30% say it has been made into a smaller deal than it really is and 33% say it has been approached about right. The 6 percentage point gap between those who say it has been exaggerated and those who say it has been underplayed is down from a gap of 13 percentage points in September (39% vs. 26%). And it is the narrowest gap since late April, when 29% said the outbreak was being made into a bigger deal than it really was and 27% said it had been underplayed.

In this most recent survey, there is major partisan disagreement on this subject, with 63% of Republicans saying the outbreak has been overblown, compared with 14% of Democrats who share this view. Meanwhile, 46% of Democrats say the pandemic has been underplayed; just 12% of Republicans say the same. These partisan divides are nearly the same as they were just prior to Trump’s infection; neither party’s responses changed substantially since September.

Large partisan gaps remain in assessments of whether the coronavirus outbreak has been overblown or underplayed
Republicans who rely most on Trump and the coronavirus task force for COVID-19 news are more likely to say the outbreak has been overblown

Among Republicans, another group whose sentiment did not shift in any significant way is the group that relies most on Trump and his task force for news about the coronavirus pandemic. (Respondents had earlier identified which of 10 types of sources they rely on most for COVID-19 news, including Trump and his task force.)

This group of Republicans who rely most on Trump and his task force have consistently been more likely than other Republicans to say that the outbreak has been exaggerated, and this continues to be true following Trump’s infection. Fully 72% of this group say that the outbreak has been overblown, compared with 59% of other Republicans. (In September, those percentages were 75% and 63%, respectively.) And just 4% of Republicans who rely on the White House most for COVID-19 news say that the outbreak has been underplayed, compared with 15% of other Republicans.

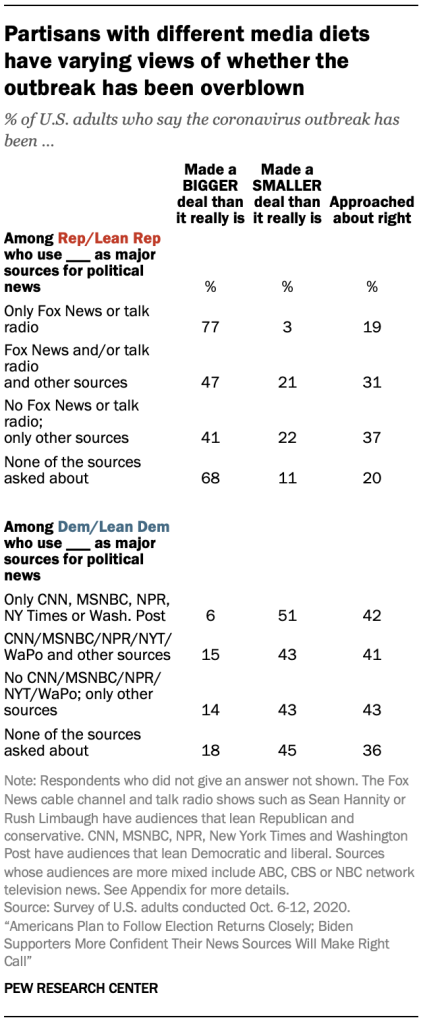
Partisans with different media diets have varying views of whether the outbreak has been overblown

Similar to findings from early September, differences within party also exist based on where partisans get their news. Republicans whose only major sources for political and election news are Fox News and talk radio were much more likely than other Republicans to say that the pandemic has been overblown – 77% say this, while 3% of this group say it has been made a smaller deal than it really is. But for Republicans whose major sources included a mix of Fox or talk radio along with other outlets, 47% say the outbreak has been made a bigger deal than it really is, with 21% saying it has been underplayed.

Among Democrats, the group only turning to outlets asked about with left-leaning audiences as major sources – CNN, MSNBC, NPR, The New York Times or The Washington Post – were more likely than other Democrats to say that the pandemic had been underplayed (51%, vs. 43% of Democrats whose major sources included a mix of those with left-leaning audiences and other sources asked about).

These patterns do not necessarily prove that partisans are taking their cues directly from their news sources. Other factors beyond media diet may impact people’s assessments of how the U.S. has reacted to the outbreak. And the relationship can go in either direction: People can either pick their media sources to fit their existing political views, or have their views shaped by those sources (or both at the same time). Still, the data shows a clear connection between news diet and views on the pandemic.

Large differences on how well U.S. controlled the outbreak based on party and news diet

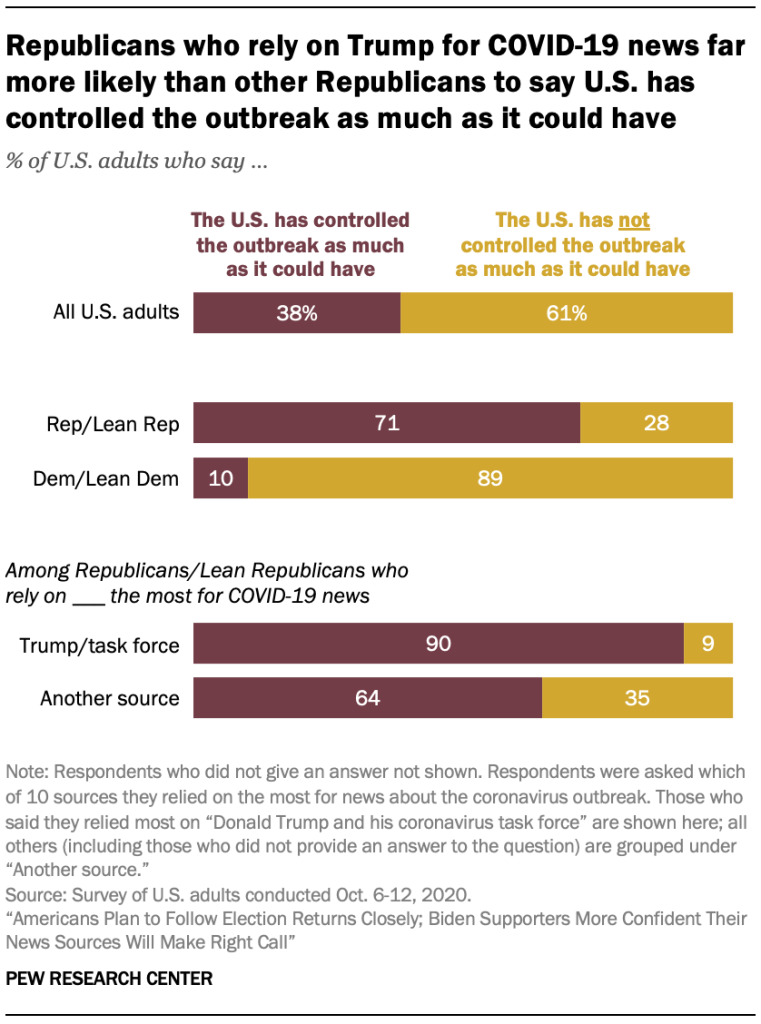
Republicans who rely on Trump for COVID-19 news far more likely than other Republicans to say U.S. has controlled the outbreak as much as it could have

When asked how well the U.S. has controlled the coronavirus outbreak, 61% of all Americans now say the country has not controlled it as much as it could have while 38% say it has – numbers that are basically unmoved since September.

The large partisan difference on this question also remains. The October survey reveals that about seven-in-ten Republicans (71%) say the country has controlled the coronavirus as much as it could, and 28% say it has not. On the Democratic side, just 10% say the outbreak has been controlled as much as possible, compared with about nine times that many who say it has not been (89%).

Among Republicans, there are differences between those who turn to the White House for information and those who don’t. Nine-in-ten who rely most on Trump and the task force for coronavirus news say the country has controlled the outbreak as much as it could, compared with about two-thirds (64%) of Republicans who don’t rely on Trump and the task force.

Republicans who rely mainly on Fox News and talk radio overwhelmingly say U.S. could not have controlled the coronavirus outbreak any better

Within the Republican Party, as in September, there are also significantly different responses based on media diet. Republicans whose major sources for political and election news only include Fox News and/or talk radio are much more likely to say the pandemic has been controlled as much as possible (93%) than those with a mix of sources (66%) and those who name some major sources, but not Fox News or talk radio (51%). The differences among Democrats who choose different media diets are much smaller.

These partisan differences over how the U.S. has controlled the outbreak, as well as the differences based on information sources within parties, have remained relatively steady from September to October.

Most know that about 200,000 have died from COVID-19 in the U.S.; those closely following coronavirus news far more likely to know this

Those paying most attention to coronavirus news far more likely to know the U.S. death count

Among all Americans, 65% correctly say that about 200,000 people have thus far lost their lives to the virus in the U.S., choosing from options ranging from 50,000 to 500,000. Another 11% say they are not sure. No other choice generated more than a 7% response.

The partisan gaps seen in other questions do not appear here – majorities of both parties respond correctly, with 69% of Democrats and those who lean Democratic choosing the correct answer along with 63% of Republicans and those who lean Republican.

There is a much larger difference depending on how closely respondents said they are following news about the outbreak. Among those following coronavirus news “very closely,” about three-quarters (77%) correctly responded to the question about the number of deaths in the U.S. That drops to about two-thirds (64%) of those who say they are following “fairly closely,” and under half (44%) of those who said they are following the outbreak “not too closely” or “not at all closely.”

The group following coronavirus news least closely (which makes up 20% of Americans) are also the most likely group to give neither a correct nor an incorrect answer, but to say that they weren’t sure what the answer was (20% said this). Those following coronavirus news more closely were less likely to say this (6% of those following very closely and 11% of those following fairly closely).

Appendix

Measuring vote preference in 2020 presidential election

Vote preference among registered voters in this report comes from a survey conducted Sept. 30-Oct. 5, 2020, among 10,543 registered voters. Of these registered voters, 8,501 also took the survey conducted Oct. 6-12 that is analyzed in this report. The initial survey asked U.S. citizens: “If the 2020 presidential election were being held today, would you vote for…” and gave the options of “Donald Trump, the Republican,” “Joe Biden, the Democrat,” “Jo Jorgensen, the Libertarian Party candidate,” “Howie Hawkins, the Green Party candidate” (in states where he appears on the ballot) and “vote for none/other.” Respondents who selected “vote for none/Other” or who skipped the first question were asked a follow-up question, “As of TODAY, do you…,” and then given the option to indicate if they “lean more toward” any of the candidates included in the first question.

Trump supporters are defined as U.S. citizens who are certain they are registered to vote who said they would either vote for Trump or who lean more toward voting for him. Biden supporters are defined as U.S. citizens who are certain they are registered to vote who selected Biden in either of the two questions.

For more about these questions on vote preference in the 2020 presidential election, see this report.

Grouping respondents by major news sources

Major sources for political and election news

A survey conducted Aug. 31-Sept. 7, 2020, asked whether respondents use any of eight news sources as a major source, minor source or not a source for political and election news. (Responses for all eight sources are available here.) The sources identified as major sources were combined with the respondents’ partisanship to identify those who get news from only sources with audiences that lean toward their party (i.e., Republicans who get news only from sources with right-leaning audiences and Democrats who only get news from sources with left-leaning audiences) or another mix of sources. Those who do not use any of the eight sources asked about as a major source for political and election news are in a separate category. Researchers merged the responses to these questions from late August and early September to the survey data collected Oct. 6-12, 2020.

The eight sources asked about are:

  • Fox News cable channel
  • CNN
  • MSNBC
  • ABC, CBS or NBC national network TV
  • NPR
  • The New York Times
  • The Washington Post
  • Talk radio, such as Sean Hannity or Rush Limbaugh

Sources were selected from among the top responses (used by about 10% or more of U.S. adults) to a question from November 2019 asking if respondents got news from each of 30 different sources in the past week. More details about this measure and what it reveals about Americans’ news habits are available here, and all data for the question is available here.

The eight sources asked about were then classified according to the political partisanship and ideology of their audiences. For this analysis, respondents who call each source a “major source” for political and election news are considered part of its audience.

An outlet is considered to have a left-leaning audience if the proportion of all audience members that identify as liberal Democrats is at least two-thirds higher than the proportion who identify as conservative Republicans. Alternatively, an outlet is considered to have a right-leaning audience if the proportion of all audience members who identify as conservative Republicans is at least two-thirds higher than the proportion that identify as liberal Democrats. An outlet is classified as having a mixed audience if neither liberal Democrats nor conservative Republicans make up at least two-thirds more of the audience than the other.

Respondents who did not complete the survey conducted Aug. 31-Sept. 7, 2020 are not included in the analysis using these media habits.

Acknowledgments

The American News Pathways project was made possible by The Pew Charitable Trusts. Pew Research Center is a subsidiary of The Pew Charitable Trusts, its primary funder. This initiative is a collaborative effort based on the input and analysis of the following individuals. Find related reports online at https://alpha.pewresearch.org/pewresearch-org/topics/election-news-pathways/.

Research Team

Amy Mitchell, Director, Journalism Research Baxter Oliphant, Senior Researcher Katerina Eva Matsa, Associate Director, Journalism Research Elisa Shearer, Research Associate Mason Walker, Research Analyst Mark Jurkowitz, Senior Writer Michael Lipka, Editorial Manager, Religion Research                    Michael Barthel, Senior Researcher Jeffrey Gottfried, Senior Researcher Galen Stocking, Computational Social Scientist Maya Khuzam, Research Assistant Kirsten Worden, Research Assistant Andrew Mercer, Senior Research Methodologist Dorene Asare Marfo, Survey Research Methodologist Scott Keeter, Senior Survey Advisor Claudia Deane, Vice President, Research Nick Bertoni, Panel Manager Courtney Kennedy, Director, Survey Research

Editorial and Graphic Design

David Kent, Senior Copy Editor Margaret Porteus, Information Graphics Designer Alissa Scheller, Information Graphics Designer Peter Bell, Design Director Andrea Caumont, Digital Engagement Manager John Gramlich, Senior Writer/Editor Bruce Drake, Senior Editor

Communications and Web Publishing

Rachel Weisel, Senior Communications Manager Hannah Klein, Communications Manager Calvin Jordan, Communications Associate Andrew Grant, Communications Associate Sara Atske, Associate Digital Producer Shannon Greenwood, Digital Producer Stacy Rosenberg, Associate Director, Digital Seth Rubenstein, Lead Web Developer Benjamin Wormald, Web Developer Carrie Elizabeth Blazina, Associate Digital Producer Kelly Browning, User Experience Manager Michael Piccorossi, Director, Digital Strategy


Methodology

The American Trends Panel survey methodology

Overview

The American Trends Panel (ATP), created by Pew Research Center, is a nationally representative panel of randomly selected U.S. adults. Panelists participate via self-administered web surveys. Panelists who do not have internet access at home are provided with a tablet and wireless internet connection. Interviews are conducted in both English and Spanish. The panel is being managed by Ipsos.

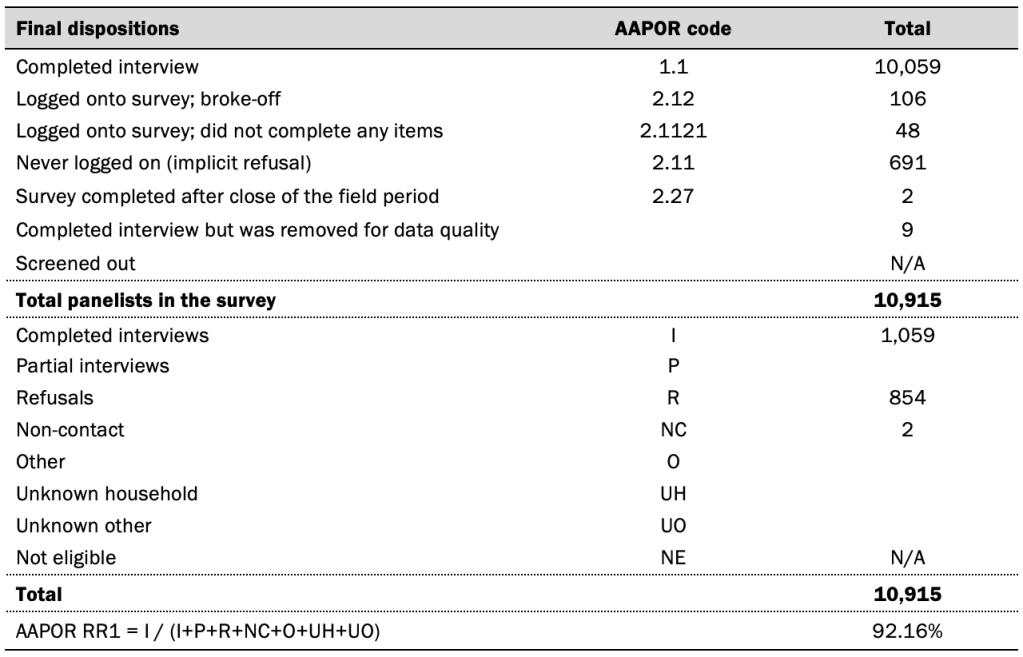
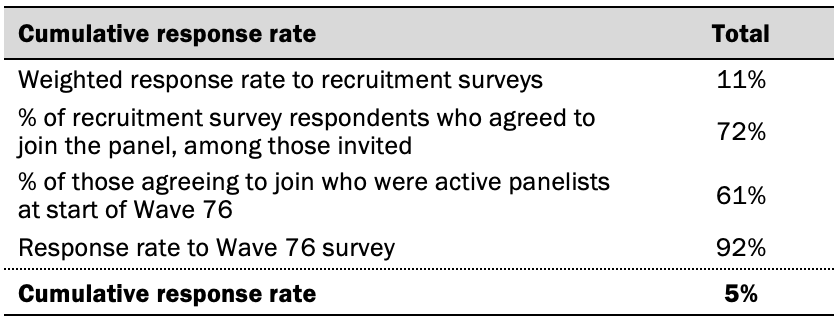
Data in this report is drawn from the panel wave conducted Oct. 6 to Oct. 12, 2020. A total of 10,059 panelists responded out of 10,915 who were sampled, for a response rate of 92%. This does not include nine panelists who were removed from the data due to extremely high rates of refusal or straightlining. The cumulative response rate accounting for nonresponse to the recruitment surveys and attrition is 5%. The break-off rate among panelists who logged on to the survey and completed at least one item is 1%. The margin of sampling error for the full sample of 10,059 respondents is plus or minus 1.7 percentage points.

Panel recruitment

American Trends Panel recruitment surveys

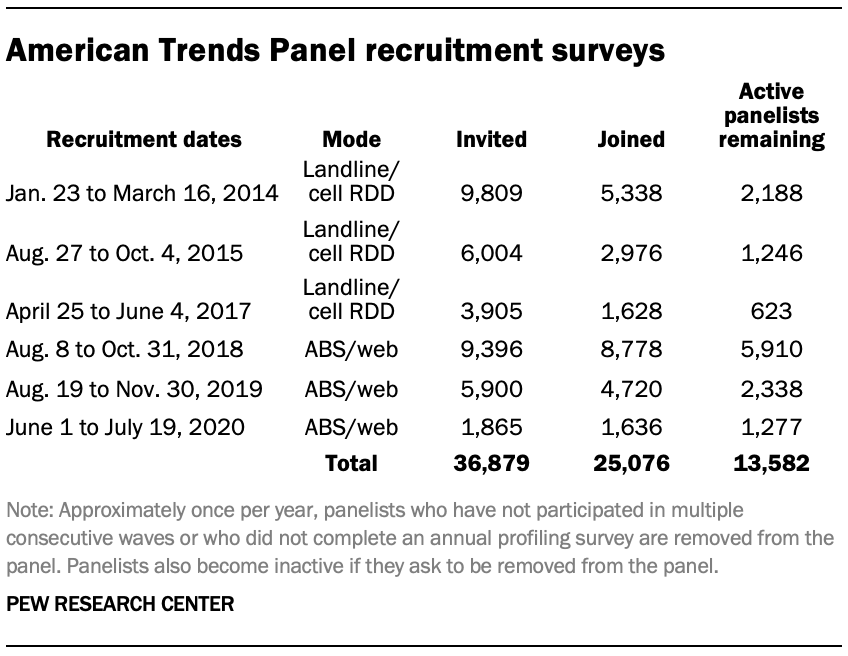
The ATP was created in 2014, with the first cohort of panelists invited to join the panel at the end of a large, national, landline and cellphone random-digit-dial survey that was conducted in both English and Spanish. Two additional recruitments were conducted using the same method in 2015 and 2017, respectively. Across these three surveys, a total of 19,718 adults were invited to join the ATP, of whom 9,942 (50%) agreed to participate.

In August 2018, the ATP switched from telephone to address-based recruitment. Invitations were sent to a random, address-based sample of households selected from the U.S. Postal Service’s Delivery Sequence File. Two additional recruitments were conducted using the same method in 2019 and 2020, respectively. Across these three address-based recruitments, a total of 17,161 adults were invited to join the ATP, of whom 15,134 (88%) agreed to join the panel and completed an initial profile survey. In each household, the adult with the next birthday was asked to go online to complete a survey, at the end of which they were invited to join the panel. Of the 25,076 individuals who have ever joined the ATP, 13,582 remained active panelists and continued to receive survey invitations at the time this survey was conducted.

The U.S. Postal Service’s Delivery Sequence File has been estimated to cover as much as 98% of the population, although some studies suggest that the coverage could be in the low 90% range.1 The American Trends Panel never uses breakout routers or chains that direct respondents to additional surveys.

Sample design

The subsample from the ATP consisted of 10,915 ATP members who responded to the Wave 57 survey and were still active.

Questionnaire development and testing

The questionnaire was developed by Pew Research Center in consultation with Ipsos. The web program was rigorously tested on both PC and mobile devices by the Ipsos project management team and Pew Research Center researchers. The Ipsos project management team also populated test data which was analyzed in SPSS to ensure the logic and randomizations were working as intended before launching the survey.

Incentives

All respondents were offered a post-paid incentive for their participation. Respondents could choose to receive the post-paid incentive in the form of a check or a gift code to Amazon.com or could choose to decline the incentive. Incentive amounts ranged from $5 to $15 depending on whether the respondent belongs to a part of the population that is harder or easier to reach. Differential incentive amounts were designed to increase panel survey participation among groups that traditionally have low survey response propensities.

Data collection protocol

The data collection field period for this survey was Oct. 6 to Oct. 12, 2020. Postcard notifications were mailed to all ATP panelists with a known residential address on Oct. 6, 2020.

On Oct. 6 and Oct. 7, invitations were sent out in two separate launches: Soft Launch and Full Launch. Sixty panelists were included in the soft launch, which began with an initial invitation sent on Oct. 6, 2020. The ATP panelists chosen for the initial soft launch were known responders who had completed previous ATP surveys within one day of receiving their invitation. All remaining English- and Spanish-speaking panelists were included in the full launch and were sent an invitation on Oct. 7, 2020.

All panelists with an email address received an email invitation and up to two email reminders if they did not respond to the survey. All ATP panelists that consented to SMS messages received an SMS invitation and up to two SMS reminders.

Invitation and reminder dates

Data quality checks

To ensure high-quality data, the Center’s researchers performed data quality checks to identify any respondents showing clear patterns of satisficing. This includes checking for very high rates of leaving questions blank, as well as always selecting the first or last answer presented. As a result of this checking, nine ATP respondents were removed from the survey dataset prior to weighting and analysis.

Weighting

Weighting dimensions

The ATP data was weighted in a multistep process that accounts for multiple stages of sampling and nonresponse that occur at different points in the survey process. First, each panelist begins with a base weight that reflects their probability of selection for their initial recruitment survey (and the probability of being invited to participate in the panel in cases where only a subsample of respondents were invited). The base weights for panelists recruited in different years are scaled to be proportionate to the effective sample size for all active panelists in their cohort. To correct for nonresponse to the initial recruitment surveys and gradual panel attrition, the base weights for all active panelists are calibrated to align with the population benchmarks identified in the accompanying table to create a full-panel weight.

For ATP waves in which only a subsample of panelists are invited to participate, a wave-specific base weight is created by adjusting the full-panel weights for subsampled panelists to account for any differential probabilities of selection for the particular panel wave. For waves in which all active panelists are invited to participate, the wave-specific base weight is identical to the full-panel weight.

In the final weighting step, the wave-specific base weights for panelists who completed the survey are again calibrated to match the population benchmarks specified above. These weights are trimmed (typically at about the 1st and 99th percentiles) to reduce the loss in precision stemming from variance in the weights. Sampling errors and test of statistical significance take into account the effect of weighting.

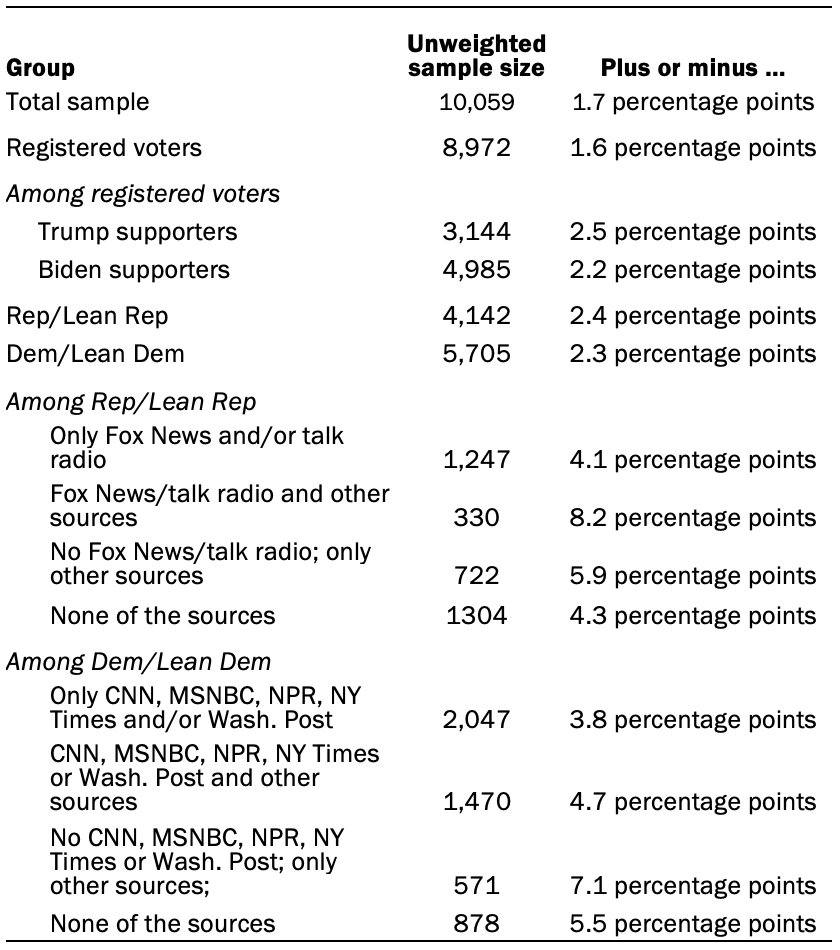
The following table shows the unweighted sample sizes and the error attributable to sampling that would be expected at the 95% level of confidence for different groups in the survey.

The unweighted sample sizes and the error attributable to sampling

Sample sizes and sampling errors for other subgroups are available upon request. In addition to sampling error, one should bear in mind that question wording and practical difficulties in conducting surveys can introduce error or bias into the findings of opinion polls.

Dispositions and response rates

Final dispositions
Cumulative response rate

CORRECTION (October 2020): The Cumulative Response Rate table has been updated to reflect the correct numbers. None of the study findings or conclusions were affected.

© Pew Research Center, 2020