U.S. Media Polarization and the 2020 Election: A Nation Divided
Deep partisan divisions exist in the news sources Americans trust, distrust and rely on
BYMark Jurkowitz, Amy Mitchell, Elisa Shearer and Mason Walker
About Pew Research Center
Pew Research Center is a nonpartisan, nonadvocacy fact tank that informs the public about the issues, attitudes and trends shaping the world. It does not take policy positions. The Center conducts public opinion polling, demographic research, computational social science research and other data-driven research. It studies politics and policy; news habits and media; the internet and technology; religion; race and ethnicity; international affairs; social, demographic and economic trends; science; research methodology and data science; and immigration and migration. Pew Research Center is a subsidiary of The Pew Charitable Trusts, its primary funder.
U.S. Media Polarization and the 2020 Election: A Nation Divided
Deep partisan divisions exist in the news sources Americans trust, distrust and rely on
How we did this
As the news media landscape continues to evolve, Americans’ news habits are also changing. In this study, we take a snapshot of the news outlets people rely on and trust for news about politics and the upcoming national elections. We examine responses based on party identification to see whether Republicans and Democrats are turning to similar, or different, sources of information
To do this, we surveyed 12,043 U.S. adults in October and November of 2019 and asked whether they had heard of or used any of 30 media sources, chosen so that respondents were asked about a range of news media across different platforms. Everyone who took part is a member of Pew Research Center’s American Trends Panel (ATP), an online survey panel that is recruited through national, random sampling of residential addresses. Recruiting our panelists by phone or mail ensures that nearly all U.S. adults have a chance of selection. This gives us confidence that any sample can represent the whole population. To further ensure that each survey reflects a balanced cross section of the nation, the data are weighted to match the U.S. adult population by gender, race, ethnicity, partisan affiliation, education and other categories.
For more, see the report’s methodology and this Q&A about the project. You can also find the questions we asked, and the answers the public provided, in this topline.
As the U.S. enters a heated 2020 presidential election year, a new Pew Research Center report finds that Republicans and Democrats place their trust in two nearly inverse news media environments.
Overall, Republicans and Republican-leaning independents view many heavily relied on sources across a range of platforms as untrustworthy. At the same time, Democrats and independents who lean Democratic see most of those sources as credible and rely on them to a far greater degree, according to the survey of 12,043 U.S. adults conducted Oct. 29–Nov. 11, 2019, on Pew Research Center’s American Trends Panel.
These divides are even more pronounced between conservative Republicans and liberal Democrats.
Moreover, evidence suggests that partisan polarization in the use and trust of media sources has widened in the past five years. A comparison to a similar study by the Center of web-using U.S. adults in 2014 finds that Republicans have grown increasingly alienated from most of the more established sources, while Democrats’ confidence in them remains stable, and in some cases, has strengthened.
How we asked about trust and distrust
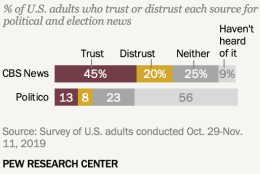
Respondents were first asked if they heard of the source, then if so, whether they trust or distrust it for political and election news and whether they got political and election news there in the past week. The two examples below show one outlet (CBS News) that is heard of by the vast majority of U.S. adults and is also trusted by far more people than distrusted, and another outlet (Politico) that has been heard of by far fewer adults (44%) but is still trusted by more people than distrusted, even though just 13% of the public expresses trust. See the methodology for a description of how the 30 outlets were selected.
The study asked about use of, trust in, and distrust of 30 different news sources for political and election news. While it is impossible to represent the entire crowded media space, the outlets, which range from network television news to Rush Limbaugh to the New York Times to the Washington Examiner to HuffPost, were selected to represent popular media brands across a range of platforms.
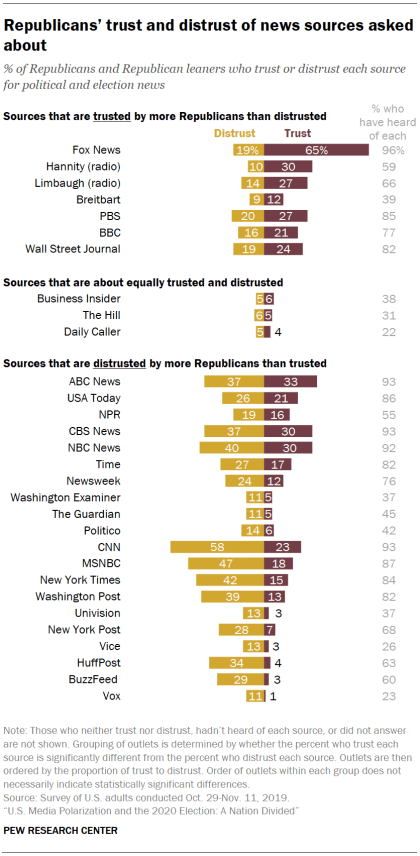
Greater portions of Republicans express distrust than express trust of 20 of the 30 sources asked about. Only seven outlets generate more trust than distrust among Republicans – including Fox News and the talk radio programs of hosts Sean Hannity and Rush Limbaugh.
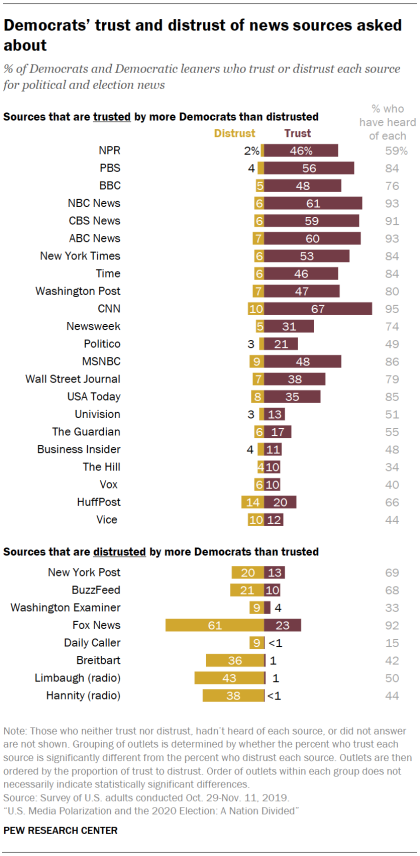
For Democrats, the numbers are almost reversed. Greater portions of Democrats express trust than express distrust in 22 of the 30 sources asked about. Only eight generate more distrust than trust – including Fox News, Sean Hannity and Rush Limbaugh.
Another way to look at the diverging partisan views of media credibility: Almost half of the sources included in this report (13) are trusted by at least 33% of Democrats, but only two are trusted by at least 33% of Republicans.
Republicans’ lower trust in a variety of measured news sources coincides with their infrequent use. Overall, only one source, Fox News, was used by at least one-third of Republicans for political and election news in the past week. There are five different sources from which at least one-third of Democrats received political or election news in the last week (CNN, NBC News, ABC News, CBS News and MSNBC).
And in what epitomizes this era of polarized news, none of the 30 sources is trusted by more than 50% of all U.S. adults.
The Fox News phenomenon
In the more compact Republican media ecosystem, one outlet towers above all others: Fox News. It would be hard to overstate its connection as a trusted go-to source of political news for Republicans.
About two-thirds (65%) of Republicans and Republican leaners say they trust Fox News as a source. Additionally, 60% say they got political or election news there in the past week.
Among Democrats and Democratic leaners, CNN (67%) is about as trusted a source of information as Fox News is among Republicans. The cable network is also Democrats’ most commonly turned to source for political and election news, with about half (53%) saying they got news there in the past week.
The big difference is that while no other source comes close to rivaling Fox News’ appeal to Republicans, a number of sources other than CNN are also highly trusted and frequently used by Democrats.
The impact of political ideology on Americans’ trust in news outlets
The partisan gaps become even more dramatic when looking at the parties’ ideological poles – conservative Republicans and liberal Democrats.1 About two-thirds of liberal Democrats (66%) trust The New York Times, for example. In comparison, just 10% of conservative Republicans trust the Times, while 50% outright distrust it. Rush Limbaugh, meanwhile, is the third-most trusted source among conservative Republicans (38%) but tied for the second-most distrusted source among liberal Democrats (55%).
At the same time, the gap is less pronounced among the more moderate segments in each party. For example, three-quarters of conservative Republicans trust Fox News, while just about half (51%) of moderate or liberal Republicans do. Conversely, moderate and conservative Democrats are more than twice as likely as liberal Democrats to trust Fox News (32% vs. 12%).
The divide widens over time
There is also evidence that suggests that these partisan divides have grown over the past five years, particularly with more Republicans voicing distrust in a number of sources. A comparison to a similar study of web-using U.S. adults conducted by the Center in 2014 finds that Republicans’ distrust increased for 15 of the 20 sources asked about in both years – with notable growth in Republicans’ distrust of CNN, The Washington Post, and The New York Times.
Democrats’ levels of trust and distrust in media sources have changed considerably less than Republicans’ during this time span. Even accounting for the modest methodological differences between the two studies, these differences hold. (Details about the two studies can be found in the methodology.)
All in all, it’s not that partisans live in entirely separate media bubbles when it comes to political news. There is some overlap in news sources, but determining the full extent of that overlap can be difficult to gauge. One factor is that getting news from a source does not always mean trusting that source. Indeed, the data reveals that while 24% of Republicans got news from CNN in the past week, roughly four-in-ten who did (39%) say they distrust the outlet. And of the 23% of Democrats who got political news from Fox News in the past week, nearly three-in-ten (27%) distrust it.
1. Democrats report much higher levels of trust in a number of news sources than Republicans
One of the clearest differences between Americans on opposing sides of the political aisle is that large portions of Democrats express trust in a far greater number of news sources.
This analysis asked individuals about 30 specific news sources across different platforms, selected on a range of measures including audience size, topic areas covered and relevance to political news. (For more details, see the methodology.) Respondents were shown grids of sources and asked to click on those they had heard of. Among the outlets respondents had heard of, they were asked to then click on those they trusted and then those they distrusted for political and election news. It’s worth noting that trust and distrust figures are somewhat dependent on how much of the population has heard of the source. Outlets with low awareness among the public, for example, would also necessarily have smaller portions who could express trust or distrust.
Almost half (13) of the 30 sources asked about are trusted by at least 33% of Democrats, and six are trusted by at least 50%. Among Democrats and Democratic leaners, CNN sits at the top, trusted by two-thirds (67%) of Democrats. That is followed by the three commercial broadcast networks, all closely bunched together: NBC News (61% of Democrats), ABC News (60%) and CBS News (59%).
How respondents were asked about 30 sources
Respondents were shown grids of 30 news outlets and asked to select the ones that they had heard of. If they had heard of an outlet, they were asked if they trusted it for political and election news. If they didn’t say that they trust an outlet, they were then asked if they distrusted it. Finally, respondents were asked if they had gotten political or election news in the past week from any of the outlets they had heard about. See the methodology for more details.
Also trusted by at least 50% of Democrats are the public television outlet PBS (56%) and The New York Times (53%). Next come the United Kingdom-based public media outlet BBC (48%), the cable channel MSNBC (48%) and The Washington Post (47%). Public radio outlet NPR and Time magazine are each trusted by 46% of Democrats.
Conversely, after the 65% of Republicans and Republican leaners who trust Fox News as a source, trust levels drop precipitously. The only other source trusted by as many as one-third of Republicans is ABC (33% of Republicans), followed closely by CBS, NBC and the Sean Hannity radio show (all at 30%). Even though the three broadcast networks rank among Republicans’ top five most-trusted sources, only about half as many Republicans as Democrats trust them.
Similarly, the percentage of Republicans who trust The New York Times (15%) and The Washington Post (13%) is about a third of the share of Democrats who do.
Trust measures for the full list of sources can be found in the sortable tables below, but in all, 18 sources are trusted by fewer than 20% of Republicans, compared with 13 trusted by fewer than 20% of Democrats.
Distrust levels offer a near reverse image of party-line gaps in trust
It is one thing to not express trust in an outlet; voicing outright distrust is another matter. Hefty party-line differences come through when looking at levels of distrust as well.
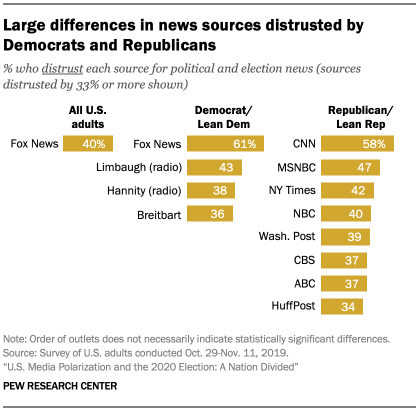
Only four of the 30 sources in this study are distrusted by one-third or more Democrats and Democratic leaners. At the top of the list by a wide margin is Fox News, distrusted by 61% of Democrats for political and election news.
Other sources distrusted by a third or more of Democrats are Rush Limbaugh (43%), the Sean Hannity radio show (38%) and Breitbart (36%). Here is it worth noting that only between 40% and 50% of Democrats have heard of those sources, which means the vast majority who could weigh in express distrust.
Beyond these news outlets, there is little Democratic distrust to go around. Fewer than 10% of Democrats distrust the three major commercial broadcast networks, the two U.S. public media sources (NPR and PBS), the two weekly news magazines (Newsweek and Time magazine) or the four daily newspapers with a national reach. These numbers are another way of reflecting Democrats’ confidence in many sources in this study.
Among Republicans and Republican leaners, distrust of media sources is more common. Eight sources – twice as many as the Democrats’ total — are distrusted by at least one-third of Republicans. At the top of the list is CNN, which is distrusted by 58% of Republicans. Then come MSNBC (distrusted by 47%), The New York Times (42%), NBC (40%), The Washington Post (39%), CBS (37%), ABC (37%) and HuffPost (34%).
All of these sources, with the exception of HuffPost, are distrusted by 10% or fewer of Democrats – and trusted by 47% or more.
Conversely, the four sources distrusted by the most Democrats – Sean Hannity, Breitbart, Rush Limbaugh and Fox News – are distrusted by 20% or fewer of Republicans.
Ratios of trust and distrust in news sources help tell the story
The extent of partisan media polarization – the fundamental divergence over the credibility of news sources – may be most clearly reflected by looking at trust and distrust together.
Of the 30 sources examined in this study, there are seven that Republicans (and those who lean Republican) trust more than they distrust for political and election news, 20 are distrusted by more Republicans than trusted, and three receive a mixed verdict.
Among Democrats (and those who lean Democratic), the numbers are close to reversed: 22 sources are trusted by more Democrats than distrusted, while eight are distrusted by more Democrats than trusted.
Of the sources trusted by more Republicans than distrusted, Fox News stands out. More than three times as many Republicans trust it as distrust it for political and election news (65% of Republicans vs. 19% who express distrust). The Sean Hannity radio show is trusted by three times as many Republicans as those who distrust it (30% of Republicans trust it vs. 10% who distrust it). Rush Limbaugh is trusted by 27% of Republicans and distrusted by 14%.
How to read graphics showing trust and distrust
These graphics compare how many people trust each outlet to how many distrust it. The outlets are grouped into one of three groups: Sources that are trusted by more people than distrusted; sources that are distrusted by more people than trusted; or sources that are trusted and distrusted by about the same amount of people. Assignments to each group are based on whether the percent of people who trust each outlet is statistically significantly different from the percent who distrust it. Within those groups, the outlets are sorted from top to bottom by the ratio of trust to distrust. The order does not necessarily indicate that an outlet’s overall level of trust is significantly different from the outlet below or above it.
Respondents were only asked whether they trust or distrust an outlet if they had heard of it (see the topline.) For several outlets, large portions of the population have not heard of them, resulting in small segments who could express trust or distrust.
Outlets included in the study reflect a mix of sources of political and election news. To see more about how we chose the 30 outlets asked about, see the methodology.
Other sources trusted by more Republicans than distrusted include several long-established news outlets where the ratio of trust to distrust is narrower. PBS is trusted by 27% of Republicans and distrusted by 20%, the BBC is trusted by 21% and distrusted by 16%, and The Wall Street Journal is trusted by 24% and distrusted by 19%.
Not only are Democrats much more likely to express more trust than distrust of most sources, the ratio is often much wider.
Among the Democrats’ sources with the largest margins between trust and distrust are PBS (56% trust vs. 4% distrust), NPR (46% vs. 2%), NBC (61% vs. 6%), CBS (59% vs. 6%), ABC (60% vs. 7%), BBC (48% vs. 5%), The New York Times (53% vs. 6%), The Washington Post (47% vs. 7%) and CNN (67% vs. 10%).
Within that group, both The Washington Post and The New York Times are among the outlets with the greatest distrust-to-trust ratio among Republicans. Also highly distrusted among Republicans are HuffPost (4% of Republicans trust and 34% distrust) and BuzzFeed at 3% trust to 29% distrust.
The much smaller group of sources distrusted by more Democrats than trusted includes Breitbart, Rush Limbaugh and the Sean Hannity radio show. Each of these is trusted by about 1% of Democrats and distrusted by about a third or more. One other outlet that fares poorly among Democrats is Fox News (23% trust to 61% distrust).
Amid this deep polarization, a few sources stand out across parties. PBS, the BBC and the Wall Street Journal are the three outlets trusted more than distrusted by both Republicans and Democrats.
At the other end of the spectrum, three outlets are distrusted by more in each party than trusted: the Washington Examiner, the New York Post, and BuzzFeed.
Trust, distrust, use and awareness of each news source by party and across all U.S. adults can be examined in the sortable tables below.
Share of Americans who have heard of each outlet, by party and ideology
% of U.S. adults who have heard of each source for political and election news
Outlet
All U.S. adults
Dem/ Lean Dem
Rep/ Lean Rep
Lib Dem/ Lean Dem
Conserv/Mod Dem/Lean Dem
Mod/Lib Rep/Lean Rep
Conserv Rep/Lean Rep
ABC News
93%
93%
93%
95%
92%
93%
93%
BBC
76%
76%
77%
87%
67%
75%
79%
Breitbart
39%
42%
39%
59%
28%
29%
46%
Business Insider
43%
48%
38%
59%
40%
38%
40%
BuzzFeed
63%
68%
60%
81%
57%
58%
62%
CBS News
91%
91%
93%
94%
88%
91%
93%
CNN
94%
95%
93%
97%
93%
93%
93%
Daily Caller
18%
15%
22%
22%
10%
13%
28%
Fox News
94%
92%
96%
94%
91%
95%
97%
HuffPost
63%
66%
63%
81%
55%
59%
66%
MSNBC
85%
86%
87%
91%
81%
85%
89%
NBC News
92%
93%
92%
95%
91%
92%
92%
New York Post
68%
69%
68%
79%
62%
63%
70%
Newsweek
74%
74%
76%
83%
67%
72%
79%
NPR
56%
59%
55%
76%
45%
49%
59%
PBS
84%
84%
85%
91%
79%
83%
86%
Politico
44%
49%
42%
66%
35%
33%
49%
Rush Limbaugh Show (radio)
56%
50%
66%
61%
42%
53%
74%
Sean Hannity Show (radio)
49%
44%
59%
56%
34%
45%
68%
Guardian
49%
55%
45%
71%
42%
42%
47%
Hill
32%
34%
31%
49%
23%
23%
36%
New York Times
83%
84%
84%
92%
78%
83%
85%
Wall Street Journal
79%
79%
82%
88%
73%
78%
84%
Time
82%
84%
82%
90%
79%
81%
83%
Univision
44%
51%
37%
58%
44%
35%
39%
USA Today
85%
85%
86%
90%
81%
85%
88%
Vice
35%
44%
26%
58%
33%
33%
21%
Vox
31%
40%
23%
56%
27%
25%
22%
Washington Examiner
34%
33%
37%
40%
27%
28%
43%
Washington Post
80%
80%
82%
88%
74%
79%
84%
Source: Survey of U.S. adults conducted Oct. 29-Nov. 11, 2019. “U.S. Media Polarization and the 2020 Election: A Nation Divided”
PEW RESEARCH CENTER
Share of Americans who got news from each outlet, by party and ideology
% of U.S. adults who have gotten political and election news from each source in the past week
Outlet
All U.S. adults
Dem/ Lean Dem
Rep/ Lean Rep
Lib Dem/ Lean Dem
Conserv/Mod Dem/Lean Dem
Mod/Lib Rep/Lean Rep
Conserv Rep/Lean Rep
ABC News
33%
37%
30%
32%
42%
36%
26%
BBC
16%
22%
10%
29%
16%
13%
8%
Breitbart
4%
0%
8%
0%
1%
3%
11%
Business Insider
4%
5%
3%
7%
4%
3%
3%
BuzzFeed
7%
9%
5%
12%
7%
5%
4%
CBS News
30%
33%
26%
30%
36%
29%
24%
CNN
39%
53%
24%
57%
50%
32%
19%
Daily Caller
2%
0%
3%
0%
1%
2%
5%
Fox News
39%
23%
60%
15%
29%
46%
68%
HuffPost
8%
12%
3%
18%
8%
3%
3%
MSNBC
24%
33%
14%
38%
30%
17%
12%
NBC News
34%
40%
28%
39%
40%
32%
25%
New York Post
5%
5%
5%
5%
5%
4%
6%
Newsweek
5%
7%
3%
8%
7%
4%
3%
NPR
20%
30%
11%
43%
20%
13%
9%
PBS
16%
22%
11%
27%
18%
12%
10%
Politico
9%
14%
5%
20%
9%
6%
5%
Rush Limbaugh Show (radio)
8%
1%
17%
0%
1%
6%
23%
Sean Hannity Show (radio)
9%
1%
19%
1%
1%
7%
27%
Guardian
6%
8%
3%
13%
4%
4%
3%
Hill
6%
8%
5%
11%
5%
4%
5%
New York Times
20%
31%
9%
42%
22%
12%
8%
Wall Street Journal
13%
15%
11%
17%
13%
11%
11%
Time
7%
10%
4%
11%
9%
5%
3%
Univision
5%
7%
3%
4%
9%
3%
2%
USA Today
11%
13%
10%
12%
14%
12%
8%
Vice
4%
6%
2%
9%
5%
3%
1%
Vox
4%
8%
1%
12%
4%
2%
1%
Washington Examiner
2%
2%
4%
1%
2%
3%
4%
Washington Post
17%
26%
8%
33%
20%
9%
8%
Source: Survey of U.S. adults conducted Oct. 29-Nov. 11, 2019. “U.S. Media Polarization and the 2020 Election: A Nation Divided”
PEW RESEARCH CENTER
Share of Americans who trust each outlet, by party and ideology
% of U.S. adults who trust each source for political and election news
Outlet
All U.S. adults
Dem/ Lean Dem
Rep/ Lean Rep
Lib Dem/ Lean Dem
Conserv/Mod Dem/Lean Dem
Mod/Lib Rep/Lean Rep
Conserv Rep/Lean Rep
ABC News
48%
60%
33%
57%
63%
47%
24%
BBC
35%
48%
21%
64%
36%
28%
17%
Breitbart
6%
1%
12%
1%
0%
4%
18%
Business Insider
9%
11%
6%
14%
9%
7%
6%
BuzzFeed
7%
10%
3%
13%
8%
5%
3%
CBS News
45%
59%
30%
57%
60%
42%
23%
CNN
47%
67%
23%
70%
65%
36%
16%
Daily Caller
2%
0%
4%
0%
1%
2%
5%
Fox News
43%
23%
65%
12%
32%
51%
75%
HuffPost
12%
20%
4%
27%
14%
6%
3%
MSNBC
34%
48%
18%
52%
45%
26%
13%
NBC News
47%
61%
30%
61%
61%
41%
23%
New York Post
10%
13%
7%
12%
15%
7%
7%
Newsweek
22%
31%
12%
33%
30%
16%
10%
NPR
31%
46%
16%
63%
33%
21%
13%
PBS
42%
56%
27%
66%
48%
35%
22%
Politico
13%
21%
6%
31%
13%
7%
5%
Rush Limbaugh Show (radio)
12%
1%
27%
0%
1%
10%
38%
Sean Hannity Show (radio)
14%
0%
30%
0%
1%
10%
43%
Guardian
11%
17%
5%
25%
10%
6%
4%
Hill
8%
10%
5%
15%
6%
4%
6%
New York Times
35%
53%
15%
66%
42%
23%
10%
Wall Street Journal
31%
38%
24%
44%
34%
27%
23%
Time
32%
46%
17%
52%
41%
24%
12%
Univision
9%
13%
3%
13%
13%
5%
3%
USA Today
28%
35%
21%
32%
38%
29%
16%
Vice
8%
12%
3%
17%
8%
5%
1%
Vox
6%
10%
1%
17%
5%
2%
0%
Washington Examiner
4%
4%
5%
4%
3%
3%
6%
Washington Post
30%
47%
13%
58%
38%
19%
9%
Source: Survey of U.S. adults conducted Oct. 29-Nov. 11, 2019. “U.S. Media Polarization and the 2020 Election: A Nation Divided”
PEW RESEARCH CENTER
Share of Americans who distrust each outlet, by party and ideology
% of U.S. adults who distrust each source for political and election news
Outlet
All U.S. adults
Dem/ Lean Dem
Rep/ Lean Rep
Lib Dem/ Lean Dem
Conserv/Mod Dem/Lean Dem
Mod/Lib Rep/Lean Rep
Conserv Rep/Lean Rep
ABC News
20%
7%
37%
5%
7%
22%
48%
BBC
10%
5%
16%
3%
6%
11%
19%
Breitbart
23%
36%
9%
53%
22%
12%
7%
Business Insider
5%
4%
5%
5%
3%
5%
6%
BuzzFeed
24%
21%
29%
24%
20%
29%
29%
CBS News
20%
6%
37%
5%
7%
21%
48%
CNN
32%
10%
58%
9%
11%
43%
67%
Daily Caller
7%
9%
5%
13%
4%
3%
6%
Fox News
40%
61%
19%
77%
48%
29%
12%
HuffPost
23%
14%
34%
15%
13%
30%
36%
MSNBC
26%
9%
47%
8%
9%
32%
57%
NBC News
21%
6%
40%
5%
7%
25%
50%
New York Post
23%
20%
28%
27%
14%
23%
32%
Newsweek
13%
5%
24%
5%
5%
14%
29%
NPR
10%
2%
19%
2%
2%
11%
25%
PBS
11%
4%
20%
2%
5%
12%
25%
Politico
8%
3%
14%
4%
3%
9%
17%
Rush Limbaugh Show (radio)
29%
43%
14%
55%
34%
21%
10%
Sean Hannity Show (radio)
24%
38%
10%
50%
28%
17%
7%
Guardian
8%
6%
11%
6%
5%
9%
12%
Hill
5%
4%
6%
5%
3%
5%
8%
New York Times
22%
6%
42%
5%
7%
28%
50%
Wall Street Journal
13%
7%
19%
9%
6%
16%
21%
Time
16%
6%
27%
4%
8%
19%
33%
Univision
8%
3%
13%
3%
4%
8%
16%
USA Today
16%
8%
26%
8%
9%
17%
32%
Vice
11%
10%
13%
11%
9%
14%
12%
Vox
8%
6%
11%
8%
5%
12%
11%
Washington Examiner
9%
9%
11%
13%
5%
8%
13%
Washington Post
21%
7%
39%
6%
7%
27%
47%
Source: Survey of U.S. adults conducted Oct. 29-Nov. 11, 2019. “U.S. Media Polarization and the 2020 Election: A Nation Divided”
PEW RESEARCH CENTER
2. Americans are divided by party in the sources they turn to for political news
To a large degree, the pattern of partisan polarization that emerges in attitudes about the credibility of news sources is also evident in the sources that Republicans and Democrats rely on for news about politics and the election.
Overall, Republicans (and independents who lean Republican) get political and election news from a smaller group of sources than Democrats, with an overwhelming reliance on one source – Fox News. Democrats (including independents who lean Democratic), on the other hand, use a wider range of sources.
Six-in-ten Republicans say they got news from the Fox News cable network in the past week. After Fox News, there is a huge gap before the next most turned-to sources – ABC News, NBC News and CBS News, all at similar levels (30%, 28%, and 26% respectively).
Despite Republicans’ deep distrust of CNN, it is among the more commonly used sources among Republicans, with 24% who got political news there in the past week. Next come the radio shows of Sean Hannity (19%) and Rush Limbaugh (17%). No other source tops 15% among Republicans.
On the Democratic side, CNN is turned to by the greatest portion, with 53% saying they got political news there in the past week. As is the case with Republicans, the three major commercial broadcast networks are the next most turned to sources of political news for Democrats, albeit in bigger doses — NBC (40%), ABC (37%) and CBS (33%).
One-third of Democrats also got news from cable channel MSNBC (33%) in the past week. A similar share got political news from The New York Times (31%) and NPR (30%). About a quarter got news from The Washington Post (26%) and Fox News (23%).
Amid these divides, there are some in each party who turn to the most relied-on sources of the other party: Roughly a quarter of Republicans (24%) got political news from CNN in the past week, which virtually matches the percentage of Democrats (23%) who say the same of Fox News. In other words, even amid the tendency of partisans to seek political news from different sources, there is still some overlap in what partisans see.
Partisan divides lead to one-sided audiences for many news outlets
The preference for news sources based on party identification and ideology affects the partisan makeup of the audience of each outlet, as shown below. Each source is placed on the line graph according to those who said they got political and election news there in the past week – taking into consideration both party identification (Republican or Democrat, including leaners) and ideology (conservative, moderate or liberal). (For more details see the methodology.)
For example, the average audience member of The New York Post sits very close to the party and ideology of the average U.S. adult. The average audience member of Breitbart, the Sean Hannity radio show and Rush Limbaugh’s radio program sit further to the right, as they tend to be more conservative and Republican. Fox News, even as it is turned to by large portions of conservatives Republicans, also has substantial numbers of more moderate Republicans and Democrats who get some news from it. Thus, Fox News sits closer to the middle than Breitbart and some others. It is worth noting that most of these outlets have an audience that falls at least slightly to the left of the average U.S. adult.
Americans’ use of a news outlet does not always mean they trust it
Even as Republicans and Democrats sort themselves into different news universes, there are a few sources that are used by large numbers on both sides.
A deeper analysis reveals, however, that getting political news from a source does not always mean one trusts it. Indeed, some people report getting news from sources they also say they distrust. This is particularly true among Republicans. For example, among the 24% of Republicans who said they got political and election news from CNN in the last week, about four-in-ten (39%) say they distrust CNN. Conversely, among the 53% of Democrats who use CNN, just 4% distrust it.
Similarly, for each of the three major commercial broadcast networks, about two-in-ten Republicans who got political news from these outlets in the past week also say they distrust that source (24% of Republicans who got news from NBC distrust it, 22% for CBS and 21% for ABC).
And while relatively small numbers of Republicans got news from MSNBC (14%), The New York Times (9%) and The Washington Post (8%) in the past week, of those who did, 45% distrust The Washington Post, 38% distrust The New York Times and 37% distrust MSNBC.
For Democrats, the data tells a different story. With one exception, few Democrats say they got news in the past week from sources they distrust. The exception is Fox News. Nearly one-quarter of Democrats (23%) got news there in the past week. And of those who did, 27% say they do not trust the cable channel as a source of information about the election and politics.
3. Ideology reveals largest gaps in trust occur between conservatives and liberals
The differences in trust and distrust of news outlets are often wider among the ideological wings of each party — conservative Republicans and liberal Democrats.
One way to see this is to look at the two cable channels that most clearly represent the polarized media universe. Among all Republicans and Republican leaners, CNN is trusted by 23% and Fox is trusted by 65%. Among conservative Republicans and Republican leaners, trust drops to 16% for CNN and climbs to 75% for Fox News.
The same phenomenon can be seen among Democrats and Democratic leaners. The trust level for Fox News among all Democrats is 23%, but it drops significantly to 12% among liberal Democrats. The percentage who trust CNN is roughly the same among all Democrats (67%) and among liberal Democrats (70%).
Overall then, the CNN “trust gap” between conservative Republicans (16%) and liberal Democrats (70%) is fully 54 percentage points. And the gap in trust of Fox News is even larger at 63 points (trusted by 75% of conservative Republicans and 12% of liberal Democrats).
Conservative Republicans and liberal Democrats also look even more dimly at sources that are already widely distrusted by Republicans and Democrats in general. For example, the Sean Hannity radio show is distrusted by 38% of Democrats and Rush Limbaugh is distrusted by 43%. Among liberal Democrats, distrust rises to 50% and 55%, respectively.
Similarly, MSNBC is distrusted by 47% of Republicans overall but by 57% of conservative Republicans. The New York Times is distrusted by 42% of all Republicans, yet by half of all conservative Republicans (50%).
These differences can be examined from the other direction as well. While Sean Hannity is trusted by 30% of all Republicans, he is trusted by 43% of conservative Republicans. The same is true for Limbaugh, whose trust level rises from 27% among all Republicans to 38% among conservatives.
On the other side of the aisle, The New York Times is trusted by 53% of all Democrats. But among liberal Democrats, that number jumps to 66%.
Some of these views about media credibility also are reflected in how often sources are used. Among all Republicans, 19% say they got political and election news from the Sean Hannity radio show in the past week. But about a quarter of conservative Republicans (27%) did so.
About one-third of all Democrats (31%) received political news from The New York Times in the past week. Liberal Democrats were even more faithful consumers, with 42% saying they got news from the Times in the past week.
Within both partisan groups there are ideological differences in views and use of news sources – these are particularly pronounced among Republicans. For example, there are 20 sources more conservative Republicans distrust than trust. That number falls to 15 sources among moderate and liberal Republicans. And though only four sources are trusted more than distrusted by conservative Republicans, there are 10 that moderate and liberal Republicans trust more than distrust.
In evaluating the credibility of the three major commercial broadcast networks, moderate and liberal Republicans are far more likely to trust ABC, CBS and NBC News than conservative Republicans.
For Fox News specifically, support softens among moderate and liberal Republicans. Three-quarters of conservative Republicans (75%) trust it; only 12% distrust it. Among moderate and liberal Republicans, about half (51%) say they trust Fox News and 29% distrust it.
There are also some distinctions within parties about the use of sources for political and election news. Fox News is easily the most turned to source for all Republicans, but while about two-thirds of all conservative Republicans (68%) got political news there in the past week, only about half of moderate and liberal Republicans (46%) did. And, while about a quarter of conservative Republicans got political news last week from the Sean Hannity radio show (27%) and Rush Limbaugh (23%), those numbers plunge to 7% and 6%, respectively, for moderate and liberal Republicans.
The differences between conservative and moderate Democrats and liberal Democrats aren’t as pronounced as those on the Republican side, but there are some. For example, while 55% of liberal Democrats distrust Rush Limbaugh, that number drops to 34% among conservative and moderate Democrats. The same is true for Sean Hannity, where the level of distrust drops from 50% among liberal Democrats to 28% for conservative and moderate Democrats.
There are other distinctions within the Democratic party when it comes to getting political and election news. For example, 42% of liberal Democrats got political news from The New York Times in the past week compared with 22% of conservative and moderate Democrats. A similar pattern is seen with The Washington Post, where one-third of liberal Democrats (33%) got political news last week compared with 20% of conservatives and moderates. Finally, while only 15% of liberal Democrats say they got news from Fox News in the past week, about twice as many moderate and conservative Democrats (29%) say they did so.
4. In recent years, partisan media divides have grown, largely driven by Republican distrust
In 2014, Pew Research Center conducted its foundational “Political Polarization & Media Habits” report. That study – which was conducted among web-using adults only – revealed that political polarization had bled into Americans’ news preferences. The new 2019 data suggests that, the chasm has widened in the five years since. Although there are a few methodological differences between the two studies, the central questions regarding trust and distrust have been repeated for 20 news outlets, allowing us to make a rough comparison over time (a fuller discussion of the two studies can be found in the methodology.)
Most of the movement over these five years has come from Republicans and Republican- leaning independents increasing their distrust of many of the more traditional outlets tied to legacy platforms like network TV and print newspapers. There has been far less movement among Democrats and Democratic-leaning independents, and those smaller changes are largely expressed as greater trust in a few outlets.
Of the 20 sources asked about in both the 2014 and 2019 studies, distrust among Republicans increased for 15. Among those that have seen the largest erosion are thoseoftendecried by President Trump. Take for example CNN, where distrust has increased among Republicans from 33% in 2014 to 58% today. The percentage of Republicans who distrusted The Washington Post in 2014 was 22%; now it is 39%. There was a similar shift with The New York Times, where distrust jumped from 29% to 42% in the past five years.
Republican distrust in The Wall Street Journal increased from 11% to 19% in that span and distrust of USA Today grew from 16% to 26%. CBS and ABC have also seen Republican distrust increase by 10 percentage points and 9 percentage points, respectively.
Among Democrats, levels of distrust and trust remained remarkably stable from 2014 to 2019. One exception is the Sean Hannity radio show, where distrust among Democrats increased moderately, from 32% to 38%. The percentage of Democrats who distrust Breitbart News also increased, from 7% to 36% in that period, accompanied by a rising familiarity with the conservative news outlet. In 2014, only 10% of Democrats were aware of Breitbart, compared to 42% now. Only two outlets experienced an increase in trust among Democrats: The Washington Post (37% in 2014 and 47% in 2019) and Politico (1o% to 21%).
A recent Pew Research Center study sheds light on what may be at least partly behind the growing distrust on the right. In that study, researchers examined questions from more than 50 different surveys to determine what factors connect with higher or lower trust in the news media writ large. It revealed that in the Trump era, under a president who has frequently criticized much of the traditional news industry, no factor comes close to matching the impact of political party identification on trust in the news media overall. What’s more, within the Republican Party, approval of Donald Trump aligns with much greater animosity toward news organizations and journalists.
Appendix: Detailed tables
Acknowledgments
This report was made possible by The Pew Charitable Trusts. Pew Research Center is a subsidiary of The Pew Charitable Trusts, its primary funder. This report is a collaborative effort based on the input and analysis of the following individuals. Find related reports online at www.pewresearch.org/pewresearch-org/journalism.
Amy Mitchell, Director, Journalism Research
Mark Jurkowitz, Senior Writer
Elisa Shearer, Research Associate
Mason Walker, Research Assistant
Michael Barthel, Senior Researcher
Baxter Oliphant, Senior Researcher
Galen Stocking, Computational Social Scientist
Katerina Eva Matsa, Associate Director, Journalism Research
Maya Khuzam, Research Assistant
Kirsten Worden, Research Assistant
Margaret Porteus, Information Graphics Designer
Alec Tyson, Senior Researcher
Andrew Mercer, Senior Research Methodologist
Dorene Asare Marfo, Survey Research Methodologist
Scott Keeter, Senior Survey Advisor
Claudia Deane, Vice President, Research
Rachel Weisel, Senior Communications Manager
Hannah Klein, Communications Manager
Calvin Jordan, Communications Associate
Shannon Greenwood, Copy EditorSara Atske, Associate Digital Producer
Methodology
American Trends Panel survey methodology
The American Trends Panel (ATP), created by Pew Research Center, is a nationally representative panel of randomly selected U.S. adults. Panelists participate via self-administered web surveys. Panelists who do not have internet access at home are provided a tablet and wireless internet connection. The panel is being managed by Ipsos.
Data in the Election News Pathways project and the U.S. Media Polarization and the 2020 Election report are drawn from the panel wave conducted Oct. 29-Nov. 11, 2019. A total of 12,043 panelists responded out of 14,412 who were sampled, for a response rate of 84%. This does not include 12 panelists who were removed from the data due to extremely high rates of refusal or straightlining. The cumulative response rate accounting for nonresponse to the recruitment surveys and attrition is 4.5%. The break-off rate among panelists who logged onto the survey and completed at least one item is 0.2%. The margin of sampling error for the full sample of 12,043 respondents is plus or minus 1.43 percentage points.
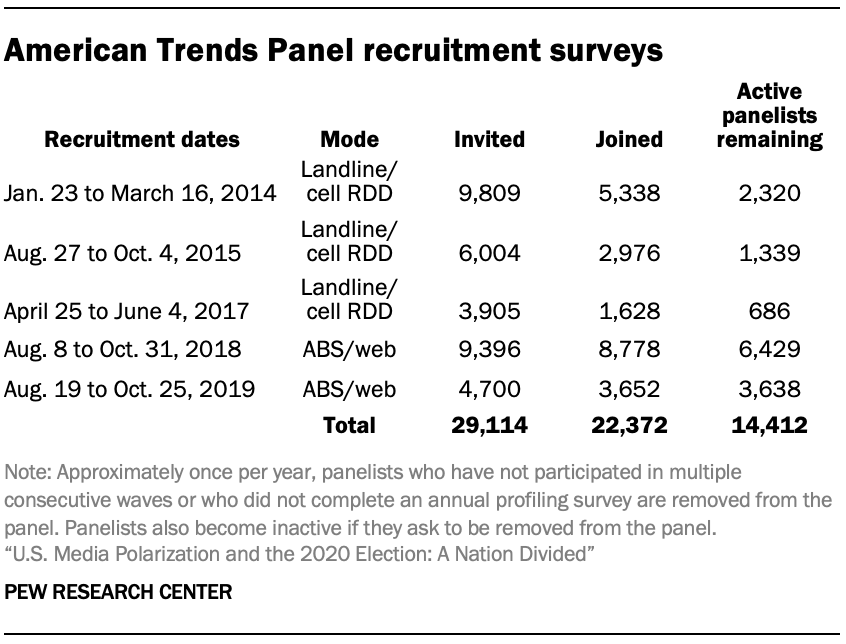
The ATP was created in 2014, with the first cohort of panelists invited to join the panel at the end of a large national, landline and cellphone random-digit-dial survey that was conducted in both English and Spanish. Two additional recruitments were conducted using the same method in 2015 and 2017, respectively. Across these three surveys, a total of 19,718 adults were invited to join the ATP, of which 9,942 agreed to participate.
In August 2018, the ATP switched from telephone to address-based recruitment. Invitations were sent to a random, address-based sample (ABS) of households selected from the U.S. Postal Service’s Delivery Sequence File. In each household, the adult with the next birthday was asked to go online to complete a survey, at the end of which they were invited to join the panel. For a random half-sample of invitations, households without internet access were instructed to return a postcard. These households were contacted by telephone and sent a tablet if they agreed to participate. A total of 9,396 were invited to join the panel, and 8,778 agreed to join the panel and completed an initial profile survey. The same recruitment procedure was carried out on Aug. 19, 2019, from which a total of 4,700 were invited to join the panel and 3,652 agreed as of Oct. 25, 2019. Of the 22,372 individuals who have ever joined the ATP, 14,412 remained active panelists and continued to receive survey invitations at the time this survey was conducted.
The U.S. Postal Service’s Delivery Sequence File has been estimated to cover as much as 98% of the population, although some studies suggest that the coverage could be in the low 90% range3
Weighting
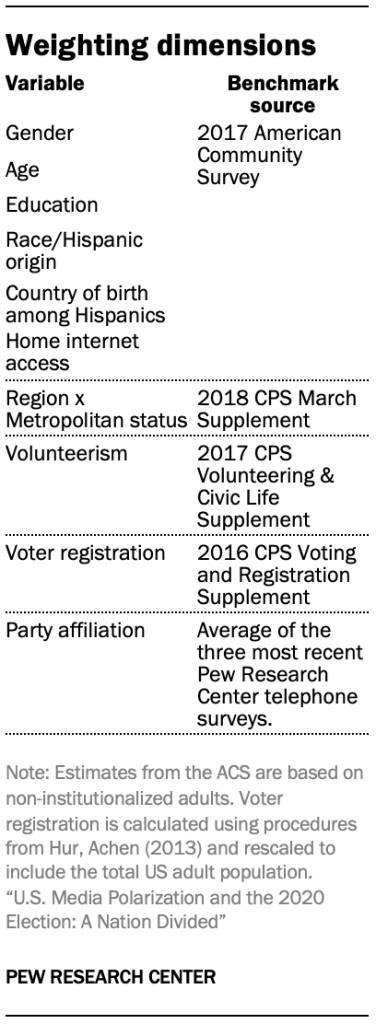
The ATP data were weighted in a multistep process that begins with a base weight incorporating the respondents’ original selection probability. The next step in the weighting uses an iterative technique that aligns the sample to population benchmarks on the dimensions listed in the accompanying table.
Sampling errors and test of statistical significance take into account the effect of weighting. Interviews are conducted in both English and Spanish.
In addition to sampling error, one should bear in mind that question wording and practical difficulties in conducting surveys can introduce error or bias into the findings of opinion polls.
The following table shows the unweighted sample sizes and the error attributable to sampling that would be expected at the 95% level of confidence for different groups in the survey:
Sample sizes and sampling errors for other subgroups are available upon request.
The 30 sources included in the Election News Pathways project were chosen so that respondents were asked about a range of news media across different platforms (e.g., television, print, radio, internet). Researchers also considered audience size, topic areas covered and relevance to political news during the 2016 election and afterwards.
The final list of 30 news outlets asked about consists of the following: four of the major broadcast television networks (ABC News, CBS News, NBC News and Univision), three major cable television news networks (CNN, Fox News and MSNBC), four of the largest newspapers by national circulation (The New York Times, The Washington Post, The Wall Street Journal and USA Today), the two major public broadcast networks (NPR and PBS), two political news radio programs with large audiences (The Rush Limbaugh Show and The Sean Hannity Show), two international media organizations with large domestic audiences (BBC and The Guardian), news websites regardless of their original platform that cover politics and had comparatively high traffic during the fourth quarter of 2018 (BuzzFeed, Vice, New York Post, Time magazine, Newsweek, Politico and Vox), one business-focused outlet with political content and higher web traffic in the time period analyzed than other similar outlets (Business Insider), and other outlets included in external lists of key political sources during the 2016 presidential election and after, selected with traffic and social media engagement figures in mind (Breitbart, The Hill, Daily Caller, HuffPost and The Washington Examiner).4 News sources that mostly serve as aggregators of news (e.g., Google News) and social media outlets were asked about in a separate question.
Main source of political and election news
In addition to the series of questions about these specific outlets, respondents were also asked in an open-ended question to volunteer their main source for news. This allowed respondents to name any source, not limiting them to the specific ones asked about in the survey questions. If respondents volunteered more than one source, the first one mentioned was accepted.
Researchers grouped these open-ended responses together by brand; for instance “NY Times,” “NYT” and “nytimes.com” would all be counted as indicating that The New York Times was the respondent’s main source. Additionally, individual local news sources were grouped together into categories such as “local newspapers” and “local TV.”
All outlets that were named by 1.0% or more respondents as their main source for news are reported in the topline. All other sources named are grouped into “Other”.
Awareness, trust, distrust and use of news sources
In this study, respondents were asked about their awareness of and trust in 30 different news sources. Respondents were first asked whether they have heard of each source. Icons for and names of the sources were arrayed on two screens of 15 sources each.5 The order of the sources on each screen and the order of the two screens were randomized. Respondents were then shown a grid of just the sources that they had heard of and asked to click on the ones they trust for political and election news. They then saw a grid that showed the sources they had heard of but had not indicated that they trust and were asked if they distrust the remaining sources. If a respondent had heard of a source but did not indicate trust or distrust of it, the response was considered “neither trust nor distrust.” Finally, respondents were asked if they got political or election news in the past week from any of the sources that they heard of.
Average audience placement of each outlet based on party and ideology
One section of the report shows the average audience placement of each of the 30 news outlets in a number line based on an index of self-reported party identification and political ideology. Each respondent was assigned a value on a nine-point index based on their responses to questions about their party identification and political ideology. The placement of each outlet’s audience is based on the average value of those who reported getting political and election news from the outlet in the past week. The number values in the index are:
1 = Very conservative Republican/Lean Republican
2 = Conservative Republican/Lean Republican
3 = Moderate Republican/Lean Republican
4 = Liberal or very liberal Republican/Lean Republican
5 = No lean/Other response
6 = Conservative or very conservative Democrat/Lean Democrat
7 = Moderate Democrat/Lean Democrat
8 = Liberal Democrat/Lean Democrat
9 = Very liberal Democrat/Lean Democrat
Outlet groupings by audience makeup
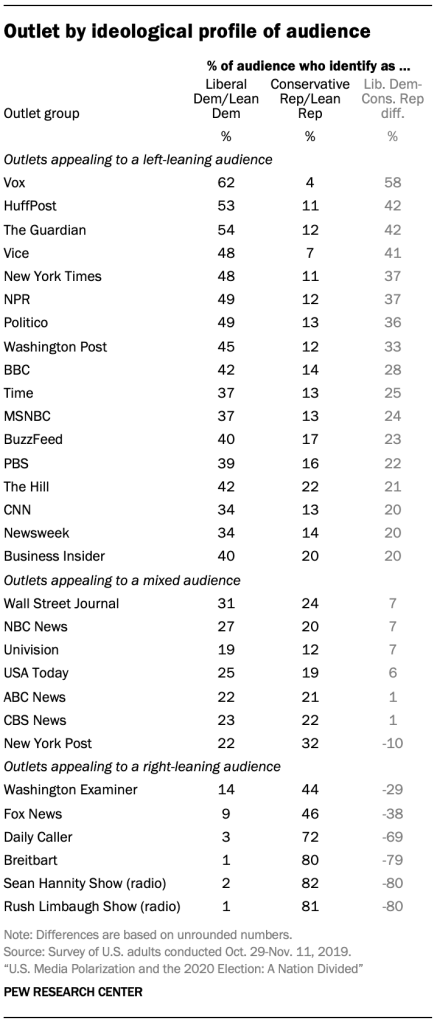
Each outlet was grouped according to the ideological composition of its audience. This grouping is based on the ratio of the proportion of the audience who self-identify as liberal Democrats (including independents who lean Democratic) to the proportion that identify as conservative Republicans (including independents who lean Republican).
The survey asked respondents to indicate whether they got “political and election news” from 30 national news outlets in the past week. An outlet is considered to have a left-leaning audience if the proportion of those who got news there that identify as liberal Democrats is at least two-thirds higher than the proportion that identify as conservative Republicans. Alternatively, an outlet is considered to have a right-leaning audience if the proportion of all audience members that identify as conservative Republicans is at least two-thirds higher than the proportion that identify as liberal Democrats. And an outlet is classified as having a mixed audience if neither liberal Democrats nor conservative Republicans make up at least two-thirds or more of the audience than the other.
Data for classifying the ideological composition of news outlets comes from the first survey of Pew Research Center’s Election News Pathways project, conducted Oct. 29-Nov. 11, 2019, among 12,043 U.S. adults.