For Local News, Americans Embrace Digital but Still Want Strong Community Connection
71% of U.S. adults think their local news media are doing well financially; 14% have directly paid a local news source
About Pew Research Center
Pew Research Center is a nonpartisan, nonadvocacy fact tank that informs the public about the issues, attitudes and trends shaping the world. It does not take policy positions. The Center conducts public opinion polling, demographic research, computational social science research and other data-driven research. It studies politics and policy; news habits and media; the internet and technology; religion; race and ethnicity; international affairs; social, demographic and economic trends; science; research methodology and data science; and immigration and migration. Pew Research Center is a subsidiary of The Pew Charitable Trusts, its primary funder.
For Local News, Americans Embrace Digital but Still Want Strong Community Connection
71% of U.S. adults think their local news media are doing well financially; 14% have directly paid a local news source
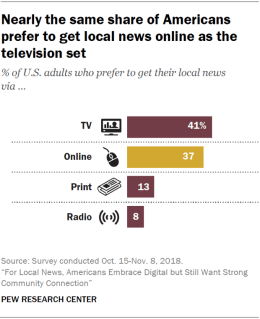
The digital era is making its mark on local news. Nearly as many Americans today say they prefer to get their local news online as say they prefer to do so through the television set, according to a new Pew Research Center survey of 34,897 U.S. adults conducted Oct. 15-Nov. 8, 2018, on the Center’s American Trends Panel and Ipsos’s KnowledgePanel. The 41% of Americans who say they prefer getting their local news via TV and the 37% who prefer it online far outpace those who prefer a printed newspaper or the radio (13% and 8%, respectively).
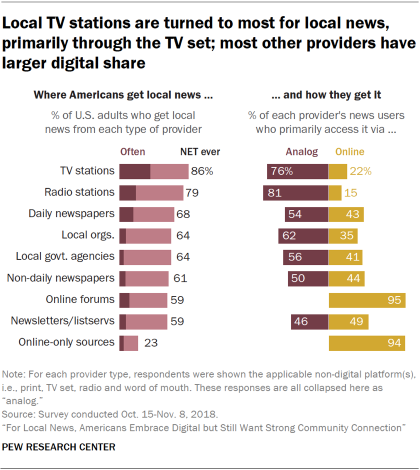
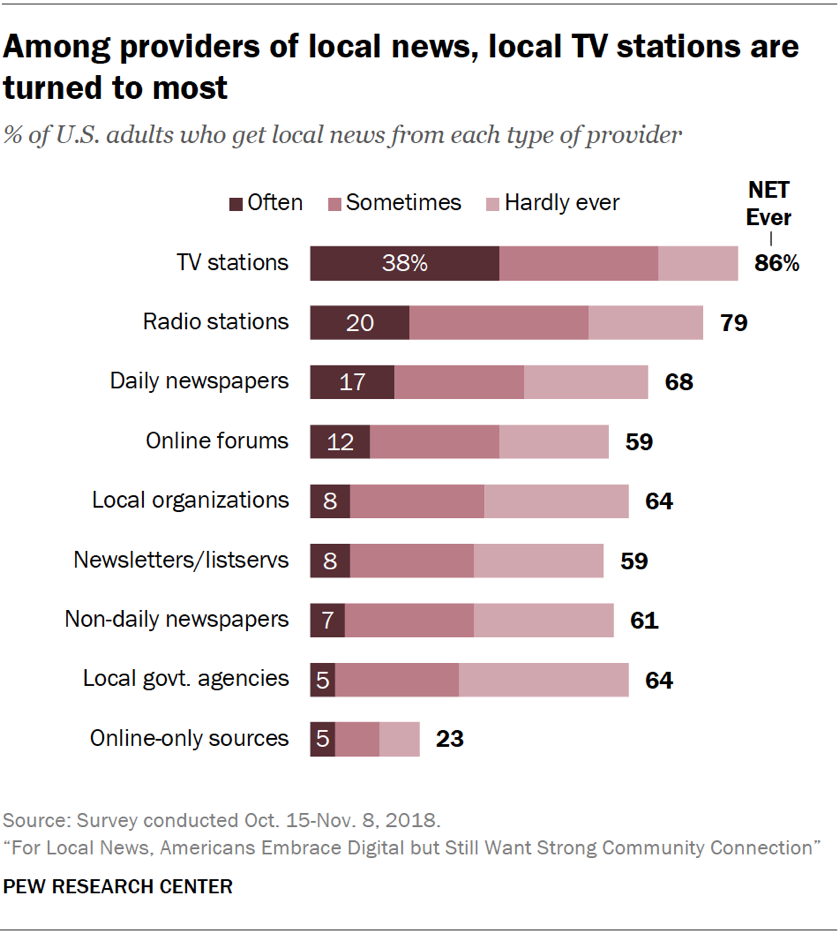
Even as the preference for digital delivery creeps up on that for news via TV, local television stations retain a strong hold in the local news ecosystem. They top the list of nine types of local news providers, with 38% of U.S. adults saying they often get news from a local television station. That is followed by 20% who often turn to local radio stations and 17% who rely on local daily newspapers. Next come a range of less traditional sources such as online forums or discussion groups (12%), local organizations such as school groups or churches (8%), and community newsletters or listservs (8%). While individually these less traditional sources garner far smaller audiences than the big three (local TV, daily papers and radio stations), together they add up: 28% of the public often gets news from at least one of the six less traditional providers asked about.
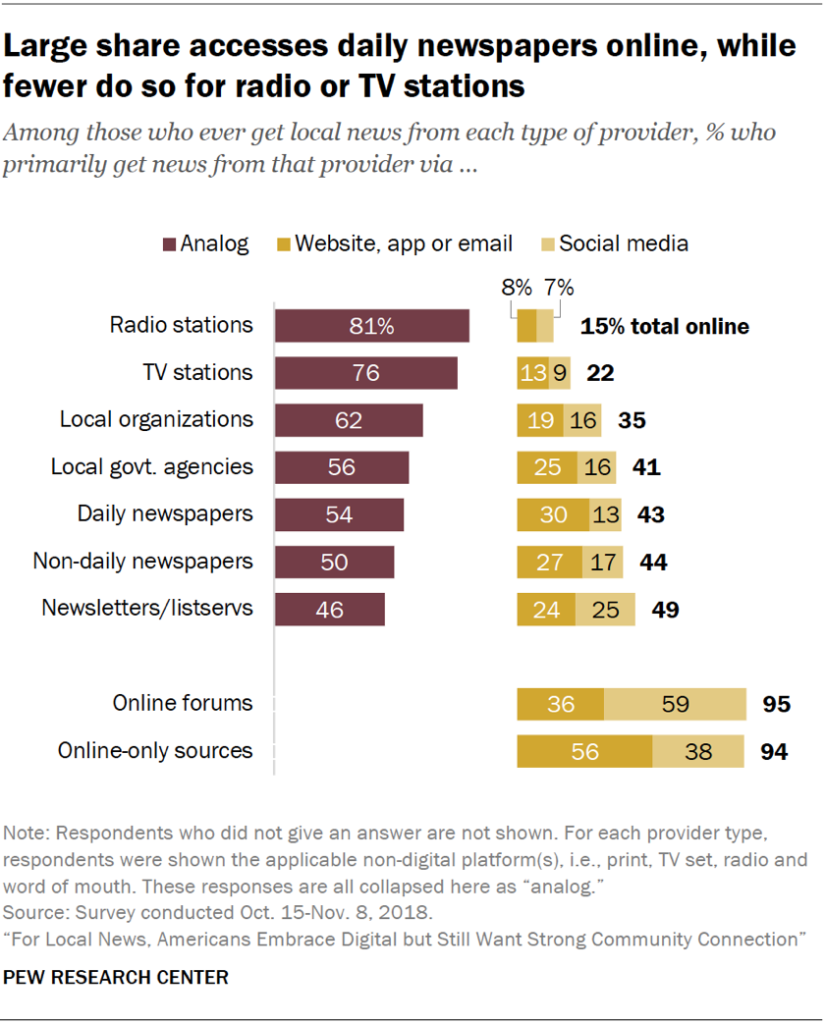
The degree to which the public accesses each type of provider digitally versus non-digitally varies a great deal. To start, the vast majority of Americans who get news from local TV stations primarily do so the old-fashioned way: from the television set (76%), not from the stations’ websites or social media accounts (22%). Radio is similarly tied to its traditional form. But most other providers have a substantial share of their audience accessing them online. For example, 43% of daily newspaper consumers tend to get that news digitally, as do 49% of those who rely on community newsletters or listservs.
This nationally representative study also reveals that many Americans are not getting local news that is mostly about their own area – a concern raised by many journalism watchers following newsroom cutbacks and media consolidation. About half of U.S. adults (47%) say the local news they get mostly covers an area other than where they live such as a nearby city, while the rest (51%) say it mostly covers their living area.
Local news consumers prize community connection
Overall, Americans evaluate their local media fairly positively. Majorities approve of the job their local news providers are doing across seven core job functions, such as covering news thoroughly. And 30% of Americans are very confident that their main news source can get them the information they need, with another 52% saying they are somewhat confident.
But the public also has high expectations for their area news providers when it comes to their capacity to be a genuine part of the community. An overwhelming majority of adults say it is at least somewhat important for journalists to understand their community’s history (85%) and to be personally engaged with their local area (81%), and at least four-in-ten deem each very important.
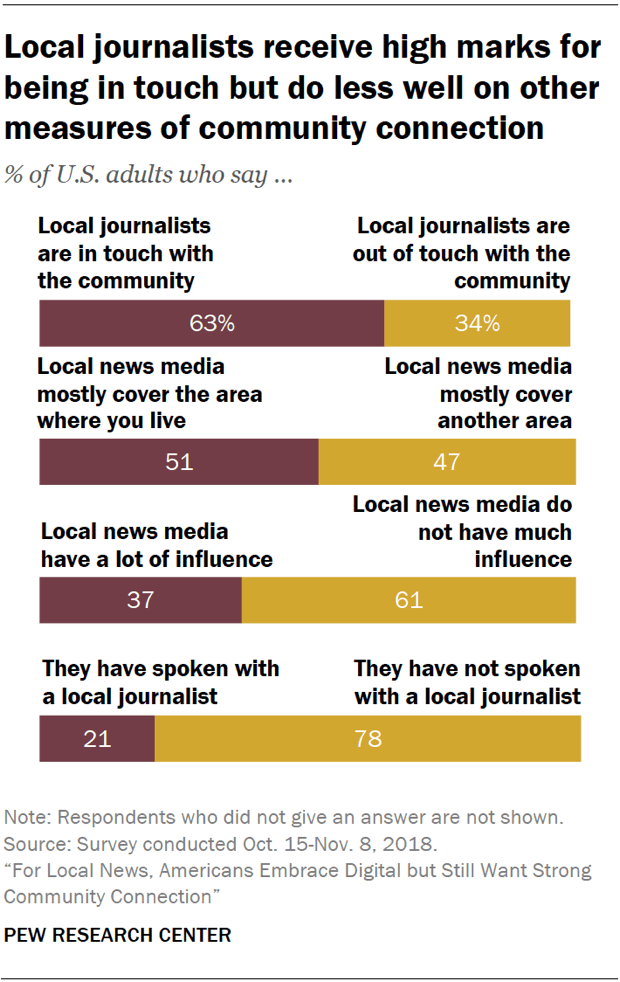
Less consensus exists, however, on whether the local news media clear this bar. On the positive side, most Americans (63%) say their local journalists are generally in touch with the community, but about a third (34%) say they are out of touch. At the same time, a minority (37%) says the local media have a lot of influence in the community, and just 21% have ever personally spoken with a local journalist.
The next question is: Does it matter? To what degree does that sense of community connection relate to job approval? Quite a bit, it turns out.
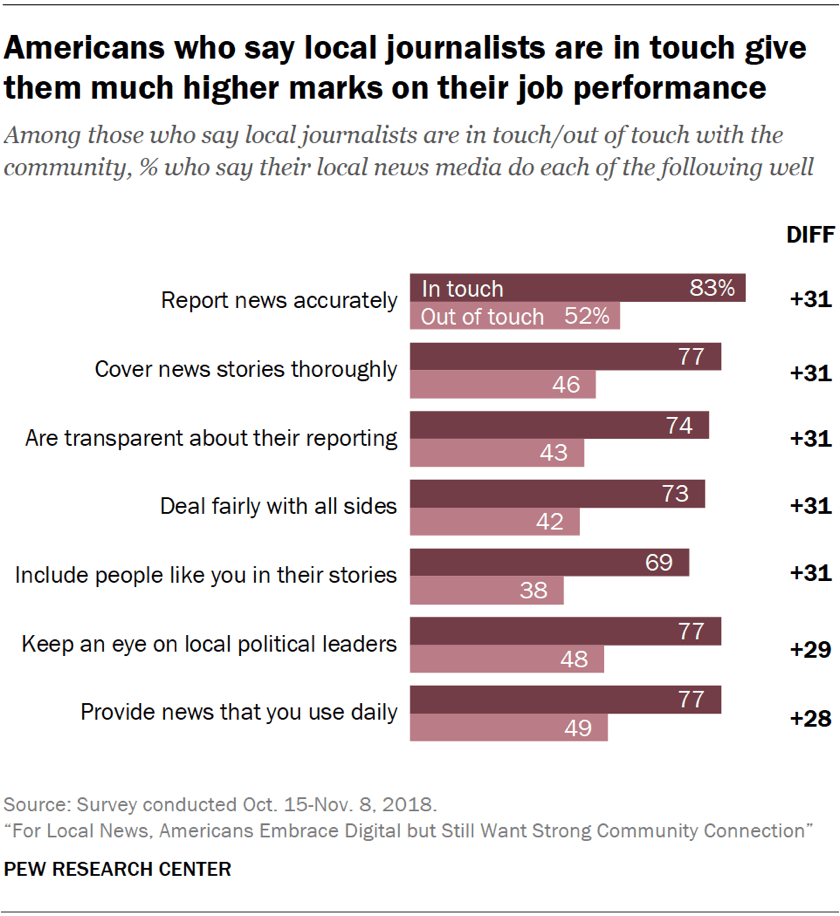
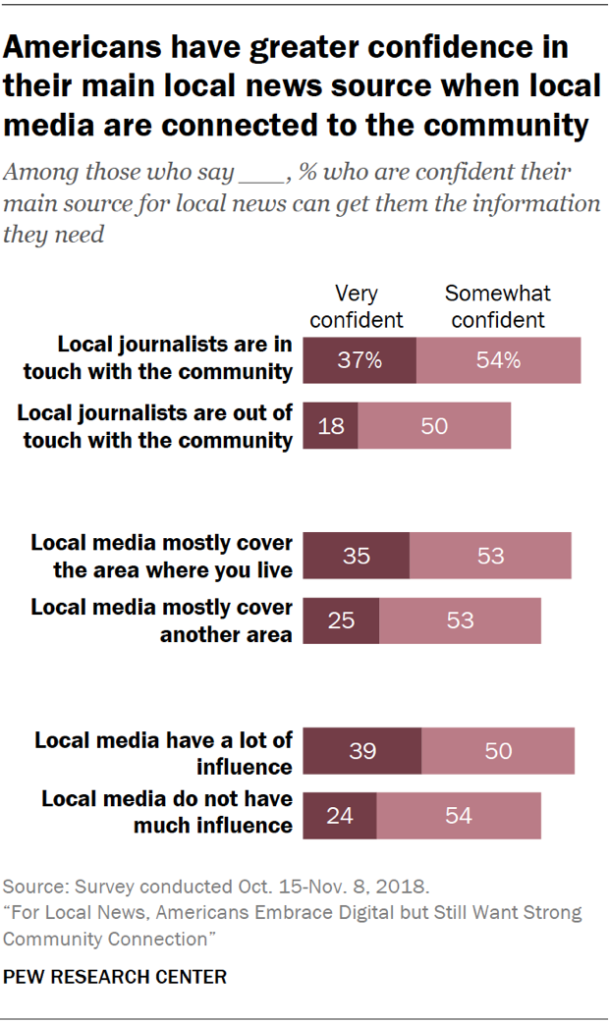
Community residents who see their local journalists as connected to the area give their local news media far higher ratings than those who do not. For example, those who say journalists are in touch with their community are 31 percentage points more likely to say their local media do a good job of dealing fairly with all sides – 73%, compared with 42% among those who say their media are out of touch. Similarly, 35% of those whose local media cover the area where they live say they are very confident in their main local news source, compared with 25% of those whose local media cover a different geographic area.
Americans have little awareness of the financial challenges facing the industry
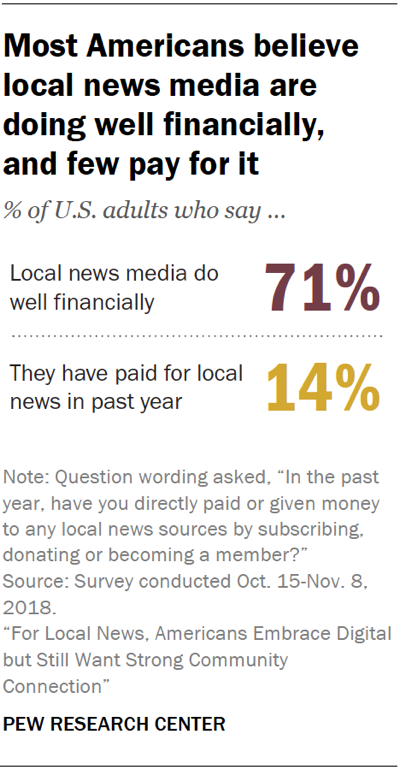
The study also highlights a widespread lack of awareness about the revenue challenges facing many local news media operations. Even amid declining revenues and staffing, about seven-in-ten Americans think their local news outlets are doing very or somewhat well financially (71%).
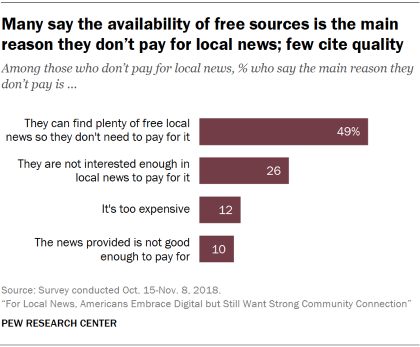
When it comes to their own financial support of the industry, just 14% of American adults say they have paid for local news in the past year, either through subscription, donation or membership. When those who don’t pay were asked why, the widespread availability of free content tops the list (49%). Only 10%, on the other hand, said concerns about quality of coverage was the top reason for not paying.
Wide range of local news interests, but most can’t live without the weather forecast
Perhaps the most basic function of local journalism is to provide residents with news across a range of topics in a way that helps them live their daily lives and take part in the community. The choice of what topics to cover when and to what degree can be daunting, particularly amid the industry’s ongoing financial struggles. The findings show that Americans have a wide range of topical interests, but most see only a handful of topics as important to their daily lives.
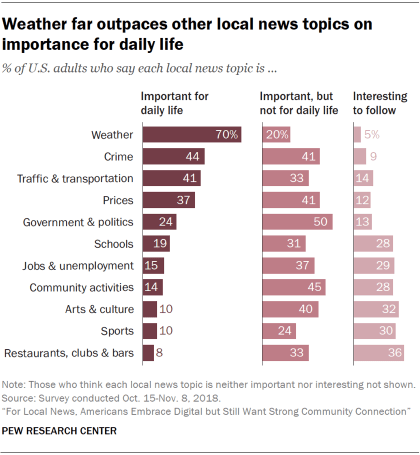
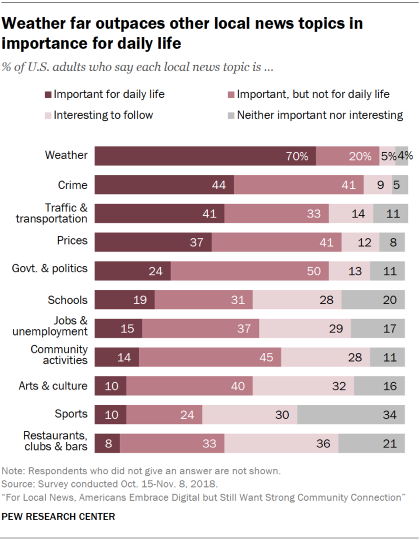
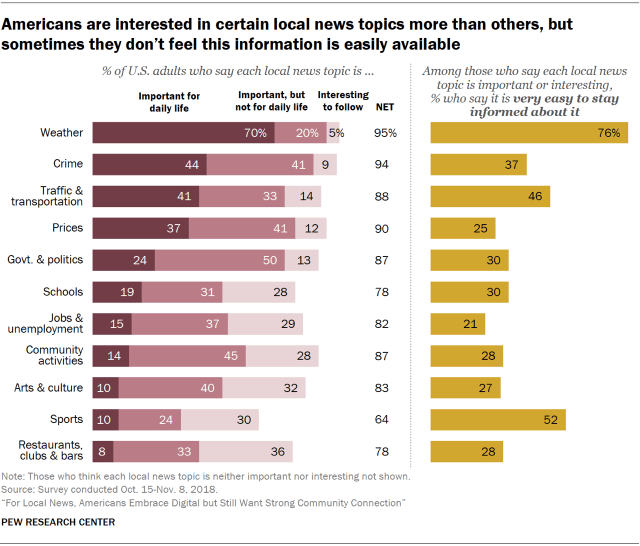
Weather, not surprisingly, sits at the top of the list of topics seen as important for day-to-day life, with 70% expressing a daily need for information. That’s followed by crime (44%), traffic (41%) and news about changing prices (37%). Sports, on the other hand, has the largest segment (34%) who find it neither important nor interesting.
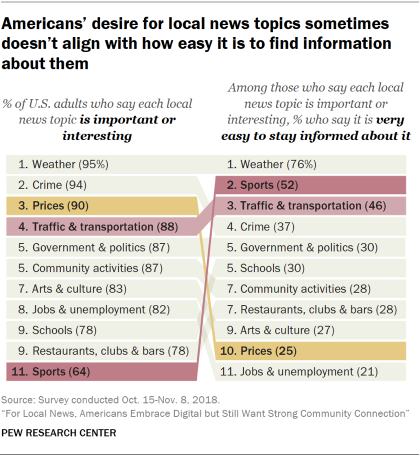
There is some mismatch between the information news consumers want and the level of ease they have in finding it. News about changing prices, for example, ranks third in the portion of people who find it either important or interesting. But among those who find it at least interesting, it ranks 10th in being very easy to stay informed about. Sports is the opposite. It ranks higher in ease of access than in importance or interest. Traffic and transportation news, on the other hand, ranks about equally in both measures.
Community traits such as age and ethnic diversity lead to some differences in local news habits and attitudes
Understanding the local news landscape is complex, as local areas differ in innumerable ways. Some are wealthier, while others contain more families struggling to meet their basic needs. They differ in the racial and ethnic makeup of their residents and the share of locals who are older and retired versus just starting out in life.
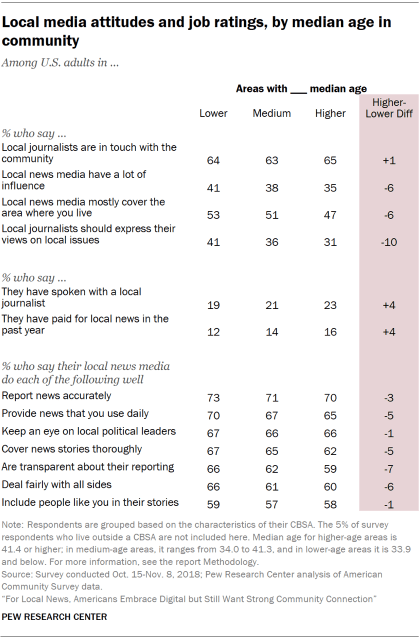
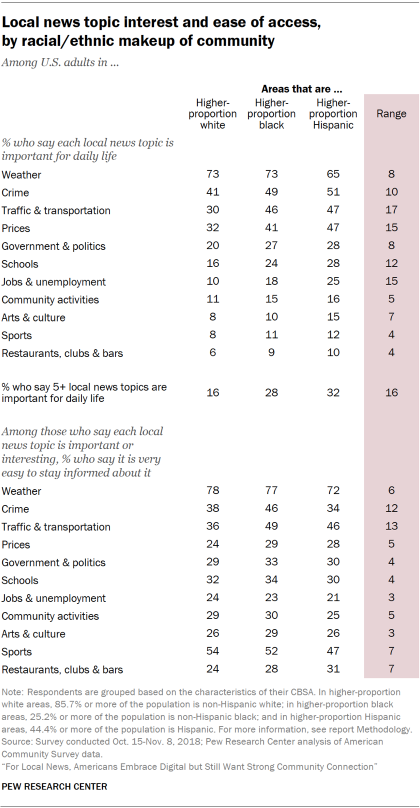
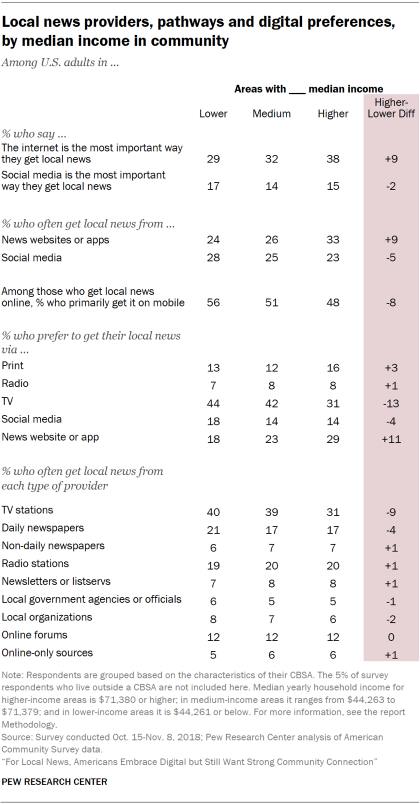
This study, powered by an unusually large survey sample, finds that experiences with and views about local news vary based on these community characteristics. For example, residents of lower-income areas are more reliant on TV news and less so on digital pathways – though when they do get news digitally they are more likely than those in higher-income areas to use mobile devices. Additionally, individuals living in areas with a higher proportion of blacks or Hispanics are more likely to say daily information on jobs and unemployment is important for their daily life (18% in higher-proportion black areas and 25% in higher-proportion Hispanic areas, compared with 10% in higher-proportion white areas). Finally, individuals living in areas with a younger population are more willing to have journalists express their views on current local issues than those in older-aged areas (41% vs. 31%) – a sentiment also shared by 48% of people in areas with a higher concentration of Hispanics.
Explore detailed profiles of local news attitudes and behaviors across the U.S.
This study goes even one level deeper, drilling down to the individual local level via a free online, interactive tool. The interactive allows members of the public to search for, examine and download findings about the local news environments of 99 distinct areas across the United States. These areas, defined by the U.S. federal government as core-based statistical areas (or CBSAs), can roughly be described as an urban center and its adjacent counties such as San Antonio-New Braunfels, TX and Minneapolis-St. Paul-Bloomington, MN-WI.1 Four that are highlighted in the report, including the two named here, stand out from U.S. adults overall in their local news habits and attitudes. Residents of the San Antonio area, for example, are more likely than U.S. adults overall to feel the local media are connected to their community, specifically when it comes to the amount of influence they have and whether they cover the area in which respondents live.
Among some of the additional findings from this study:
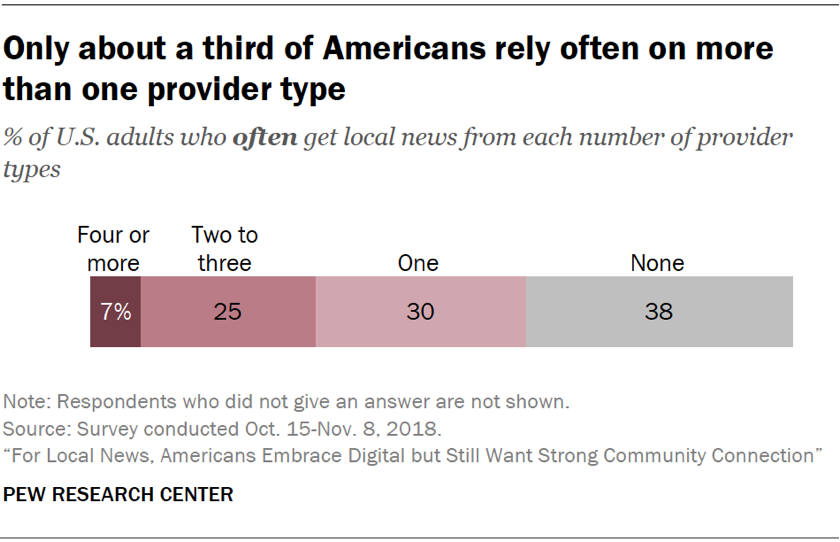
Most Americans (73%) follow local news at least somewhat closely, but still, about a quarter of U.S. adults (26%) follow local news either not very closely or not at all. Additionally, about four-in-ten (38%) don’t have any type of news provider they rely on regularly for local news, while another 30% rely regularly on just one.
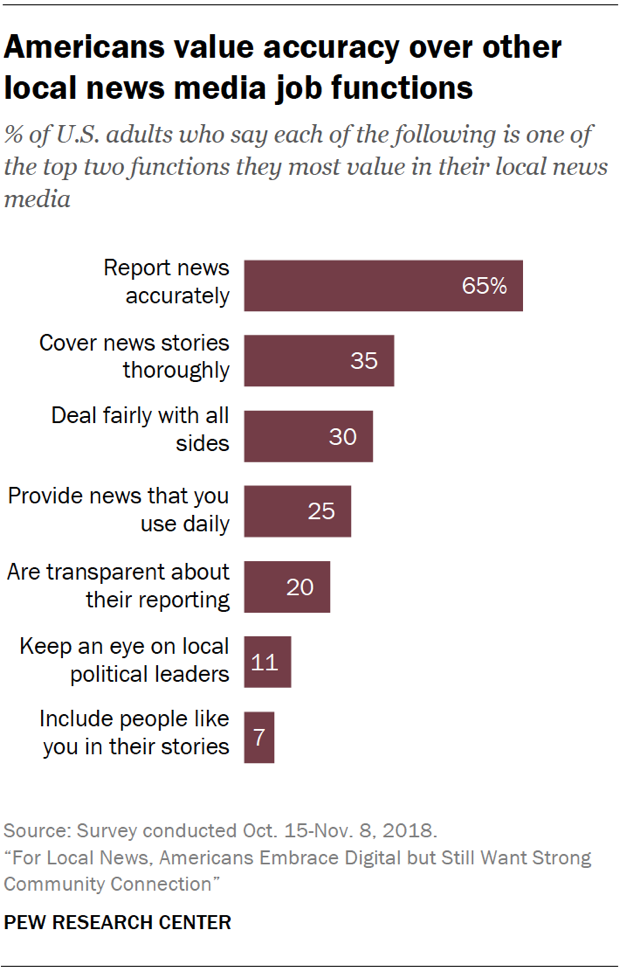
Across seven core job functions of local news media, the public clearly places top priority on accuracy. Fully 65% name this as the most or second-most important function. Next, though at much lower rates, come covering stories thoroughly (35%) and dealing fairly with all sides (30%).
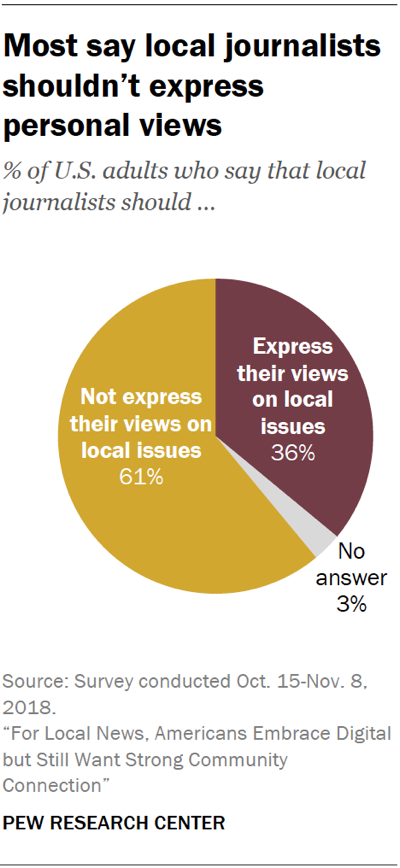
A majority of Americans say local journalists should not share their views about local issues: 61%, compared with 36% who say they should.
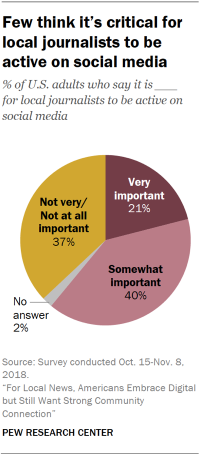
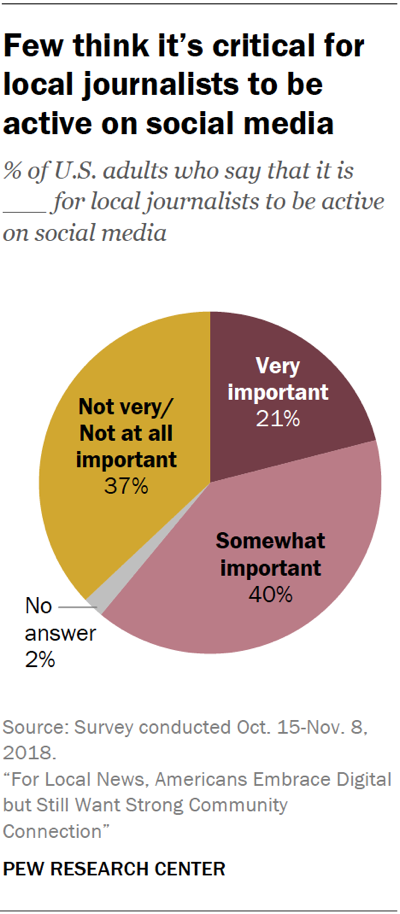
About one-in-five U.S. adults (21%) say it is very important for local journalists to be active on sites like Twitter and Facebook, while 40% say it is somewhat important. Roughly four-in-ten (37%) say this is not very or not at all important.
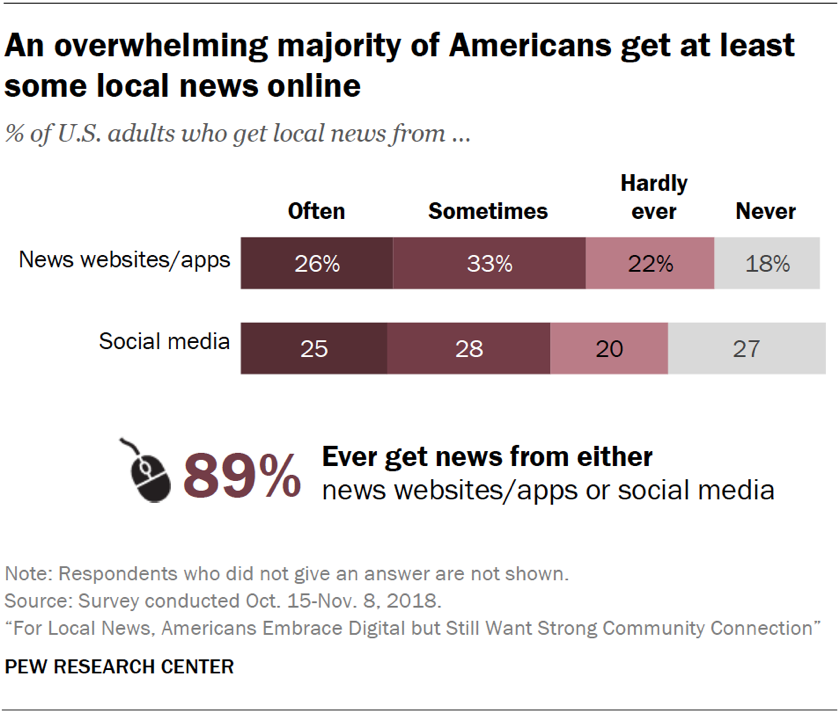
Overall, nearly nine-in-ten Americans (89%) currently get at least some local news digitally (through news websites, apps or social media) and 41% do so often. Looking separately at websites and apps compared with social media, roughly equal portions often get news from each (26% and 25%, respectively).
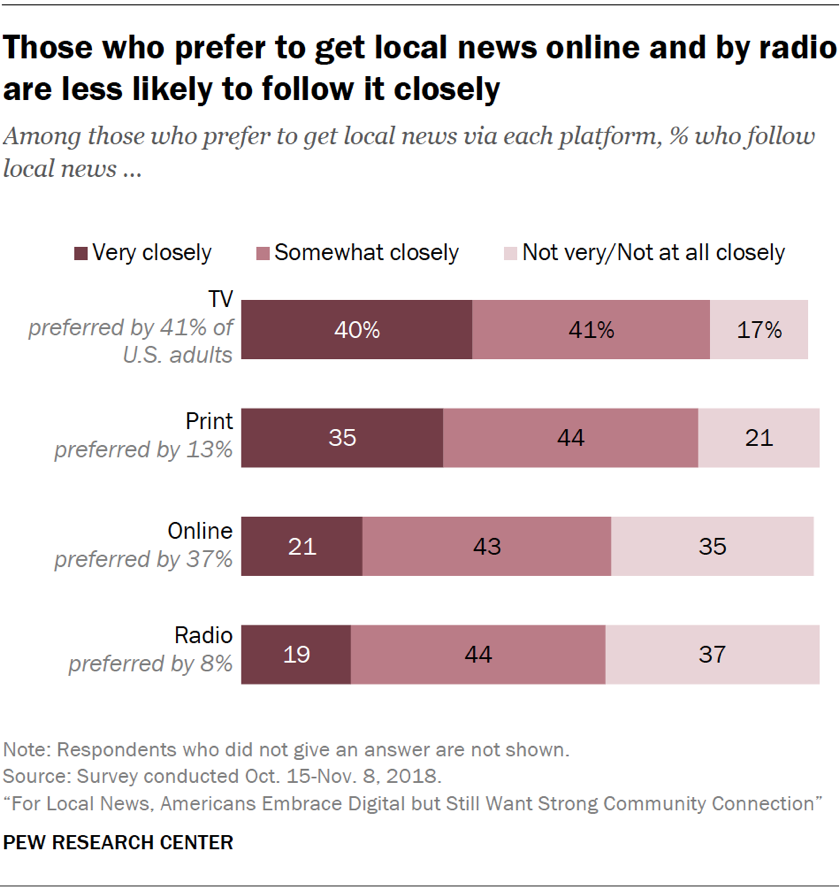
At the same time, television-oriented local news consumers may have a stronger attachment to local news than those with digital preferences. U.S. adults who prefer getting local news online are less likely to follow local news very closely (21%, compared with 40% among those who prefer TV).
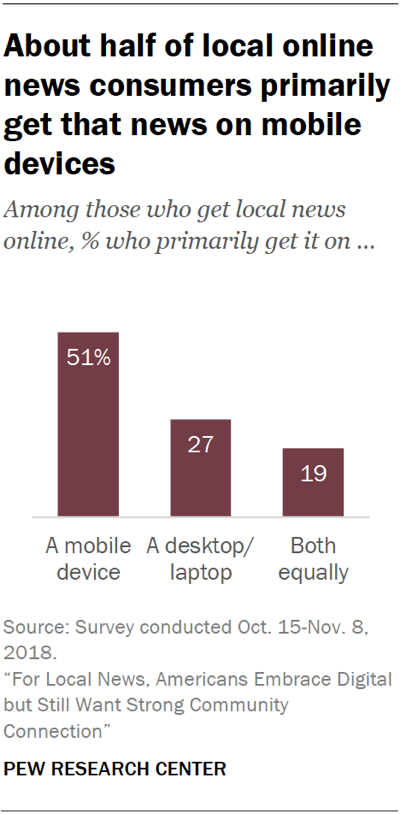
Digital local news consumption is being done more through mobile devices than desktop or laptop computers. Roughly half of those who get local news online (51%) primarily do so through a mobile device, about twice that who primarily do so on a desktop/laptop computer (27%); 19% get news on both types of devices equally.
News alerts are a prominent part of the local news environment. Roughly four-in-ten U.S. adults (42%) get local news alerts on their mobile phone.
1. Nearly as many Americans prefer to get their local news online as prefer the TV set
The digital environment is now a key component in how Americans learn about local events and issues in the news. Today, almost as many U.S. adults say they prefer to get their local news through the internet as prefer to do so through the television set.
Specifically, when asked which pathways they prefer to use for local news – the television set, the internet (either through social media or websites/apps), print or radio – nearly the same portion of U.S. adults say they prefer an online method (37% total, including 23% who favor news websites or apps and 15% who name social media) as say they prefer television (41%). Far fewer prefer print newspapers (13%) or radio (8%). This close split between TV and online pathways tracks closely with how Americans access news more generally.
Beyond digital being the preferred pathway, 89% of Americans get at least some local news digitally and about four-in-ten (41%) do so often. This breaks down to about equal shares who often get local news specifically from social media (25%) and online news websites or mobile apps (26%).
Local TV stations remain the most relied-on individual source, despite having little online presence
In addition to the various pathways used to get local news – online sites, apps, television, print and radio – consumers can turn to a growing range of specific sources. In most cases these sources now offer content through several pathways. For example, someone who turns to their local newspaper for news can access it in print, via its website or by following the outlet on social media.
To untangle this complex system, this study first asked respondents how often they get local news from each of nine different providers (such as local TV stations or community newspapers), and then asked how they tend to access that source (whether print, television, the internet, etc.).
The results show that local TV stations are the top type of source for local news. About four-in-ten Americans (38%) say they often get news from local TV stations (86% ever do so). Radio stations (from which 20% often get news) and daily newspapers (17%) serve as the next most popular providers of local news.
All in all, 28% of the public often gets news from at least one of six less traditional types of providers asked about here, and a vast majority – 89% – ever get news from at least one of them.
Many Americans turn to the online versions of local news providers
Even as TV stations are a powerhouse source for local news, they are still accessed primarily through the analog format of television sets; this is also true of radio news stations.3 Fully 76% of those who get news from local TV stations and 81% of those who get news from radio stations primarily go to these providers through the traditional pathway.
But other news providers have a substantial portion of their audience who access them online. Among those who get local news from daily newspapers, for example, 43% primarily access them online while 54% get them mainly in a print format. And nearly half of those who get local news from newsletters or listservs (49%) do so primarily online.
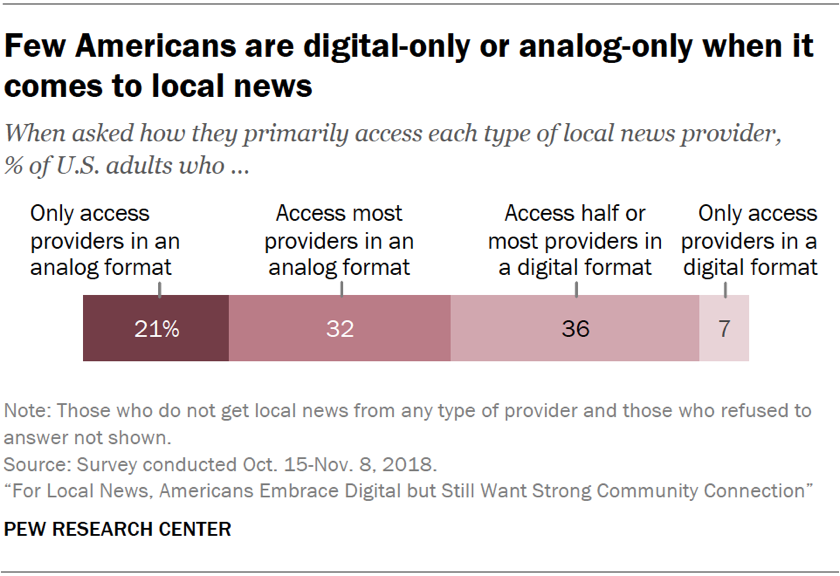
At the same time, few Americans are fully analog or fully digital in the way they get local news. Instead, most (68%) mix online and offline pathways, for example, turning on the TV set to watch their local news station but going online to read the daily newspaper and neighborhood listserv.
Just 7% of Americans indicate that they only use digital pathways as their primary access points. Three times as many U.S. adults (21%) mainly access all providers they get news from through an analog pathway – though this is still also a clear minority.
Minority of Americans often turn to multiple types of providers for local news
When it comes to Americans’ everyday news habits, most get their local news from a small number of sources. In fact, a sizable portion of the public doesn’t frequently turn to any sources: Nearly four-in-ten Americans (38%) don’t get news often from any of the nine provider types. Three-in-ten regularly rely on a single source type – most often local TV stations – and another 31% often get news from two or more types of sources.
Nonetheless, a large majority of U.S. adults (79%) get at least some news from four or more of the nine types asked about. In other words, while Americans may not frequently get local news from very many providers, their local news diets overall span a wide range of sources.
Infrequent local news consumers are more likely to turn to digital formats
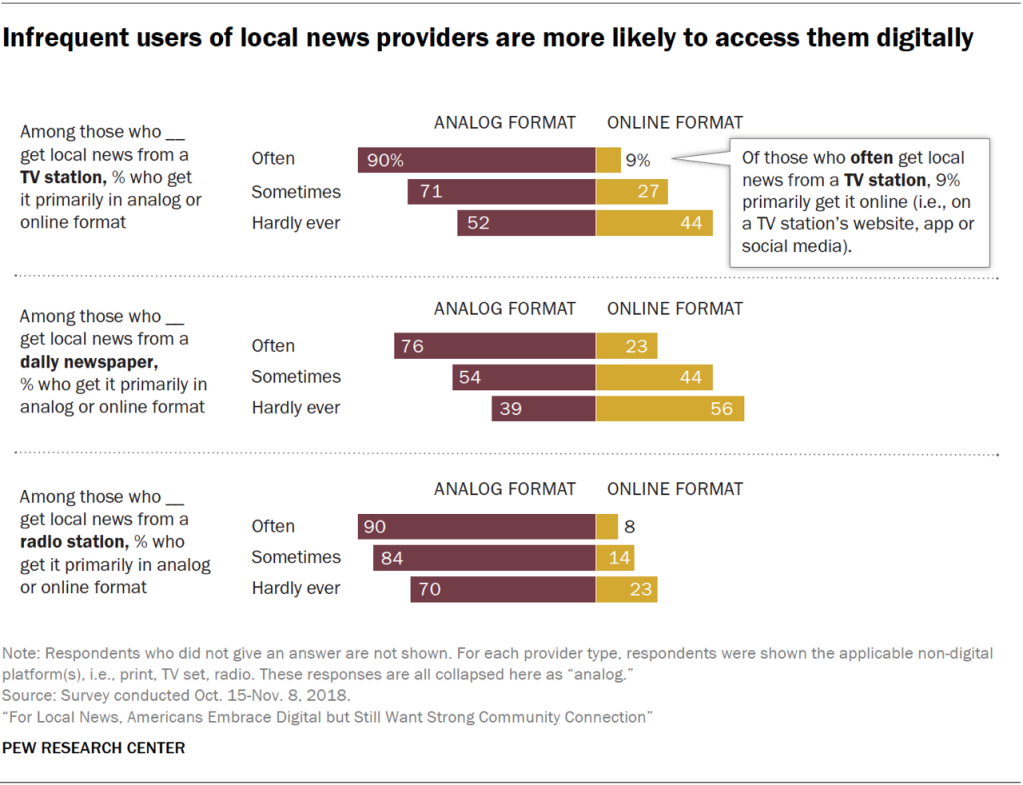
In many cases, Americans who turn to local news providers more frequently are more likely to access them in analog form rather than digital. Conversely, infrequent news users are more likely than frequent ones to take a digital path.
For example, 90% of those who reliably turn to a local TV station do so primarily on a TV set. This drops to 71% among those who say they engage with local TV stations only sometimes, and 52% among those who say they hardly ever get news there. The remaining shares of each utilize digital options. A similar pattern holds for users of daily newspapers, radio stations and non-daily newspapers: Those who often get news there are more likely than less frequent users to opt for traditional means.4
A similar dynamic comes through at a broader level. Roughly two-in-ten (21%) of those who prefer to get local news online tend to follow local news very closely, compared with 40% of those who prefer TV and 35% of those who prefer print. The few Americans who prefer radio are also less likely to follow local news very closely (19%).
Americans still rely on other people to keep them updated
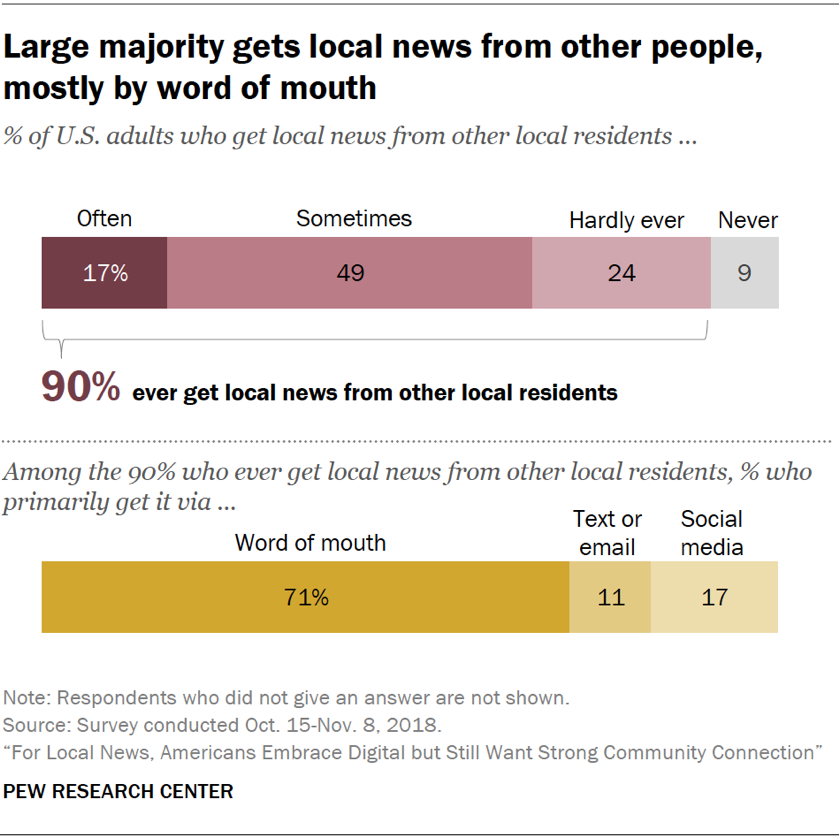
Beyond media organizations and other information providers, it’s common to get local news from friends, neighbors and family – 90% do so at least occasionally, and 17% do so often. This largely happens by word of mouth (either face to face or over the phone) as opposed to through email, text or social media.
Many say the internet is an important source for local news; fewer say this of social media specifically
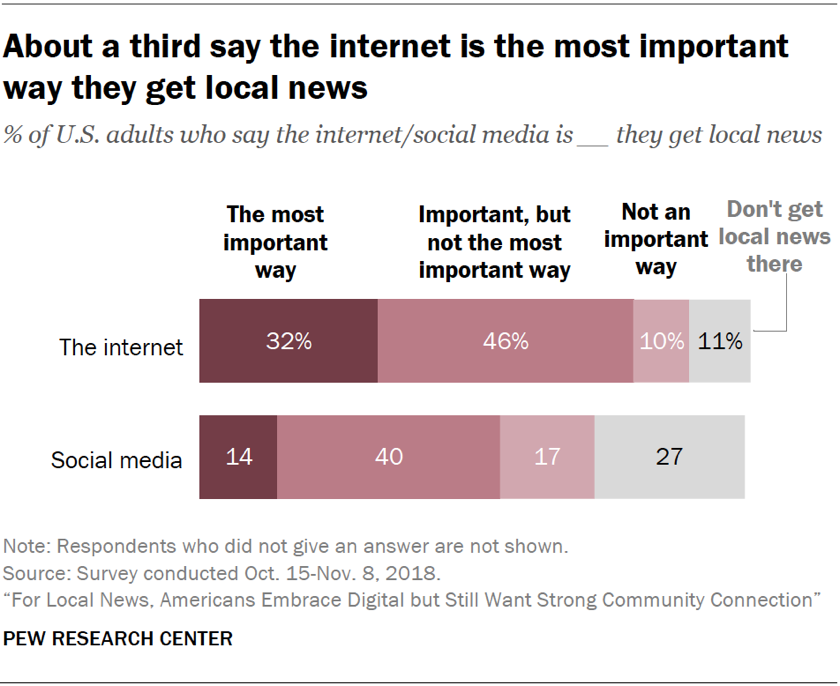
Most Americans see the internet as an important way of keeping up with local news, but fewer see it as critical. Overall, a large majority (77%) say the internet is important in how they get local news, but this drops to about a third (32%) who think it is the most important way. Just one-in-ten, on the other hand, say the internet is not important in getting local news, and a similar-sized share doesn’t use the internet to get news.
When it comes to social media specifically, more than half of Americans (54%) describe it as an important way they get local news, though 14% say it is the most important.
Mobile devices are far more popular than desktop computers for accessing local news online
Of the 89% of Americans who get local news online, about half (51%) say they do so primarily through a mobile device; fewer name desktop or laptop computers (27%) and 19% use both equally. This follows patterns in how Americans get their news more generally, with mobile news use overtaking desktop in 2017.
News alerts are also a substantial part of the way people access local news on their phones – about four-in-ten U.S. adults (42%) get local news alerts on their phone.
Digital news consumers place high value on an easy-to-use website
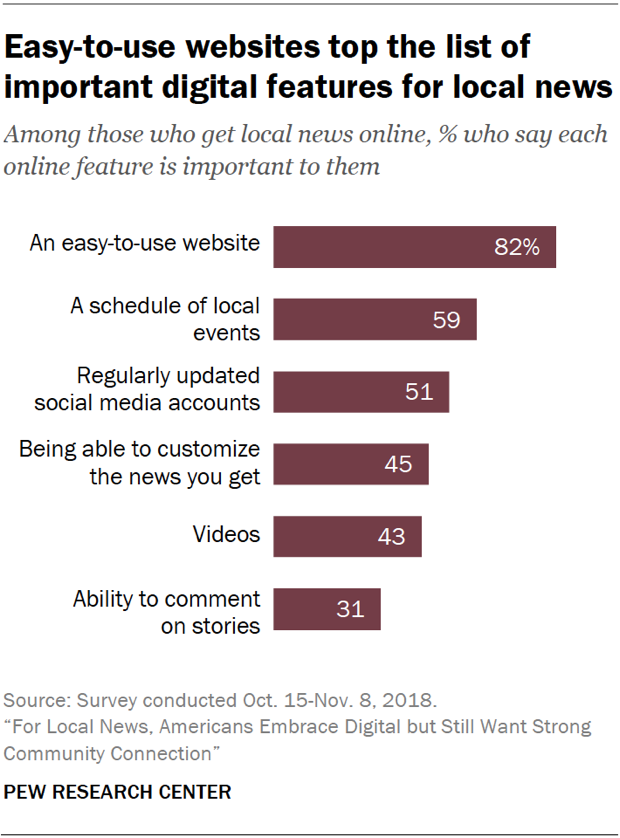
Within the digital news experience, more Americans place value on basic needs than on advanced digital features. A large majority of those who get local news online (82%) say that an easy-to-use website is an important feature of an online local news source. Fewer say other features are a priority – 59% say schedules of local events are an important feature, and about half (51%) say this of regularly updated social media accounts. Customizable news, videos and comment sections rank lower.
While about half of online news consumers appreciate outlets having a regularly updated social media account, few Americans place a high premium on local journalists using social media themselves. About one-in-five U.S. adults (21%) say it is very important for local journalists to be active on sites like Twitter and Facebook, while 40% say it is somewhat important. Roughly four-in-ten (37%) say it is not very or not at all important.
The reliance on social media as a pathway to local news raises the question of whether people notice the actual source of the local news they get from these sites. In fact, a majority of those who get local news from social media (64%) say they do pay attention to the sources they see on these sites.
2. The public places high value on journalists’ connection to the community; fewer say they experience it
At the heart of many current efforts to strengthen public trust and engagement in local news systems is an emphasis on journalists’ connection with their audiences.
The data show there is public support for efforts like these. Americans place high value on a close connection to the community, though there is less consensus on whether the local media meet this bar.
The vast majority of U.S. adults want their local journalists to be a part of their community. Roughly four-in-ten (42%) say it is very important for local journalists to be personally engaged in the community, and another 40% say it is somewhat important, for a total of 81%. Similarly, nearly half (48%) say it is very important for local journalists to understand the history of the community, with another 37% calling it somewhat important. Just two-in-ten say either of these is not very or not at all important.
Americans offer a more mixed assessment of journalists’ actual connection to their community
While Americans largely agree on the importance of the local media’s connection to their community, there is less sense that journalists meet this standard.
A majority of U.S. adults (63%) say local journalists are generally in touch with their community rather than out of touch (34%). But there is much less of a sense that their local media are truly influential. Overall, 61% say their local media do not have much influence on the community, compared with 37% who say they do.
And, if one core element of community connection is “locally sourced” reporting, much of the country feels they are missing out. About half of Americans (51%) say their local news media mostly cover the area where they live, while 47% say they cover another area such as a nearby city.
There can be many contributing factors to this disparity: Budget cuts and financial constraints, consolidation and buyouts, and the sprawling distribution of the U.S. population could all play a role. Indeed, rural residents are more likely to say local news does not cover their area: A majority of self-described rural Americans (57%) say so, compared with about a third of self-described urban residents (35%) and about half of self-described suburban residents (48%). Whatever the cause, a large share of Americans across the country don’t feel their area is fully represented in local news media’s coverage.
Finally, few U.S. adults have had any kind of personal connection with local journalists – 21% say they have ever spoken with or been interviewed by a local journalist. What’s more, those who are older and white are more likely to have spoken with a local journalist – speaking to recent concerns about a lack of diversity of sources in reporting.
In news coverage, Americans value accuracy, thoroughness and fairness
When asked about the reporting itself, Americans clearly place the highest value on accuracy. Accurate reporting topped the list of seven core news media functions, named by about two-thirds (65%) as one of the two functions they value most in local media. Next on the list, though fairly far behind, are thoroughness (35%) and fairness (30%). Fewer see the most or second-most value in providing news you can use daily (25%), transparency (20%), serving as a watchdog on political leaders (11%) or inclusion (7%).
Majority says local journalists should not share their personal opinions about local issues
Finally, even in calling for journalists to be a close part of the community, the public feels that certain ethical lines are important for journalists to maintain. A solid majority (61%) says journalists should not share their own personal views about local issues, far more than the 36% who say they should.
3. Americans give fairly high marks to their local news media, especially when journalists are seen as connected to the community
Americans feel pretty good about the job their local news media are doing. Overall, about a quarter (24%) say their local media do very well at keeping them informed on the most important stories of the day, and 81% say they do at least fairly well.
Most also say their local news media do well at seven core job functions. At the top are reporting news accurately (71%), providing “news that you use daily” (67%), keeping an eye on local political leaders (66%) and reporting news thoroughly (65%). Majorities also say their local media do well at being transparent (62%), dealing fairly with all sides (62%) and including “people like you” in their stories (58%).
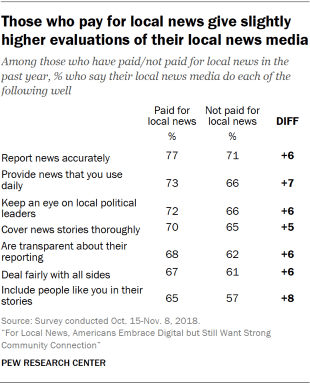
But not everyone shares the same high opinion of their local news media. Those who say their local journalists are connected to their communities, those who prefer to get local news from TV and those who pay for local news all tend to give their local media higher evaluations – though the strongest division by far is between those who feel their local media are connected to the community and those who do not.
Confirming past research about other types of news, this study also finds a link between closer attention to local news and more positive job evaluations of local news media. Those who follow local news very or somewhat closely, for example, are 30 percentage points more likely than others to say local news media do well at providing news they use daily (75% vs. 45%). There is something of a natural connection between rating the media poorly and following the news they produce less closely. Less-intuitive relationships between measures such as community connection and job ratings hold true even when controlling for how closely people follow local news.
Americans who feel their local news media are more connected to the community evaluate them more positively
While most Americans agree it is important for local news media to be connected to their community, they offer mixed views on several measures of that connection. This matters when it comes to job evaluations. Americans who sense their local outlets are well-connected to the community in each of three areas – being in touch with the community, local influence and geographically focused coverage – are much more likely to evaluate local news reporting positively, be confident in their main news source’s ability to inform them, and say it is easy to find news on a range of different topics.
Consider the mix of job functions asked about. While individuals who see local news media as more or less connected tend to rate the importance of these functions similarly, they rate the performance of them very differently. The largest gaps appear between those who feel their journalists are in touch with their community and those who feel they are out of touch. For example, 83% of those who think their journalists are in touch with the community say their local media are doing well at reporting the news accurately, 31 percentage points higher than those who say they are out of touch (52%).
This group is similarly more likely to rate the local news media positively in other areas, including on ethical considerations, such as being transparent about reporting (74% vs. 43%) and dealing fairly with all sides (73% vs. 42%); professional concerns, like covering news thoroughly (77% vs. 46%) and providing news that you use daily (77% vs. 49%); and issues of serving the local community, such as keeping an eye on local political leaders (77% vs. 48%) and including people like them in their stories (69% vs. 38%).
Another measure of journalists’ connection to the community is whether residents feel their coverage is truly local – that it is mostly about the area where they live, rather than a different area such as a nearby city. The roughly half of Americans who feel their news has a more local focus also give their local media higher ratings. That again includes everything from reporting news accurately (77% among those whose media cover their own area vs. 66% of those whose local coverage is about somewhere else) and thoroughly (72% vs. 59%) to dealing fairly with all sides (68% vs. 56%) and including people like you in their stories (66% vs. 50%).
The same pattern holds true for those who say their local media have a lot of influence on their community. That includes more positive ratings for providing news that is used daily (78% among those whose media are influential vs. 61% among those whose media are not) and featuring relatable people in stories (67% vs. 52%).
This divide also comes through clearly in the overarching evaluation of how well local media do at keeping people informed of the most important stories of day: 31% of those who find their local journalists to be in touch say they do very well at this, roughly twice the rate of those who see their local media as out of touch (14%). Similar gaps exist between those who see the media as influential or not (35% compared with 18%) and those whose media covers their local area or another area (30% compared with 19%).
Confidence in main news source and ease of finding the news track closely with local news media’s community connection
The same trend also emerges when it comes to how confident people are in their main local news source to get them the information they need.
For example, about twice as many of those who think their local journalists are in touch versus out of touch say they are very confident in their main news source (37% vs. 18%).
Another way people assess the job of their local media is how easily they can find the news they are looking for on particular local topics. Those who think their local journalists are in touch are as many as 14 percentage points more likely to find it very easy to get information on topics in which they are interested. This is true, for example, of local crime news (42% vs. 28%), weather (81% vs. 68%), sports (56% vs. 44%) and local prices (27% vs. 21%).
Somewhat higher job evaluations among those who prefer TV to online or radio
Those who prefer to get their local news on TV offer somewhat more positive ratings of local media than those who prefer getting news online or on the radio, with those who prefer a print paper falling in the middle.
For instance, about three-quarters of U.S. adults who prefer TV (74%) say their local media do well at providing news they can use daily; this is true of about six-in-ten who prefer to get local news online (60%) or via radio (62%). Those who prefer print fall in between (68%). There is also a sizable gap on the question of whether local media do well at dealing fairly with all sides – 68% who prefer TV say this, compared with 62% who prefer print, 57% who prefer the internet and 56% who prefer radio.
Those who prefer TV also stand out in terms of their confidence in the ability of their main source of local news to provide them the news they need. Roughly four-in-ten (37%) are very confident, compared with 29% who prefer radio, 27% who prefer print and 24% who prefer to get news online.
Those who pay for local news show slightly more positive attitudes about their local news media
Finally, there is a small but consistent difference between the small portion of Americans (14%) who pay for local news and those who don’t in how they rate their local media. Those who say they pay for local news either through subscribing, donating, or becoming a member are between 5 and 8 percentage points more likely to give their local media high marks on each of the seven journalistic roles asked about. For instance, about two-thirds of those who pay for local news (65%) say their local media do well at including people like them in their stories, compared with 57% of those who do not pay for local news.
Those who pay for local news also have more confidence in their main source. Nearly four-in-ten (37%) are very confident, compared with about three-in-ten (29%) among those who do not pay.
4. Most Americans think their local news media are doing well financially; few help to support it
One ongoing challenge for the news industry has been finding ways to finance their work in a digital era where traditional forms of revenue have crumbled. As shown by Pew Research Center’s annual assessment of the state of the news media, newspaper industry advertising (made up primarily of local papers) has declined 67% since its peak in 2005, with staff layoffs still occurring. Local TV revenue, while more resilient, also saw some decline – 17% between 2005 and 2017, with greater fluctuation between on- and off-year election cycles.
According to this study, however, most Americans think their local news media are doing just fine financially. About seven-in-ten say their local news media are doing either somewhat or very well financially (71%), while about a quarter say their local news organizations are not doing well (24%).
That sense seems to be reflected in their own contributions, or lack thereof. When asked if they had paid or given money in the past year to any local news source – by either subscribing, donating or becoming a member – 84% of Americans said no; 14% said yes.
And, despite some attempts by news organizations to attach various types of paywalls to their content, the main reason Americans don’t pay is the availability of free local news alternatives (49%). The reason ranking second, though cited by far fewer, is lack of interest in local news (26%), followed by concerns about the expense (12%) and the quality of news (10%).
Print-oriented local news consumers more aware of financial challenges and more likely to pay for local news
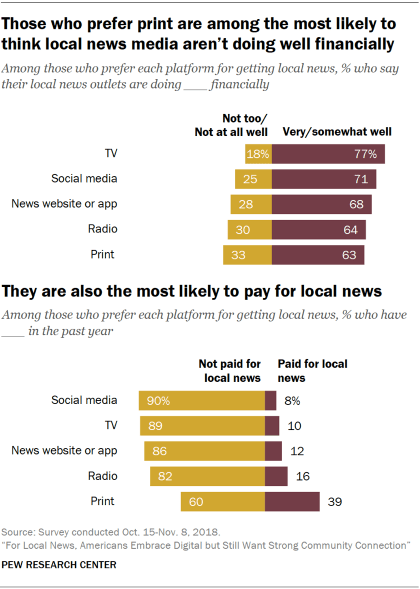
Consumers who are more tied to a print news product are more likely than most others to sense financial strain on the local news industry, and they also are the most likely to offset it some by paying for local news themselves.
A third of those who prefer print think their local news media are not doing well financially. That is almost double the 18% of those who prefer news via the television set that feel this way. Those who prefer radio are about on par with print, and the digital platforms fall in between.
Those who prefer print news products stand out even more when it comes to paying for local news. About four-in-ten of those who prefer print (39%) pay for news through a subscription, donation or membership. That is more than double that of any other group – and nearly four times the 10% of those who prefer to get local news from TV, and the 8% of those who prefer to get local news via social media.
5. The importance of local news topics often does not align with how easily the public can find information about them
As many newsrooms face declines in revenues and staffing, one difficult choice to make is where to focus coverage and resources. This study asked Americans about the weight of 11 different local news topics in their lives, ranging from needing a daily news fix to having no interest at all, and how easy it is to stay informed about each. The findings indicate that Americans differ in the importance they place on local news topics and in the ease with which they get that information. And often, the topics Americans rank as high in importance are not the ones for which they feel news is easy to find.
Americans express interest in a wide range of topics but see few as important for daily life
While a number of local news topics are seen as important or interesting, only one of the 11 ranks as important for their daily life by a majority of Americans: the weather, named by 70%.
Crime, traffic and changing prices come next, with roughly four-in-ten or more saying each is vital information for daily life. No more than a quarter of Americans, on the other hand, say that any of the remaining seven topics – such as sports, arts and culture or jobs – are important for daily living.
Beyond daily importance, a majority of Americans find each topic at least interesting to follow. For instance, while about a quarter say government and politics is important to follow for daily life (24%), half say it is important to know about, even if not daily, and an additional 13% say it is interesting to follow.
Just 8% feel they need daily restaurant news, but a third consider it an important topic to follow generally and about another third (36%) say it is interesting to keep up with. Sports is the only topic for which a sizable portion of Americans (34%) say it is neither important nor interesting to follow, though most Americans have at least some interest in the topic.
On the whole, about a quarter (23%) say five or more of the 11 topics are vital for daily life, and about three-in-ten (28%) feel this way about three or four topics. Only 16% say none of the topics are vital for daily life. In comparison, over nine-in-ten Americans (95%) have at least some interest in five or more topics, while a mere 3% don’t have interest in any of the 11 topics.
Americans do not always think the most important topics are the easiest to keep up with
How easy is it for American local news consumers to stay informed on topics of interest? The answer is: It varies. Weather is deemed the easiest to keep up with, with 76% of those who are at least interested in the topic saying they have no trouble getting the news they need. At the opposite end are jobs and unemployment. Only 21% of consumers who are at least interested in this topic say keeping informed is very easy, while 24% say it’s somewhat or very hard.
Across all 11 topics, up to about two-in-ten (21%) find some topics somewhat hard to keep up with, though very few – no more than 3% – say any of them is very hard.
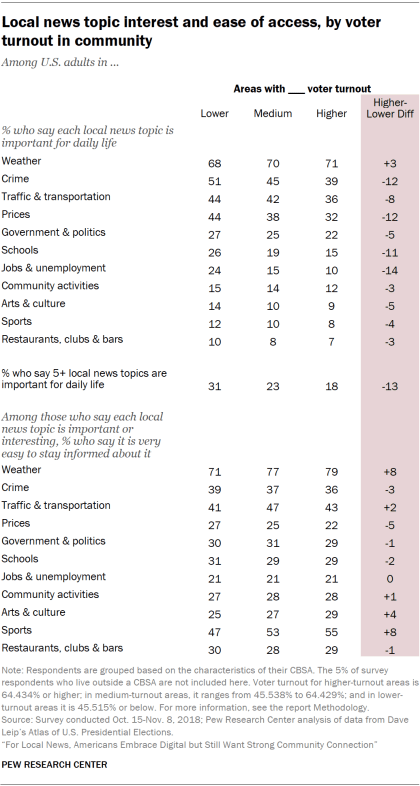
A local topic’s importance and the perceived availability of news on that topic do not always line up. Some topics are important for many Americans’ daily lives but not particularly easy to stay informed about, while others are not seen as important by many people but rank higher in ease.
Take the topic of changing prices. About four-in-ten Americans (37%) say information about prices is important to follow for their daily lives. However, only a quarter of those who are at least interested in the topic say it is very easy to stay informed about it.
Conversely, sports ranks toward the bottom in importance for daily life (10%) but is one of the easiest local topics for Americans to find information on: About half of those who think it is at least interesting (52%) say it is very easy to stay informed about it.
Some topics, like traffic, rank high in importance and in ease: About four-in-ten U.S. adults (41%) say traffic is an important topic for daily life (third-highest among all topics). And among those at least interested in the topic, 46% say it is very easy to stay informed about it, making traffic the third-most accessible topic of the 11.
People who place weight on a greater number of local news topics are more likely to get news from a variety of provider types
The number of topics Americans find important for daily life is closely associated with the number of providers they turn to for local news. Specifically, those who see a greater number of topics as having daily importance also tend to get local news from a wider range of provider types.
Among those who say that at least five of the 11 topics are important for daily life, about three-in-ten (29%) often get news from three or more providers. This is roughly twice that of those who say three or four topics are important for daily life (16%). Only 9% of those who say one or two topics and 4% of those who say no topics are vital for daily living often get news from three or more providers.
In fact, among those who say no topics are important for daily living, about seven-in-ten (68%) don’t get news often from any provider type. This drops substantially to about two-in-ten among those who say five or more topics are vital (22%).
6. Overall, social media plays a moderate role in local news
A more in-depth look at the findings across this study that relate to social media reveals that, overall, social media plays a moderate role in local news – sometimes eclipsing traditional pathways in popularity but still being decidedly less prominent than the television. It is more commonly preferred by Americans living in some types of local areas, such as those with younger residents and a higher proportion of Hispanic and black residents. In addition, those who prefer social media as a pathway to local news tend to follow local news less closely.
Among U.S. adults, 15% say social media is their preferred pathway to local news, a bit lower than the 23% who cite websites or apps and far behind the 41% who cite the television set. However, the share who prefer social media is roughly equal to the 13% who prefer print newspapers, and higher than the 8% who prefer radio. (As noted in Chapter 1, social media and websites combined put online pathways nearly on par with the TV.)
Roughly one-in-four U.S. adults often get local news from either social media (25%) or websites and apps (26%); 72% and 81%, respectively, ever get news through these digital means.
Americans’ use of social media for local news seems to be fairly broad at this point; few say it is the main way they access specific local news providers. Among the nine types of providers asked about here, social media stands out as a primary access point for only one: online forums or discussion groups such as community Facebook groups or Nextdoor. More than half who get local news from these groups (59%) mainly access them through social media (vs. 36% who mainly access them through websites or email). No more than four-in-ten who use the other providers primarily access them on social media. For example, 13% who get local news from daily newspapers primarily access them via social media, compared with three-in-ten who primarily use websites, apps or email and 54% who primarily use print newspapers.
This lower prominence also comes through in a separate question about how important social media is as a way of getting local news. Only 14% of U.S. adults name it as most important, four-in-ten say is it somewhat important and about two-in-ten (17%) say it is not an important way at all.
Finally, the public sees social media as a moderately important part of news organizations’ digital offerings. Fewer online news consumers say regularly updated social media accounts are important to their online news experience (51%) than say that of an easy-to-use website (82%) or a schedule of local events (59%). But regularly updated social media accounts do score higher on this measure than videos (43%) or the ability to comment on news stories (31%). Separately, just 21% of U.S. adults say it is very important for journalists to be active on social media, while nearly four-in-ten (37%) say it is not very or not at all important.
Certain types of Americans – and those in certain types of American communities – rely more on social media for local news
Those with a younger population (17% prefer social media, vs. 11% in areas with a higher median age);
Those with a higher proportion of Hispanics (19%) compared with those with a higher proportion of whites (13%);6
Those with lower voter turnout (19% vs. 12% in areas with higher voter turnout in 2016).
Americans’ personal demographics influence their preference for social media in similar ways. Social media is more likely to be the preferred pathway to local news among:
Those ages 18 to 29 (32% prefer social media, vs. 17% of those ages 30 to 49, 7% of those 50 to 64 and 3% of those 65 and older);
Hispanics (22% vs. 12% of white non-Hispanics and 15% of black non-Hispanics);
Those who prefer mobile devices for getting news online (21% vs. 9% who prefer desktop/laptop computers and 14% who prefer both equally);
Those who are not registered to vote (22% vs. 11% who are registered).
In addition, social media is preferred at nearly twice the rate among those who do not pay for local news (16%) as those who do (9%) – giving further evidence to the finding that those who do not pay for local news primarily do so because there are many free options available.
As a group, Americans who prefer social media stand out in some ways. They have lower interest in local news overall. Only about one-in-five of those who prefer social media (22%) also say they follow local news very closely; 40% follow local news somewhat closely, and 37% follow local news not very or not at all closely. This is a much lower rate than those who prefer print (35% follow local news very closely) or the television (40%), but it is about on par with those who prefer websites/apps or the radio.
Finally, Americans who prefer social media are often more negative about the local news media than those who prefer TV or print, but they do not consistently stand apart from those who prefer websites or radio. Looking specifically at social media versus the TV set as a pathway to local news, Americans who prefer social media are less likely to see their local news media doing well at multiple job roles or being in touch, and they are less confident that their main source of local news can get them the information they need. But on questions of local media being influential or covering their local area, these groups do not differ.
Part Two: Taking a closer look at local news attitudes and behaviors within individual local areas
This survey of nearly 35,000 randomly selected adults from across the United States was designed at a large enough scale to allow for a geographically granular view of the local news landscape. As such, this report is accompanied by an online, interactive feature that lets readers explore the local news behaviors and attitudes of Americans living in 99 different local areas. These areas, referred to by the U.S. federal government as core-based statistical areas (or CBSAs), can be roughly described as an urban center and its suburbs.
What is a CBSA?
CBSAs – or core-based statistical areas – are geographic areas defined by the U.S. federal government as consisting of at least one urban core of 10,000 people or more, plus adjacent counties that are socio-economically tied to the urban center.
There are two types of CBSAs: metropolitan statistical areas and micropolitan statistical areas. A metropolitan statistical area must have at least one urban core with a population of 50,000 or more inhabitants. A micropolitan statistical area must have at least one urban core with a population of at least 10,000 and less than 50,000 people. In total, there are 933 CBSAs in the 50 states and District of Columbia comprising 1,825 counties. About 94% of the population lives in one of these CBSAs.
San Antonio is a community where residents have positive attitudes about their local news media’s connection to the local community and performance.
Residents of this area feel more connection with their local news media than do U.S. adults overall. Most strikingly, approximately two-thirds of San Antonio-area residents (69%) say their local news media mostly cover the area they live, compared with 51% of U.S. adults overall. Residents are also more likely to say local news has an influence on the community (43% vs. 37% of U.S. adults).
As is the case across the United States, San Antonio-area residents’ strong sense that their local news media are connected to the community relates closely to positive ratings of their local media’s performance. Those in the San Antonio area are more confident than U.S. adults overall in their main source for local news (37% are very confident vs. 30% of U.S. adults). They are also more likely to say local journalists do well at being transparent (73% vs. 62% of U.S. adults), covering issues daily (77% vs. 67%) and representing people like them (66% vs. 58%).
San Antonio-New Braunfels, TX CBSA
2.3 million residents
Median age: 34
Median annual household income: $54,638
27% have at least a college degree
6% black, 55% Hispanic, 35% white
14% of population in rural area
46% voter turnout in 2016
16% say they are very attached to the community
Note: Whites and blacks are single-race non-Hispanics. Hispanics are of any race.Source: Survey conducted Oct. 15-Nov. 8, 2018; Pew Research Center analysis of American Community Survey data and data from Dave Leip’s Atlas of U.S. Presidential Elections.
The most prominent main source for San Antonio-area residents’ local news (as volunteered in an open-ended question) is KSAT, an ABC affiliate TV station (33%). Local TV stations KENS, a CBS affiliate (9%) and KABB, a Fox affiliate (4%), are also named. The San Antonio Express-News, the local metro daily paper, is named by 6%.
These findings mostly mirror the results for their use of different provider types: Nearly half of San Antonio-area residents (47%) often get local news from TV stations, higher than any other provider type, and higher than among U.S. adults overall (38%). Meanwhile, only one-in-ten San Antonio residents say they get news often from their local daily paper (compared with 17% of U.S. adults). There are no differences between San Antonio-area residents and U.S. adults overall in the rates at which they get local news often from radio stations (18% vs. 20%).
San Antonio residents place something of a premium on social media for news. Although they are no more likely than U.S. adults overall to often get local news on social media, they are more likely to prefer social media as a pathway to local news (20% vs. 15%). They are also less likely to prefer news websites and apps (17% vs. 23%), and, when it comes to getting local news online, less likely to prefer desktop/laptop computers to mobile devices (17% vs. 27%).
Residents of the Minneapolis-St. Paul area are also very positive in their evaluations of local news and are more likely than U.S. adults overall to prefer legacy platforms when accessing providers.
Twin Cities residents are more likely than U.S. adults overall to say their local media are connected, both in terms of local journalists being in touch (77% vs. 63% of U.S. adults) and local news media mainly covering their area (59% vs. 51%). As in San Antonio, the greater feelings of connectedness are tied to more positive evaluations. Minneapolis-St. Paul area residents are more likely to say they are very confident in their main source for local news (36% vs. 30% of U.S. adults) and that their local news media do well at nearly all roles asked about, particularly representing people like them (68% vs. 58%), keeping an eye on local political leaders (77% vs. 66%) and being transparent (72% vs. 62%). However, residents of this area show no higher interest in local news (31% follow very closely, the same as among U.S. adults).
Minneapolis-St. Paul residents are somewhat more likely than U.S. adults overall to prefer non-digital pathways as their primary access point for different provider types. Among those getting local news from a daily newspaper, 62% of residents prefer print, compared with 54% of U.S. adults. Similarly, 90% of Minneapolis-St. Paul area residents who get news from local radio stations primarily do so on an actual radio, more than the 81% of equivalent U.S. adults who say so (St. Paul is the home of public radio distributor American Public Media). And, for those getting news from local TV stations, 85% in this area prefer the TV to digital forms, compared with 76% of U.S. adults. At the same time, though, Twin Cities area residents say they use social media and websites for local news at about the same rates as the population overall.
Minneapolis-St. Paul-Bloomington, MN-WI CBSA
3.5 million residents
Median age: 37
Median annual household income: $70,915
40% have at least a college degree
8% black, 6% Hispanic, 77% white
12% of population in rural area
73% voter turnout in 2016
25% say they are very attached to the community
Note: Whites and blacks are single-race non-Hispanics. Hispanics are of any race.Source: Survey conducted Oct. 15-Nov. 8, 2018; Pew Research Center analysis of American Community Survey data and data from Dave Leip’s Atlas of U.S. Presidential Elections.
Asked to write in their main source for local news, one-in-ten residents volunteer the daily Minneapolis Star Tribune, while 14% name NBC affiliate KARE and 12% name CBS affiliate WCCO. In addition, 7% name Minneapolis Public Radio and 2% name the St. Paul daily Pioneer Press. In general, those in the Minneapolis-St. Paul area access local providers at roughly the same rate as U.S. adults overall, with local TV the most common (36% get local news there often) followed by radio stations (21%) and daily newspapers (19%).
In contrast to San Antonio and Minneapolis, residents of the Riverside area seem to be suffering a kind of malaise when it comes to local news. Compared with U.S. adults overall, Riverside residents are less likely to use local news media, rate them highly or say they are in touch with their community. However, Riverside-area residents are somewhat more likely to prefer social media for local news.
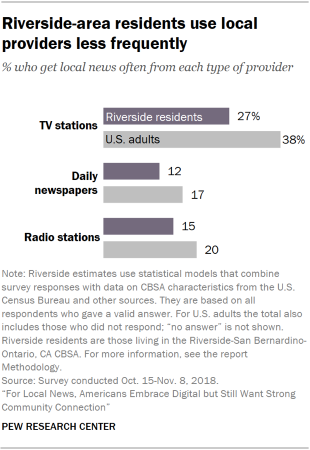
In addition to being less interested in local news overall – a quarter follow local news very closely, compared with 31% of U.S. adults – Riverside residents also get local news less often from the three main provider types (TV stations, daily newspapers and radio stations). About a quarter (27%) get news often from local TV stations (vs. 38% of U.S. adults), about one-in-ten (12%) from the daily paper (vs. 17% of U.S adults) and 15% from local radio stations (vs. 20% of U.S. adults). Perhaps as a consequence, they are also less likely to pay for local news – 9% of Riverside-area residents do, compared with 14% of U.S. adults.
Riverside-area residents are less likely than U.S. adults overall to say local news media mostly cover the area where they live, are less confident in their main source of local news, and do not find it as easy to get information about different topics. Fewer than half of Riverside-area residents say their local news media mostly cover their area (44%), compared with 51% of U.S. adults, though there are no differences on the questions of local journalists being in touch or local media being influential. In terms of how well local news media do, those in Riverside are less likely to be very confident in their main source of local news (23% vs. 30% of U.S. adults) and to say their local news media are doing very well at their job (18% vs. 24%).
Riverside-San Bernardino-Ontario, CA CBSA
4.4 million residents
Median age: 34
Median annual household income: $56,295
20% have at least a college degree
7% black, 50% Hispanic, 34% white
5% of population in rural area
43% voter turnout in 2016
15% say they are very attached to the community
Note: Whites and blacks are single-race non-Hispanics. Hispanics are of any race.Source: Survey conducted Oct. 15-Nov. 8, 2018; Pew Research Center analysis of American Community Survey data and data from Dave Leip’s Atlas of U.S. Presidential Elections.
The difference is clearest when it comes to the ease of getting information on particular topics: On all but two topics, Riverside-area residents are less likely than U.S. adults to say it is very easy to get information. For instance, among Riverside residents who follow sports, 39% say it is very easy to get information, compared with about half of U.S. adults (52%) who follow sports and say the same.
Amid this negativity, Riverside-area residents do show some higher preference for social media. About a quarter (24%) prefer social media as a pathway to local news, higher than among U.S. adults overall (15%). And they are less likely to prefer print newspapers (8% vs. 13%).
When it comes to the primary access point for specific providers, Riverside-area residents are more likely to use social media when getting news from local newspapers (21% of Riverside residents vs. 13% of U.S. adults), TV stations (17% vs. 9%) and radio stations (15% vs. 7%).
There is no agreement among Riverside-area residents on their main source for local news, based on their responses to an open-ended question. Most prominent are Los Angeles-based TV station KTLA (6%), Palm Springs-based ABC affiliate KESQ (5%) and Los Angeles-based ABC affiliate ABC 7 (4%). (Riverside is part of both the Los Angeles and Palm Springs TV markets.) Beyond local TV, 3% name Victor Valley News Group and 2% name Riverside daily paper The Press-Enterprise.
Cincinnati-area residents give their local news media strikingly low marks for being connected to the community – but by and large do not use local providers at any lower rates.
In Cincinnati, residents give their local news media lower marks on their community ties, particularly in terms of true local coverage. Only 35% of Cincinnati-area residents say their local news media mostly cover their area, compared with 51% of U.S. adults. In addition, three-in-ten Cincinnati residents say their local news media have a lot of influence on their community (vs. 37% of U.S. adults).
Cincinnati, OH-KY-IN CBSA
2.1 million residents
Median age: 38
Median annual household income: $56,861
32% have at least a college degree
12% black, 3% Hispanic, 80% white
14% of population in rural area
64% voter turnout in 2016
19% say they are very attached to the community
Note: Whites and blacks are single-race non-Hispanics. Hispanics are of any race.Source: Survey conducted Oct. 15-Nov. 8, 2018; Pew Research Center analysis of American Community Survey data and data from Dave Leip’s Atlas of U.S. Presidential Elections.
These concerns about connectedness translate to negative evaluations overall. When it comes to the different roles for local journalists, Cincinnati-area residents give lower marks for transparency (56% vs. 62% of U.S. adults), accuracy (64% vs. 71%) and thoroughness (59% vs. 65%).
While Cincinnati residents are less likely to follow local news very closely (22% do so, vs. 31% of U.S. adults), they are no less likely to often use a range of local providers, including TV and radio, though they do get news somewhat less often from the local daily paper (10% of Cincinnati-area residents do so often, vs. 17% of U.S. adults). They also show no differences when it comes to getting local news digitally.
Asked to name their main source of local news in an open-ended question, Cincinnati area residents primarily turn to local TV stations such as NBC affiliate WLWT (14% of Cincinnati-area residents say it is their main source), ABC affiliate WCPO (14%), CBS affiliate WKRC (13%) and Fox affiliate WXIX (10%). The local metro daily, The Cincinnati Enquirer, is named by 6%. In addition, 3% name suburban daily the Journal-News, while 2% name NPR.
Part Three: The characteristics of communities show some effect on local news habits
Any local news system is inherently embedded within a particular community – and characteristics of communities vary extensively, according to data from the U.S. Census Bureau and other sources. Some have a larger share of young adults, driving down the median age, while others have a sizable senior population, driving the median up. Some have more racial or ethnic diversity than others, with substantial black or Hispanic populations. The share of people still living in homes without broadband internet access is larger in certain communities than others. And some areas have many lower-income households while others carry a great deal of wealth.
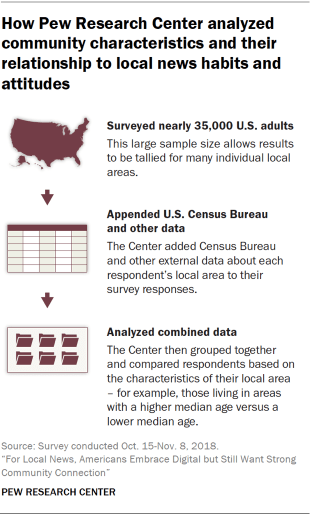
To explore how these differences relate to news habits, researchers grouped individuals based on the characteristics of their local area by adding Census Bureau data and other measures to the survey responses.
How Pew Research Center grouped communities based on their characteristics
Researchers appended data from the U.S. Census Bureau and other sources to the individual responses and then classified individuals by the characteristics of their local area. Five specific characteristics were analyzed:
Age groups communities based on the median age of all residents in the area, based on data from the 2012-2016 American Community Survey.
Race/ethnicity groups communities that, based on data from the 2012-2016 American Community Survey, have a higher proportion of Hispanic, non-Hispanic black and non-Hispanic white residents.
Income groups communities based on the median annual household income in the area, based on data from the 2012-2016 American Community Survey.
Broadband access groups communities based on the proportion of households in the area, based on data from the 2013-2017 American Community Survey, that have landline broadband access through a hard-wired connection such as cable, fiber optics, and DSL (distinct from cellular or other wireless internet connections).
The geographic unit of measurement used here is what the U.S. federal government calls core-based statistical areas, or CBSAs. These are defined as a central city and the counties that are tied to it, such as the Los Angeles CBSA, which also includes Orange County to the south as well as Long Beach and Anaheim.
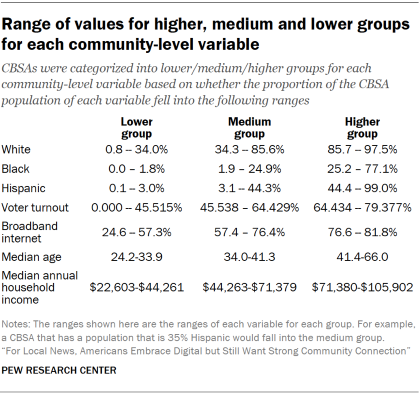
For the analysis, individuals are grouped together based the characteristics of their local area. For instance, researchers grouped together everyone who lived in CBSAs where voter turnout was above 64.434%. The criteria used to define the higher and lower group are given in the detailed tables below.
In making these groups, the goal was to examine communities that really stood out. As such, divisions were made so that the higher and lower groups are relatively small – roughly the top or bottom 10% of the U.S. population that live in a CBSA – while the middle group is large, often making up around eight-in-ten living in a CBSA. Given that the effects of community characteristics are largely indirect – as discussed below – this gives us the best chance at detecting their influence by minimizing the variation within each group.
The analysis finds that habits of and attitudes toward the local news media vary moderately based on these community characteristics. The differences may not be as dramatic or pervasive as one might think, due in large part to the natural mix of people that exists in any local area. Still, certain clear tendencies emerge.
Below are key findings of each community type examined, as well as an examination of differences by racial and ethnic makeup. The full data can be found in detailed tables that follow.
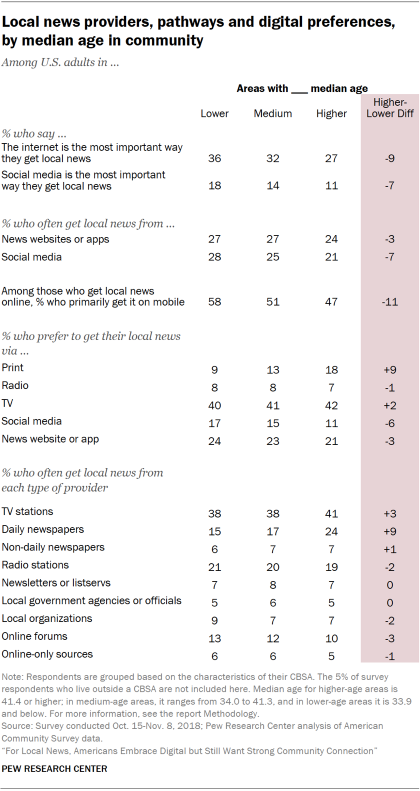
Age: Americans living in areas with lower median age stand out for their emphasis on digital pathways for local news. They are more likely than those living in areas with a higher median age to say the most important way they get local news is the internet (36% vs. 27% who live in areas with a higher median age) and social media specifically (18% vs. 11%). This is reflected in these areas’ lower reliance on daily newspapers (15% often get news from them, compared with 24% in areas with a higher median age). At the same time, individuals living in these younger areas see more topics as critical to follow daily: 29% say five or more topics are important for their daily life, compared with 18% of those in higher median age areas.
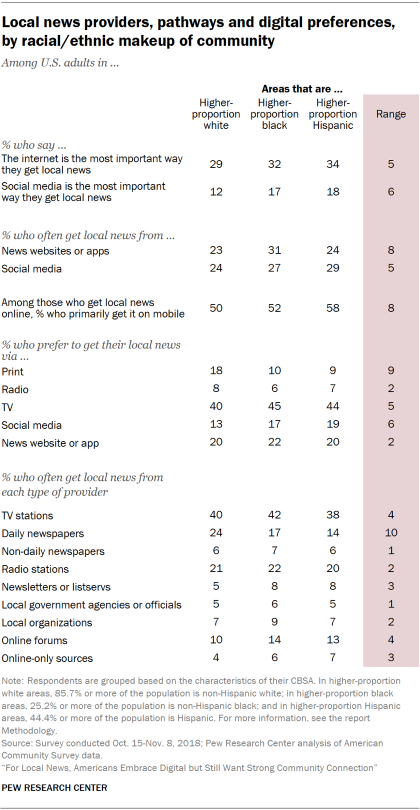
Race and ethnicity: Americans living in areas with higher proportions of blacks, higher proportions of Hispanics and higher proportions of whites differ notably in local news habits and attitudes. Residents of higher-proportion Hispanic areas stand out in saying their local journalists should express their views on local issues: 48% in these communities say so, compared with 38% in higher-proportion black communities and 30% in higher-proportion white communities. Residents in higher-share Hispanic areas are also more likely than those in higher-share white areas to view their local media as influential (43% vs. 37%; those in higher-share black areas fall in between at 40%). And residents of both higher-proportion black and Hispanic areas are less likely than those in higher-proportion white areas to say local journalists are in touch with their community. Those in both higher-share Hispanic and black areas place more importance on several local news topics than those in higher-share white areas. These topics include crime, traffic, changing prices, jobs, community activities and schools.
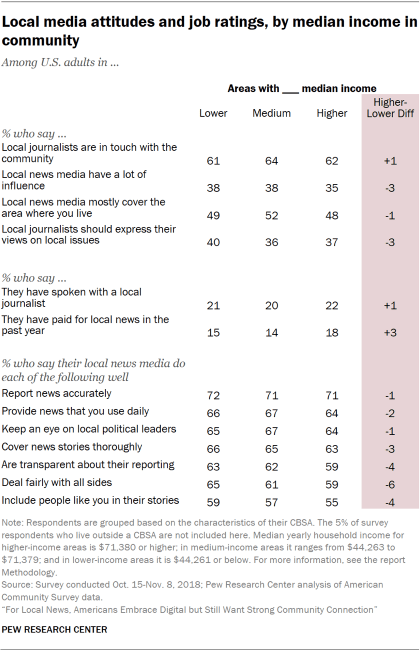
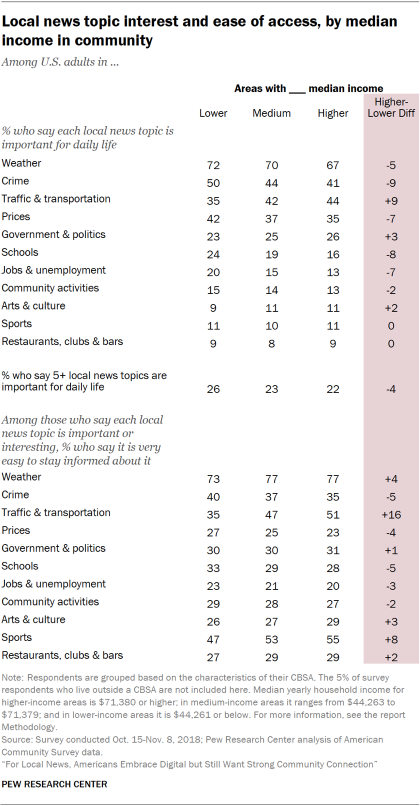
Income: Residents of areas with lower median income stand apart from those living in areas with higher median income for their greater reliance on television: 44% of residents prefer getting their local news through the TV set rather than through other pathways like print, compared with 31% of people in higher-income areas. These residents are also more likely to get online local news primarily on mobile devices (56% vs. 48% of those in higher median income areas) and from social media (28% get local news there often vs. 23% of those living in higher-income areas). Finally, those in lower-income areas express a greater need to get daily news on crime, changing prices, jobs and schools, while those in higher-income areas are more likely to say traffic and transportation news are critical.
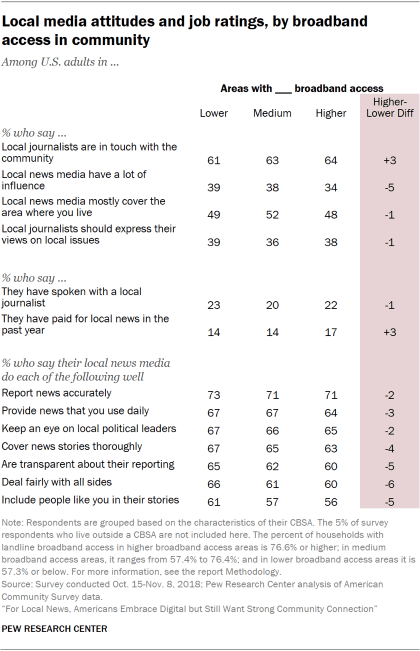
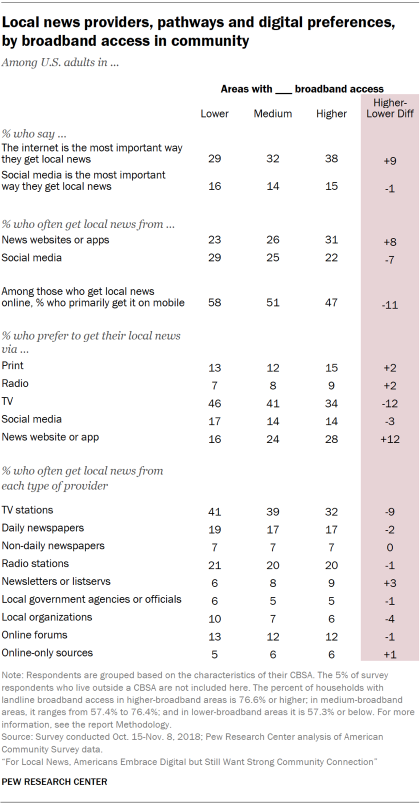
Broadband: Differences between residents living in areas with higher and lower access to broadband internet are very similar to differences by median household income, in part because of the high degree of crossover between the groups: 78% of those in communities with more broadband access are also in higher-income communities, and 65% in communities with less access are also in lower-income communities. As such, those in areas with less broadband access are more likely to prefer the TV as a pathway to local news and to primarily use mobile devices to access local news online. They also place more importance on crime, changing prices, jobs and schools.
Voter turnout: Those who live in areas with lower voter turnout in the 2016 election see somewhat less community connection from their local media: They are less likely to say their local journalists are in touch with the community (62% say this vs. 67% of those in higher voter turnout areas) and less likely to have ever spoken with a local journalist (17% vs. 23% of those in higher-turnout areas). They also have a somewhat different idea about the appropriate role of their local journalists: 45% say local journalists should express their views on local issues, compared with 31% of those who live in areas with higher voter turnout. Those in lower turnout areas do, however, place more importance on a broader range of local news topics, with 31% saying five or more topics are important for daily life, compared with 18% of those in higher-turnout areas.
Those in higher-proportion Hispanic communities more accepting of journalists’ personal views on issues; those in higher-proportion black and Hispanic communities place more importance on social media for local news
U.S. adults living in local areas with a higher proportion of Hispanic residents are much more likely to say that journalists should express their views on local issues (48%) than those in either higher-proportion white (30%) or black (38%) areas. They are also somewhat more likely to think the media have a lot of influence in their local communities (43%) than those in higher-share white (37%) areas.
Residents of higher-proportion Hispanic areas are also less likely than either of the other two groups to have ever spoken with a local journalist (17%, compared with 26% of those in higher-proportion white and 23% in higher-proportion black areas).
Those in higher-proportion Hispanic and black areas are distinct from higher-proportion white areas in the local news topics they value
Americans living in communities with particularly high shares of Hispanics and of blacks are more likely to say most key local news topics are important for their daily lives than those in higher-proportion white areas. This includes crime news, changing prices and jobs. This difference also comes through in the total number of topics deemed to have daily importance. Americans living in higher-proportion Hispanic areas are the most likely to say five or more topics are important to follow for daily life (32%), followed by those in higher-share black areas (28%). Both outpace individuals in higher-share white areas (16%).
There are also some slight differences across community types in reliance on social media for news. Residents of higher-proportion Hispanic and black areas are more likely to see social media sites as the most important way to keep up with local news (18% and 17%, respectively, compared with 12% of those living in higher-proportion white areas).
At the same time, fewer residents of higher-proportion Hispanic or black areas think local journalists are in touch with their communities. Among residents of higher-proportion white areas, about seven-in-ten (69%) feel local journalists are in touch, while six-in-ten of those in higher-share black and Hispanic areas say this.
People in higher-proportion white areas show greater use of newspapers and non-digital formats
Those living in higher-proportion white areas are about twice as likely to prefer getting local news via print (18%) as those living in higher-proportion black (10%) or Hispanic (9%) areas. In addition, about a quarter (24%) of those living in higher-share white areas often get news from a local daily newspaper, more than those living in higher-proportion black (17%) and Hispanic (14%) areas.
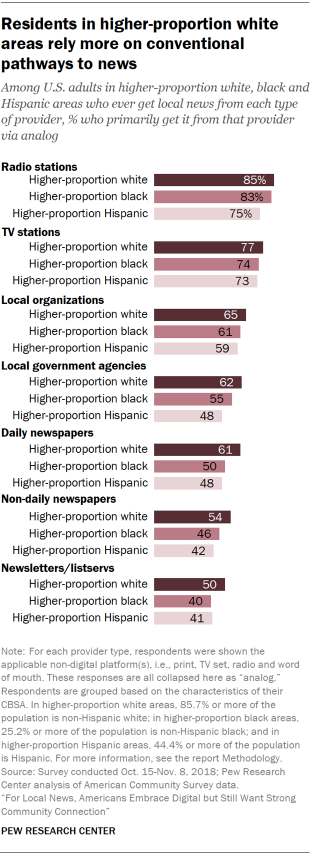
And when getting news from local news providers, U.S. adults in higher-proportion white areas show a distinct preference for more conventional formats, such as reading the print version of their local newspaper. For instance, those in higher-proportion white areas who get news from newsletters and listservs are more likely to prefer a print product to one on the web or social media than those in higher-proportion black or Hispanic areas.
In looking at these results, larger differences often exist between different types of people – the younger and older, adults with higher and lower incomes, etc. – than between different types of communities. For example, those in higher-proportion Hispanic communities were 18 percentage points more likely than those in higher-proportion white areas to say local journalists should express their opinions (48% vs. 30%). But Hispanic individuals – regardless of whether they live in a higher-proportion Hispanic area or elsewhere – were 27 points more likely to say this than white individuals.
This is to be expected. Communities are never as homogenous as the demographic group that researchers compile to profile differences in the population at large. Even in low-broadband communities, for instance, between a quarter and 57% of households still have high-speed broadband internet, and so an analysis of these low-broadband communities will still include a sizable portion of people that do have high-speed internet.
The influence of community characteristics on local news behaviors and attitudes is indirect: These characteristics influence something else that, in turn, influences these attitudes and behaviors. For example, local TV stations serving a community where fewer homes have broadband might put fewer resources into their digital offerings, resulting in less online local news in that community, and thus less interest among local residents in getting news online. In contrast, individuals who don’t have broadband internet might simply be unable to access news video or graphic-intensive online content, directly depressing their online news use. As such, community influences should be less than individual influences – but still very much present.
Detailed tables showing data by community characteristics
The tables below show how residents of different types of communities responded to selected questions from the survey.
This report was made possible by The Pew Charitable Trusts, which received support from the Google News Initiative.
About the Google News Initiative
The Google News Initiative is Google’s effort to work with the news industry to help journalism thrive in the digital age. We work with thousands of news organizations to meet their business needs and industry challenges. Through our partnerships, programs and products, we aim to meet the needs of journalists and news organizations so they can succeed on the web. The Google News Initiative also conducts research on topics critical to the future of journalism and fosters innovation in the industry.
Pew Research Center staff
This report is a collaborative effort based on the input and analysis of the following individuals. Find related reports online at www.pewresearch.org/pewresearch-org/journalism.
Primary researchers
Amy Mitchell, Director, Journalism Research
Katerina Eva Matsa, Associate Director, Journalism Research
Michael Barthel, Senior Researcher
Andrew Mercer, Senior Research Methodologist
Elizabeth Grieco, Senior Writer
Galen Stocking, Computational Social Scientist
Elisa Shearer, Research Associate
Nami Sumida, Research Analyst
Arnold Lau, Research Analyst
Mason Walker, Research Assistant
Sophia Fedeli, Research Assistant
Research team
Claudia Deane, Vice President, Research
Courtney Kennedy, Director, Survey Research
Nick Bertoni, Panel Manager
Jeffrey Gottfried, Senior Researcher
José Carreras-Tartak, Intern
Pankhuri Kumar, Google Fellow
Immanuel Adriana Rakshana, Intern
Graphic and digital design
Michael Piccorossi, Director, Digital Strategy
Stacy Rosenberg, Associate Director, Digital
Peter Bell, Design Director
Margaret Porteus, Information Graphics Designer
Sara Atske, Assistant Digital Producer
Seth Rubenstein, Lead Developer
Benjamin Wormald, Web Developer
Ariana Rodriguez-Gitler, Digital Producer
Communications and publishing
Rachel Weisel, Communications Manager
Hannah Klein, Communications Associate
David Kent, Copy Editor
Calvin Jordan, Communications Associate
Karla Georges, Temporary Communications Assistant
Maria Balzer, Temporary Communications Assistant
Methodology
This report and accompanying digital interactive tool are based on a nationally representative Pew Research Center survey of 34,897 U.S. adults, conducted October 15-November 8, 2018, on both the Center’s American Trends Panel (ATP) and Ipsos’s KnowledgePanel. The first part of the report presents the survey results at the national level. The second and third parts of the report, as well as the interactive tool, analyze and present survey results at the local level, using CBSAs – or core-based statistical areas – as the main unit of analysis. (See more on what a CBSA is below.) This report was made possible by The Pew Charitable Trusts, the Center’s primary funder, which received support from the Google News Initiative.
The ATP and KnowledgePanel are national probability-based online panels of U.S. adults. Panelists participate via self-administered web surveys. On both the ATP and KnowledgePanel, panelists who do not have internet access are provided with an internet connection and device that can be used to take surveys. Interviews are conducted in both English and Spanish. The ATP is managed by Ipsos.
All active ATP panel members were invited to participate in this survey. All members of the KnowledgePanel living in the 53 most populous CBSAs were invited to participate, while those in less populous CBSAs were sampled at a lower rate. Of the 34,897 respondents in total, 10,654 came from the ATP and 24,243 came from the KnowledgePanel.
The ATP was created in 2014, with the first cohort of panelists invited to join the panel at the end of a large, national, landline and cellphone random-digit-dial survey that was conducted in both English and Spanish. Two additional recruitments were conducted using the same method in 2015 and 2017, respectively. Across these three surveys, a total of 19,718 adults were invited to join the ATP, of which 9,942 agreed to participate.
In August 2018, the ATP switched from telephone to address-based recruitment. Invitations were sent to a random, address-based sample (ABS) of households selected from the U.S. Postal Service’s Delivery Sequence File. In each household, the adult with the next birthday was asked to go online to complete a survey, at the end of which they were invited to join the panel. For a random half-sample of invitations, households without internet access were instructed to return a postcard. These households were contacted by telephone and sent a tablet if they agreed to participate.
KnowledgePanel uses a combination of random-digit dialing (RDD) and address-based sampling (ABS) methodologies to recruit panel members (in 2009 KnowledgePanel switched its sampling methodology for recruiting members from RDD to ABS).
KnowledgePanel continually recruits new panel members throughout the year to offset panel attrition as people leave the panel.
Weighting
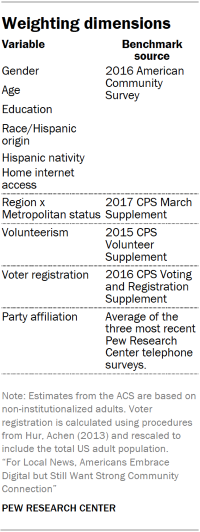
The data were weighted in a multistep process that begins with a base weight incorporating the respondents’ original survey selection probability and the fact that in 2014 and 2017 some ATP respondents were subsampled for invitation to the panel. The next step in the weighting uses an iterative technique that aligns the sample to population benchmarks on the dimensions listed in the accompanying table.
A total of 34,897 panelists responded out of 62,757 who were sampled, for a response rate of 56%. The cumulative response rate accounting for nonresponse to the recruitment surveys and attrition is 1.8%. The margin of sampling error for the full sample of 34,897 respondents is plus or minus 0.8 percentage points.
Sampling errors and statistical-significance tests take into account the effect of weighting. In addition to sampling error, one should bear in mind that question wording and practical difficulties in conducting surveys can introduce error or bias into the findings of opinion polls.
Main source for local news
In an open-ended question, respondents were asked to volunteer the news source they turn to most often for local news. This allowed respondents to write in any news organization or source, not limiting them to specific providers. Researchers grouped these open-ended responses together by brand. For example, responses such as “Chicago Tribune,” “chicago trib” and “chicagotribune.com” were all grouped together under Chicago Tribune.
Researchers took several steps to analyze more than 16,000 individual responses in 31 CBSAs with enough respondents to permit their individual analysis (see list below). Results were analyzed separately for each individual CBSA. The local news sources shown in the report and in the interactive are those that were named by multiple people and by at least 2% of the weighted sample in a CBSA. Local news sources not meeting this threshold in an individual CBSA were coded as “Other.”
Volunteered local news sources based outside of the respondent’s CBSA are shown when they meet the reporting threshold; otherwise they are grouped into “Other.” For example, in Boston, 3% named WMUR, a local television station that serves the neighboring Manchester, New Hampshire, area. Given Manchester’s proximity to Boston, WMUR is the main source of local news for a small portion of Boston residents and is therefore listed as a local news source of Boston-area residents in the interactive. Daily newspapers of large cities (e.g. The New York Times, Los Angeles Times) were coded as local news sources.
Results for the 31 CBSAs coded in the interactive and the report were individually produced and reviewed by three researchers.
There were some limited cases where respondents did not name a local news source as their main source for local news. Responses that name a national source are grouped into “National news source.” In addition, respondents who did not provide a response, or gave a response indicating they do not have or do not know their main source (e.g., “N/A,” “None,” “DK”), are listed separately as “None/Refused.”
For local main source results for the 31 CBSAs, visit the accompanying digital interactive tool.
CBSAs included in main source analysis
Below is a list of the 31 CBSAs for which the main source open end was analyzed.
1. Atlanta-Sandy Springs-Roswell, GA
2. Baltimore-Columbia-Towson, MD
3. Boston-Cambridge-Newton, MA-NH
4. Chicago-Naperville-Elgin, IL-IN-WI
5. Cincinnati, OH-KY-IN
6. Cleveland-Elyria, OH
7. Columbus, OH
8. Dallas-Fort Worth-Arlington, TX
9. Denver-Aurora-Lakewood, CO
10. Detroit-Warren-Dearborn, MI
11. Houston-The Woodlands-Sugar Land, TX
12. Indianapolis-Carmel-Anderson, IN
13. Kansas City, MO-KS
14. Los Angeles-Long Beach-Anaheim, CA
15. Miami-Fort Lauderdale-West Palm Beach, FL
16. Milwaukee-Waukesha-West Allis, WI
17. Minneapolis-St. Paul-Bloomington, MN-WI
18. New York-Newark-Jersey City, NY-NJ-PA
19. Orlando-Kissimmee-Sanford, FL
20. Philadelphia-Camden-Wilmington, PA-NJ-DE-MD
21. Phoenix-Mesa-Scottsdale, AZ
22. Pittsburgh, PA
23. Portland-Vancouver-Hillsboro,OR-WA
24. Riverside-San Bernardino-Ontario, CA
25. St. Louis, MO-IL
26. San Antonio-New Braunfels, TX
27. San Diego-Carlsbad, CA
28. San Francisco-Oakland-Hayward, CA
29. Seattle-Tacoma-Bellevue, WA
30. Tampa-St. Petersburg-Clearwater, FL
31.Washington-Arlington-Alexandria, DC-VA-MD-WV
Local area analysis and interactive tool
Part Two of the report is a closer look at four individual core-based statistical areas (CBSAs): San Antonio-New Braunfels, TX; Minneapolis-St. Paul-Bloomington, MN-WI; Riverside-San Bernardino-Ontario, CA; and Cincinnati, OH-KY-IN. The accompanying digital interactive tool presents results for 99 of the 933 CBSAs in the United States (see below for CBSA description). The estimates for these individual CBSAs were produced using a method known as multilevel regression and poststratification (MRP), a statistical method designed to compute more precise estimates for small subgroups than is possible with conventional survey analysis techniques such as those used for the main survey analysis in this report. The remaining 833 CBSAs were organized into six groups consisting of CBSAs with similar community characteristics, and estimates shown in the digital interactive tool correspond to these groupings. (One CBSA – Vineyard Haven, MA – was not included because the Census API did not consistently return data for it.) For example, when a user searches for data on Topeka, Kansas, the interactive tool will show results for the group Topeka belongs to, which also includes 219 other local areas. This is also explained in more detail below.
It is not possible to use MRP to produce more precise estimates for the main sources of local news in individual CBSAs. This is because each CBSA has its own, unique set of local news sources, while MRP would require that the response options be the same for every CBSA. Instead, the main source estimates shown in the online interactive tool and in the report are estimated using the same survey weights and methods as the national estimates in Part One of the report. As a result, they are shown only for the 31 CBSAs with a sufficiently large number of respondents.
What are CBSAs?
CBSAs – or core-based statistical areas – are geographic areas defined by the U.S. federal government as consisting of at least one urban core of 10,000 people or more, plus adjacent counties that are socio-economically tied to the urban center.
There are two types of CBSAs: metropolitan statistical areas and micropolitan statistical areas. A metropolitan statistical area must have at least one urban core with a population of 50,000 or more inhabitants. A micropolitan statistical area must have at least one urban core with a population of at least 10,000 and less than 50,000 people. In total, there are 933 CBSAs in the 50 states and the District of Columbia, comprised of 1,825 counties. About 94% of Americans live in one of these CBSAs. According to the U.S. Census Bureau’s 2016 Population Estimates, the median CBSA contains about 74,000 residents. Nationally, population size is unevenly distributed, with only 40 CBSAs accounting for about half of the total U.S. population. With a population of over 20 million people, New York-Newark-Jersey City, NY-NY-PA is the largest CBSA in the country. Vernon, TX, Craig, CO, and Lamesa, TX, each with a population of about 13,000, are the smallest CBSAs in the country. (One CBSA – Vineyard Haven, MA – was not included because the Census API did not consistently return data for it.)
There are also 1,317 counties that do not belong to any CBSA because they do not meet the inclusion criteria. Containing 6% of the population, these counties are more rural and sparsely populated than counties belonging to CBSAs.
When looking at local news, counties are sometimes grouped in designated market areas (DMAs), commonly referred to as media markets. A DMA is a group of counties that are all primarily covered by the same set of local network television stations. This means that people who live in the same DMA all get the same local news broadcasts, even though they may live in different cities or counties. There are 210 DMAs across the continental United States, Hawaii, and parts of Alaska, according to Nielsen, versus 933 CBSAs. This means that many DMAs cover multiple CBSAs.
For this analysis, researchers chose CBSAs as the unit of analysis because unlike DMAs, whose boundaries are defined by the range of television broadcasts, CBSAs are designed to be groups of counties that share a level of social and economic integration. When it comes to local news, two CBSAs that belong to the same DMA may not be equally well served by their local stations. Additionally, there is a wealth of supplementary data about CBSAs (or that can be aggregated to the CBSA level) that can be obtained from the U.S. Census Bureau and other sources. The survey sample of about 35,000 respondents offers a unique opportunity to study these kinds of community dynamics and delve into people’s local news habits and attitudes beyond their TV market.
On first reference in the report and the interactive, CBSAs are referred to by their full name as used by the Census Bureau, such as “Scranton–Wilkes-Barre–Hazleton, PA.” Subsequent references refer to the main population center. In this example, the report uses “Scranton, PA” or the “Scranton area” in secondary references.
Multilevel regression and poststratification
To maximize the number of CBSAs that could be reported individually in the online interactive tool, researchers employed a technique called multilevel regression and poststratification (MRP). MRP is a statistical method designed to allow more precise survey estimates, that is, estimates with a smaller margin of error, for subgroups with sample sizes that are too small to analyze with conventional methods.15
For this study, MRP involved first fitting a multilevel regression model to the survey data with the outcome variable of interest as the dependent variable, and a combination of respondent demographics and aggregate CBSA characteristics drawn from external sources (e.g., population size or median household income) as independent variables. This model is then used to predict the value of the dependent variable for all noninstitutionalized adults in the 2016 American Community Survey 1-Year Public Use Microdata Sample (PUMS). Finally, estimates are calculated using the average of the predicted values for the ACS respondents in each CBSA.
Multilevel regression model specification
The first step in computing survey estimates with MRP involved fitting multilevel regression models for each dependent variable.16 The models were fit using the Bayesian regression modeling package brms for the R statistical computing platform.17 Logistic regression was used for variables with only two response options. Categorical variables with more than two response options were modeled using multinomial logistic regression, while variables with ordered response options (e.g., Very, Somewhat, A little, Not at all) were modeled using cumulative logistic regression.
All of the regression models used the same basic specification. It assumed variable intercepts with crossed random effects for CBSA and state, and respondent-level main effects for age, sex, race and Hispanic ethnicity, home internet access, and census division.18
CBSA-level variables were obtained from external data sources and appended to the survey data, meaning that respondents who came from the same CBSA all had the same values for the appended variables. These variables are listed in the accompanying table along with their respective sources. Before being appended to the survey data, CBSA-level variables with skewed distributions were transformed to be more symmetrical. For computational reasons all CBSA-level variables were standardized and mean-centered.
These models were fit using a Bayesian framework, which means that it is necessary to specify a prior distribution for each parameter in the model. These models used uniform or “flat” priors for the intercepts and regression coefficients. The prior distributions for the state and CBSA random effects were set to the default values for the brms package, specifically a t-distribution with three degrees of freedom, a mean of zero and a standard deviation of 10.
Because not all the variables used in the survey weighting are asked on the American Community Survey (ACS), the main survey weights were used in the regression to minimize inconsistencies between the MRP estimates and the weighted survey estimates used throughout the report. With the brms package, this is done by making each case’s contribution to the log likelihood proportional its weighted value.
Poststratification
Computing MRP estimates for an individual CBSA requires knowing what share of its adult population belongs to every possible combination of characteristics defined by the independent variables in the model, specifically age, sex, race/ethnicity, home internet access, state and census division. These figures were calculated using the 2016 American Community Survey 1-Year Public Use Microdata Sample (PUMS).
For privacy reasons, the Census Bureau does not release CBSA as part of its ACS PUMS files. Instead, the smallest geographic unit available for respondents is their public use microdata area (PUMA). PUMAs are geographically contiguous groups of census tracts and counties containing at least 100,000 people. Of the 2,351 PUMAs in the United States, 1,872 (about 80%) are entirely contained within a single CBSA, or have portions that do not belong to any CBSA. The remaining 479 PUMAs have portions falling into two or more CBSAs. This means that for ACS respondents from these crossover PUMAs, it is not possible to know with certainty the CBSA in which they truly reside.
To address the mismatch between PUMA and CBSA, researchers applied the following procedure for each CBSA. First, the ACS data were filtered to cases from those PUMAs that are either partially or completely contained within the CBSA. The weights for those cases were then multiplied by the proportion of the PUMA’s population that lives in that CBSA according to figures from the 2010 decennial census.19 This approach assumes that individuals who live in the same PUMA but different CBSAs do not differ substantially with respect to their demographic distributions. Researchers validated this assumption by comparing each CBSA’s demographic distributions calculated using these modified PUMS weights to pre-tabulated Census estimates based on the complete, nonpublic ACS dataset and found the differences to be negligible.
Next, a poststratification frame for the CBSA was created by assigning every ACS respondent to a cell based on the full cross-classification of sex, age, race/ethnicity, home internet access, state and census division. The CBSA-level variables used in the model were then appended, and the number of adults belonging to each cell was calculated as the sum of the weights for each ACS respondent in that cell.
In the last step, a regression model was used to predict the mean values of the dependent variable for every cell in the CBSA. For a given dependent variable, the overall estimate for the entire CBSA is then the average of the cell-means weighted by their size. This process is repeated for every dependent variable and every CBSA.
The level of uncertainty for every estimate was computed by summarizing 2,000 draws from each regression model’s posterior predictive distribution. The point estimates discussed are the mean values over the posterior distribution for each estimate. The “modeled margin of error” for each estimate is half the width of a 95% Bayesian credibility interval. Although they have different philosophical interpretations, this quantity was intentionally chosen due to its similarity to the more familiar “margin of sampling error” commonly reported by pollsters, that is, half of the width of a 95% frequentist confidence interval.
Although MRP made it possible to report individual estimates for many more CBSAs than would have been possible using standard methods, there were still many CBSAs for which sufficiently precise estimates were not possible. The 99 CBSAs reported individually were those for which all the MRP estimates to be included in either the report or the digital interactive tool had a modeled margin of error less than 12 percentage points. This threshold was chosen to balance the competing interests of reporting on as large and diverse a set of communities as possible while ensuring that all the estimates shown met at least some minimum standard for precision.
It is important to note that a margin of error of 12 percentage points is not typical, but rather the maximum for any single estimate out of a total of 147 separate estimates calculated across 51 different variables. For the 99 CBSAs, most estimates are much more precise, with an average modeled margin of error of plus or minus 4.2 percentage points. The CBSA with the least precise estimates was Salem, Oregon, where the average came to plus or minus 6.2 points, and even in this case about a third of the estimates have margins of error under 4 points.
CBSAs individually shown in the online interactive tool
Below is a list of the 99 CBSAs for which results are estimated using MRP, and which are shown individually in the interactive. Collectively they cover approximately 66% of the total population in the 50 states and the District of Columbia.
1. Akron, OH
2. Albany-Schenectady-Troy, NY
3. Albuquerque, NM
4. Allentown-Bethlehem-Easton, PA-NJ
5. Atlanta-Sandy Springs-Roswell, GA
6. Austin-Round Rock, TX
7. Bakersfield, CA
8. Baltimore-Columbia-Towson, MD
9. Baton Rouge, LA
10. Birmingham-Hoover, AL
11. Boise City, ID
12. Boston-Cambridge-Newton, MA-NH
13. Bridgeport-Stamford-Norwalk, CT
14. Buffalo-Cheektowaga-Niagara Falls, NY
15. Cape Coral-Fort Myers, FL
16. Charlotte-Concord-Gastonia, NC-SC
17. Chicago-Naperville-Elgin, IL-IN-WI
18. Cincinnati, OH-KY-IN
19. Cleveland-Elyria, OH
20. Columbia, SC
21. Columbus, OH
22. Corpus Christi, TX
23. Dallas-Fort Worth-Arlington, TX
24. Dayton, OH
25. Deltona-Daytona Beach-Ormond Beach, FL
26. Denver-Aurora-Lakewood, CO
27. Des Moines-West Des Moines, IA
28. Detroit-Warren-Dearborn, MI
29. El Paso, TX
30. Fayetteville-Springdale-Rogers, AR-MO
31. Fresno, CA
32. Grand Rapids-Wyoming, MI
33. Greensboro-High Point, NC
34. Greenville-Anderson-Mauldin, SC
35. Harrisburg-Carlisle, PA
36. Hartford-West Hartford-East Hartford, CT
37. Houston-The Woodlands-Sugar Land, TX
38. Indianapolis-Carmel-Anderson, IN
39. Jacksonville, FL
40. Kansas City, MO-KS
41. Knoxville, TN
42. Lakeland-Winter Haven, FL
43. Lancaster, PA
44. Las Vegas-Henderson-Paradise, NV
45. Lexington-Fayette, KY
46. Los Angeles-Long Beach-Anaheim, CA
47. Louisville/Jefferson County, KY-IN
48. Madison, WI
49. McAllen-Edinburg-Mission, TX
50. Memphis, TN-MS-AR
51. Miami-Fort Lauderdale-West Palm Beach, FL
52. Milwaukee-Waukesha-West Allis, WI
53. Minneapolis-St. Paul-Bloomington, MN-WI
54. Modesto, CA
55. Myrtle Beach-Conway-North Myrtle Beach, SC-NC
56. Nashville-Davidson–Murfreesboro–Franklin, TN
57. New Haven-Milford, CT
58. New Orleans-Metairie, LA
59. New York-Newark-Jersey City, NY-NJ-PA
60. North Port-Sarasota-Bradenton, FL
61. Ogden-Clearfield, UT
62. Oklahoma City, OK
63. Omaha-Council Bluffs, NE-IA
64. Orlando-Kissimmee-Sanford, FL
65. Philadelphia-Camden-Wilmington, PA-NJ-DE-MD
66. Phoenix-Mesa-Scottsdale, AZ
67. Pittsburgh, PA
68. Portland-South Portland, ME
69. Portland-Vancouver-Hillsboro, OR-WA
70. Providence-Warwick, RI-MA
71. Provo-Orem, UT
72. Raleigh, NC
73. Richmond, VA
74. Riverside-San Bernardino-Ontario, CA
75. Rochester, NY
76. Sacramento–Roseville–Arden-Arcade, CA
77. Salem, OR
78. Salt Lake City, UT
79. San Antonio-New Braunfels, TX
80. San Diego-Carlsbad, CA
81. San Francisco-Oakland-Hayward, CA
82. San Jose-Sunnyvale-Santa Clara, CA
83. Scranton–Wilkes-Barre–Hazleton, PA
84. Seattle-Tacoma-Bellevue, WA
85. Spokane-Spokane Valley, WA
86. Springfield, MA
87. St. Louis, MO-IL
88. Stockton-Lodi, CA
89. Tampa-St. Petersburg-Clearwater, FL
90. Toledo, OH
91. Tucson, AZ
92. Tulsa, OK
93. Urban Honolulu, HI
94. Virginia Beach-Norfolk-Newport News, VA-NC
95. Visalia-Porterville, CA
96. Washington-Arlington-Alexandria, DC-VA-MD-WV
97. Wichita, KS
98. Worcester, MA-CT
99. Youngstown-Warren-Boardman, OH-PA
The digital interactive: How Pew Research Center used clustering to provide estimates for groups of CBSAs
Even with the large sample size and MRP modeling, there are 833 CBSAs for which individual estimates could not be computed with sufficient precision. To allow members of the public who may be from those areas to still get a sense of local news habits in their local area, CBSAs with similar characteristics were grouped together. Estimates shown are for these groups of similar CBSAs rather than the individual CBSAs. The clustered estimates are also calculated using MRP. These groupings were formed using unweighted hierarchical clustering, which organized CBSAs using a variety of external data. Selecting the final clusters was an iterative process that involved experimentation with several clustering techniques and evaluating dozens of different combinations of CBSA characteristics taken from external data sources.
External data collection and variable selection for the clustering
The Center used a variety of CBSA-level variables, such as racial diversity, age, income and broadband penetration to create the different clusters.
About 80 different CBSA-level variables were collected for this analysis from the 2012-2016 American Community Survey (ACS). Also collected were data on voter turnout using 2016 voting data from Dave Leip’s Atlas of U.S. Presidential Elections and newspaper data from “The Expanding News Desert Database” by the University of North Carolina School of Media and Journalism’s Center for Innovation and Sustainability in Local Media. All ACS variables were downloaded via the Census API at the CBSA level. Newspaper data were provided at both the county and CBSA level and analyzed at the CBSA level. Voting variables (2016 voter turnout and the 2016 GOP presidential two-party vote share) were calculated by combining the number of votes in each county to get the number of raw votes per CBSA. Because Alaska does not report election results at the county level, the same statewide results were assigned to each of the four CBSAs in that state. Broadband access data relied on the 2013-2017 ACS because that was the first five-year dataset that included responses from all CBSAs for the broadband question used here.
Researchers first took steps to pare down the number of variables to be considered for use in the clustering. First, variables that correlated strongly with others were removed. For example, the households with internet variable had a high correlation (above 0.85) with the households with computers variable, so the households with computers variable was removed. In addition, researchers tried a variety of combinations of variables and removed those that consistently did not influence the results. Finally, population was transformed into quartiles to reduce the disproportionate effect of its highly skewed distribution. After these steps, 13 variables were used for the clustering, coming from the following sources:
Voter turnout in 2016, calculated by dividing the number of people that voted in the 2016 presidential election by the number of people over 18 (from the 2016 ACS 5-year file)
GOP presidential two-party vote share in 2016, calculated by dividing the number of votes Trump received by the number of votes Trump and Clinton received
UNC’s School of Media and Journalism’s Center for Innovation and Sustainability in Local Media News Desert Database:
Newspapers per capita
Unweighted hierarchical clustering
Several clustering techniques were tested using these data, including k-means clustering, hierarchical clustering and weighted clustering. Because the number of clusters must be selected in advance, final models were tested with between seven to 20 clusters. Models were evaluated according to whether or not the CBSA groupings made intuitive sense not just quantitatively but also substantively and qualitatively. Solutions that resulted in individual clusters that were disproportionately too large or too small to be analytically valuable were avoided. There were 833 CBSAs clustered this way; the 99 CBSAs for which individual estimates are reported were not included in the clustering analysis.
Ultimately, researchers settled on an unweighted hierarchical clustering model with nine clusters. Clusters with a sample size too small to analyze were combined with other similar clusters, resulting in six distinct clusters. Although the assessment necessarily involved a degree of subjectivity, this clustering solution was found to yield a relatively small set number of well-sized groups whose composition also made intuitive sense from a substantive perspective.
Analysis of local area characteristics
Many CBSAs share common characteristics, such as size, density and ethnic makeup of the population, that may impact how residents get news about their local area. This report examines how people’s local news habits and attitudes differ based on certain community characteristics such as age, household income, racial and ethnic diversity, broadband internet access and voter turnout. Unlike in the metro area analysis, this community analysis examines survey results across 932 CBSAs, using national survey weighting instead of the individual CBSA MRP estimates explained above.20 The variables used and the steps taken to analyze them are below.
Data sources used in the community analysis
The publicly available data sources used and the community-level variables pulled from each include:
Voter turnout in 2016, calculated by dividing the number of people that voted in the 2016 presidential election by the number of people over 18 (from the 2016 ACS 5-year file)
Defining the lower, medium and higher comparative groups
All of the publicly available data used in this analysis were collected at either the CBSA or county level of geography. When the external data were available at the county level only, the data were grouped into CBSAs using the Census Bureau’s August 2017 CBSA delineation file (all ACS data were collected at the CBSA level, while election data were collected at the county level). For each community-level variable, researchers categorized CBSAs into three comparative groups:
Lower group – includes CBSAs that rank relatively low in the community-level variable
Higher group – includes CBSAs that rank relatively high in the community-level variable
Medium group – includes the remaining CBSAs
To create these three groups, researchers found appropriate cutoff values for the community-level variable so that the lower and higher groups each comprised – in most cases – about 10% of the U.S. population residing in CBSAs.
Defining the lower group
CBSAs were first sorted by the community-level variable in ascending For example, the percent of the Hispanic population variable was sorted from lowest percentage (i.e., the CBSA with the smallest proportion of Hispanics, at 0.1%) to highest percentage (i.e., the CBSA with the largest proportion of Hispanics, at 99.0%).
Researchers then determined the cutoff value for the community-level variable by determining the CBSAs containing the 10% of the population with the lowest values for that variable. This was done by moving down the list of CBSAs (sorted by the variable being considered) and summing the population of each CBSA until the sum reaches 10% of the total population residing in CBSAs (excluding those who do not live in a CBSA). The value for the community-level variable for this CBSA is the cutoff value for the lower group.
All CBSAs with a community-level variable value that is less than or equal to this cutoff value were included in the lower group.
For instance, for the community-level variable measuring the percent of Hispanic population, the cutoff value for the lower group is 3.0% (the minimum value at which the summed population is about 10% of the total population residing in CBSAs). Therefore, the lower group is defined as CBSAs with a Hispanic population that is less than or equal to 3.0%.
Defining the higher group
CBSAs were first sorted by the community-level variable in descending order (the sort was in ascending order when defining the lower group). For example, the percent of the Hispanic population variable was sorted from highest percentage (i.e., the CBSA with the largest proportion of Hispanics, at 99.0%) to lowest percentage (i.e., the CBSA with the smallest proportion of Hispanics, at 0.1%).
Researchers then determined the cutoff value for the community-level variable by determining the CBSAs containing the 10% of the population with the highest values for that variable. This was done by moving down the list of CBSAs (sorted by the variable being considered) and summing the population of each CBSA until the sum reaches 10% of the total population residing in CBSAs (excluding those who do not live in a CBSA). The value for the community-level variable for this CBSA is the cutoff value for the higher group.
All CBSAs with a community-level variable value that is greater than or equal to this cutoff value were included in the higher group.
For the variable measuring the percent of Hispanic population, the cutoff value for the higher group is 44.4% (the minimum value at which the summed population is about 10% of the total population residing in CBSAs). Therefore, the higher group is defined as CBSAs with a Hispanic population that is greater than or equal to 44.4%.
Defining the medium group
CBSAs that did not fall into either the lower or higher group make up the medium group.
For the variable measuring the percent of Hispanic population, the medium group is defined as CBSAs with a Hispanic population that is between 3.1% and 44.3%.
For each community-level variable, each survey respondent was coded as high, medium, or low according to the CBSA in which they lived.