News Use Across Social Media Platforms 2018
Most Americans continue to get news on social media, even though many have concerns about its accuracy
About two-thirds of American adults (68%) say they at least occasionally get news on social media, about the same share as at this time in 2017, according to a new Pew Research Center survey. Many of these consumers, however, are skeptical of the information they see there: A majority (57%) say they expect the news they see on social media to be largely inaccurate. Still, most social media news consumers say getting news this way has made little difference in their understanding of current events, and more say it has helped than confused them (36% compared with 15%).
Republicans are more negative about the news they see on social media than Democrats. Among Republican social media news consumers, 72% say they expect the news they see there to be inaccurate, compared with 46% of Democrats and 52% of independents. And while 42% of those Democrats who get news on social media say it has helped their understanding of current events, fewer Republicans (24%) say the same.1 Even among those Americans who say they prefer to get news on social media over other platforms (such as print, TV or radio), a substantial portion (42%) express this skepticism.
Asked what they like about the news experience on social media, more Americans mention ease of use than content. “Convenience” is by far the most commonly mentioned benefit, (21%), while 8% say they most enjoy the interactions with other people. Fewer social media news consumers say they most like the diversity of the sources available (3%), or the ability to tailor the content they see (2%).
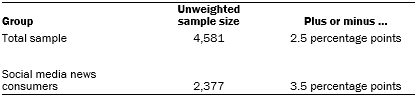
This study is based on a survey conducted July 30-Aug. 12, 2018, among 4,581 U.S. adults who are members of Pew Research Center’s nationally representative American Trends Panel.
Growth in social media news consumption slows down

About two-thirds of U.S. adults (68%) get news on social media sites, about the same as the portion that did so in 2017 (67%). One-in-five get news there often.

Facebook is still far and away the site Americans most commonly use for news, with little change since 2017. About four-in-ten Americans (43%) get news on Facebook. The next most commonly used site for news is YouTube, with 21% getting news there, followed by Twitter at 12%. Smaller portions of Americans (8% or fewer) get news from other social networks like Instagram, LinkedIn or Snapchat.
The prominence of each social media site in the news ecosystem depends on two factors: its overall popularity and the extent to which people see news on the site.

Reddit, Twitter and Facebook stand out as the sites where the highest portion of users are exposed to news – 67% of Facebook’s users get news there, as do 71% of Twitter’s users and 73% of Reddit users. However, because Facebook’s overall user base is much larger than those of Twitter or Reddit, far more Americans overall get news on Facebook than on the other two sites.
The other sites studied – including YouTube, Tumblr, Instagram, LinkedIn, Snapchat and WhatsApp – have less of a news focus among their user base. Fewer than half of each site’s users get news on each platform. Still both YouTube and LinkedIn saw these portions rise over the past year.
Nearly four-in-ten YouTube users (38%) say they get news on YouTube, slightly higher than the 32% of users who did so last year. And 30% of LinkedIn users get news there, up from 23% in 2017.
The percentage of U.S. adults who get news on two or more social media sites is 28%, little changed from 2017 (26%).
Demographics of social media news consumers
Social media sites’ news consumers can look vastly different in terms of their demographic makeup. For example, the majority of news consumers on Instagram are nonwhite. Three-quarters of Snapchat’s news consumers are ages 18 to 29, more than any other site. And LinkedIn, Twitter and Reddit’s news consumers are more likely to have bachelor’s degrees – 61% of LinkedIn’s news consumers do, as do 46% of Reddit’s news consumers and 41% of Twitter’s news consumers.

Most social media news consumers are concerned about inaccuracy, but many still see benefits
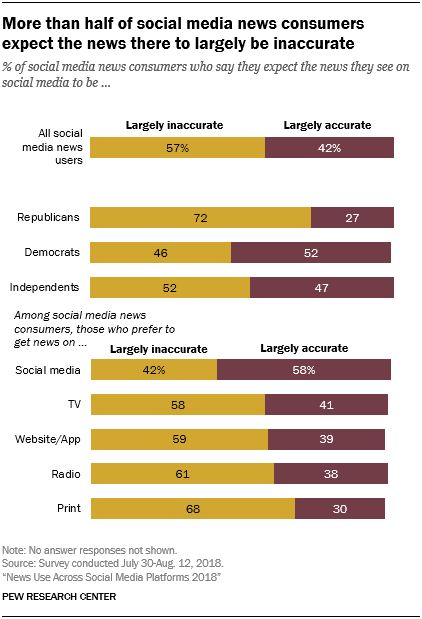
Even though a substantial portion of U.S. adults at least occasionally get news on social media, over half (57%) of these news consumers say they expect the news they see on social media to be largely inaccurate. This is consistent with the low trust in news from social media seen in past surveys. About four-in-ten (42%) expect the news they see on social media to be largely accurate.
Republicans are more likely than Democrats and independents to be concerned with the inaccuracy of the news they see on social media. Among social media news consumers, about three-quarters of Republicans say this (72%), compared with 46% of Democrats and about half of independents (52%). And, while there are some age differences in expectations of the accuracy of social media news, this party divide persists regardless of age.

Concerns about the inaccuracies in news on social media are prevalent even among those who say they prefer to get their news there – among this group, 42% say that they expect the news they see to largely be inaccurate. Still, those social media news consumers who prefer other platforms such as print or television for news are even more likely to say they expect the news on social media to be largely inaccurate.
Not only do social media news consumers expect the news they see there to be inaccurate, but inaccuracy is the top concern they bring up about information on social media. When asked an open-ended question about what they dislike most about getting news on social media, concerns about inaccuracy top the list, outstripping concerns about political bias and the bad behavior of others.2 Specifically, about three-in-ten (31%) social media news consumers say that inaccuracy is what they dislike most about the experience. Included in the responses about inaccuracy were concerns about unreliable sources, lack of fact checking, and “fake news.”
Politics surface as another negative aspect of social media, though at a lower rate – 11% who at least occasionally get news there say there is too much bias or political opinion, either on the part of the news organizations or the people on the platform. About the same share of social media news consumers (10%) say they dislike the low quality of news – such as lack of in-depth coverage, or clickbait-style headlines.
Convenience and ease seen as most enjoyable part of getting news on social media

Even though social media news consumers have concerns about the accuracy of the information there, they also cite some benefits of getting news on social media, which may help explain why getting news on the platform is still so common.
The most commonly named positive thing about getting news on social media is convenience – 21% say this is what they liked most, with responses such as “It’s very accessible,” “It’s available at the touch of a button” and “I don’t have to go looking for it.”
Respondents also say they like the interpersonal element: 8% of social media news consumers say they enjoy interacting with others – whether through discussing the news, sharing news with friends and family, or seeing what others’ opinions are. Speed and timeliness are also mentioned as positive aspects of getting news on social media – 7% say they like how quick it is to get news on social media, and 6% say they like that news there is up to date, with descriptions like “up to the minute” or “the most current.”
A fair share of respondents (12%) say they do not like anything about getting news on social media. This is higher than the percentage who volunteered that they do not dislike anything about news on social media in the previous question (only 4% say this).
About a third say social media positively affects their understanding of current events

About a third (36%) of the people who get news on social media say it has helped them better understand current events. Nearly half (48%) say it doesn’t have much of an effect on their understanding, and 15% say that news on social media has made them more confused about current events.
Among those who get news on social media, Republicans are less positive than Democrats and independents about how news there influences their understanding of the world around them: About a quarter (24%) say that social media news helps them better understand current events, compared with 42% of Democrats and 40% of independents.
Age is also a factor in the way people view the role of social media. Younger social media news consumers are more likely to say it has impacted their learning for the better. About half of social media news consumers ages 18 to 29 (48%) say news on social media makes them better informed, compared with 37% of those 30 to 49, 28% of those 50 to 64, and 27% of those 65 and older.